AUDSGD trade ideas

AUDSGDPossible sell. the famous M pattern has been formed, trend line has been broken, price is retesting the neck level. We expect price to fail its up move around 0.9800, then we'll short; Tp1: 0.9745; Tp 2: 0.9690; Tp3: 0.9610


AUSSIE SINGAPORE TRADEI find that the aud/sgd is in a daily uptrend now and with the sell off we have seen on the weekly chart shown here when price pullsback to the ema 89, now is potentially time to find the reversal now the daily will turn before the weekly. now the daily has turned it gives us an opportunity for a good longer term position for a lot of pips.


Entry - Top of wick or body? Hi Nic,
Should the entry be at the top of the candle or the top of the body? Assuming all of the rules are satisfied?

AUDSGDThe week ended with a bullish engulfing candle, suggesting a trend continuation upward. Our bias is long, up to 0.9800

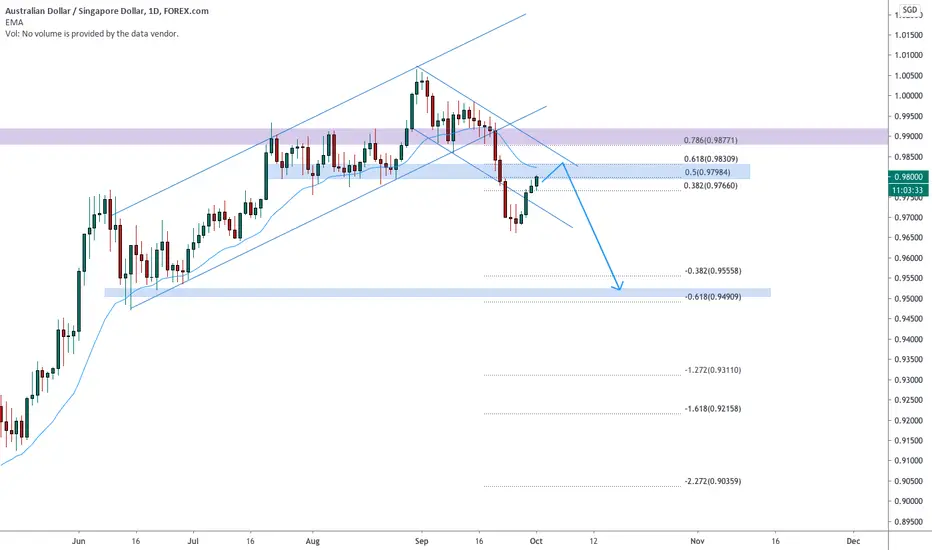
AUDSGD retrace for a new bearish leg? 🦐AUDSGD on the daily chart found support over the lower trendline of a descending channel.
The price couldn't break below and will probably move up for a retracement.
IF the price will test again the resistance area at 0.96800 and give us a sign of inversion we will set a nice short order according to Plancton's strategy.
–––––
Follow the Shrimp 🦐
Keep in mind.
• 🟣 Purple structure -> Monthly structure.
• 🔴 Red structure -> Weekly structure.
• 🔵 Blue structure -> Daily structure.
• 🟡 Yellow structure -> 4h structure.
• ⚫️ Black structure -> >4h structure.
Here is the Plancton0618 technical analysis , please comment below if you have any question.
The ENTRY in the market will be taken only if the condition of the Plancton0618 strategy will trigger.


Sell Set UpLooking for a sell on AUDSGD once the enviroment shifts from its current bullish to bearish

AUD vs. SGD to see further gains ahead (mid-term trend).
Pseudo inverse head in shoulder (re-accumulation like pattern).
AUD has broken out above the top descending trendline.
Buy signal already triggered.
Significant move higher if price manages to break above the 38.2% Fib level and retests it and successfully holds.
Measured move target to 0.084 SGD, which sets a higher high, establishing a longer-term bullish structure.
PRISM Analysis
Snap bend up sharply, which is presently pulling the AJ-ribbon (Acceneration and Jerk) higher with the lime-green Jerk oscillator leading the move (i.e. bullish). Expect momentum to see serious gains ahead.
Daily chart shows that AUD vs. SGD continues to be held up above the red 21 EMA level. Bearish if this breaks and it falls below the green 50 SMA level.
PRISM higher-differential-order oscillators looks like they are ready to curve upwards as well.
Weekly Chart
This is a continued shared/published analysis from:

AUDSGD wants to retest the 0.618 Fibonacci Level 🦐AUDSGD wants to retest the 0.618 Fibonacci Level after the price broke a descending channel.
According to Plancton's strategy, we can set a nice order
–––––
Follow the Shrimp 🦐
Keep in mind.
🟣 Purple structure -> Monthly structure.
🔴 Red structure -> Weekly structure.
🔵 Blue structure -> Daily structure.
🟡 Yellow structure -> 4h structure.
⚫️ Black structure -> >4h structure.
Here is the Plancton0618 technical analysis, please comment below if you have any question.
The ENTRY in the market will be taken only if the condition of the Plancton0618 strategy will trigger.
AUD/SGD Short SetupSetting this trade up. Thanks for viewing ! This is not financial advice , please consider your own Due Diligence and Risk Management.


