AUD/USD Aims Steady IncreaseAUD/USD Aims Steady Increase
AUD/USD started a decent increase above the 0.6450 and 0.6500 levels.
Important Takeaways for AUD USD Analysis Today
- The Aussie Dollar rebounded after forming a base above the 0.6400 level against the US Dollar.
- There is a connecting bullish trend line forming with support at 0.6510 on the hourly chart of AUD/USD at FXOpen.
AUD/USD Technical Analysis
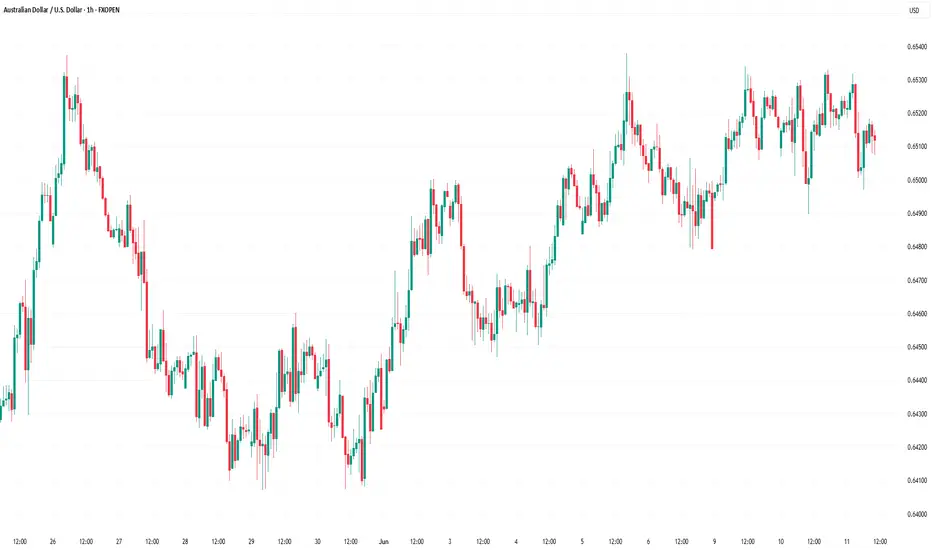
On the hourly chart of AUD/USD at FXOpen, the pair started a fresh increase from the 0.6450 support. The Aussie Dollar was able to clear the 0.6500 resistance to move into a positive zone against the US Dollar.
There was a close above the 0.6500 resistance and the 50-hour simple moving average. Finally, the pair tested the 0.6535 zone. A high was formed near 0.6533 and the pair recently started a consolidation phase.
There was a move below the 0.6520 level. The pair dipped below the 23.6% Fib retracement level of the upward move from the 0.6489 swing low to the 0.6533 high.
On the downside, initial support is near the 0.6510 level. There is also a connecting bullish trend line forming with support at 0.6510. It is close to the 50% Fib retracement level of the upward move from the 0.6489 swing low to the 0.6533 high.
The next major support is near the 0.6480 zone. If there is a downside break below the 0.6480 support, the pair could extend its decline toward the 0.6450 level.
Any more losses might signal a move toward 0.6420. On the upside, the AUD/USD chart indicates that the pair is now facing resistance near 0.6535. The first major resistance might be 0.6550. An upside break above the 0.6580 resistance might send the pair further higher.
The next major resistance is near the 0.6600 level. Any more gains could clear the path for a move toward the 0.6650 resistance zone.
This article represents the opinion of the Companies operating under the FXOpen brand only. It is not to be construed as an offer, solicitation, or recommendation with respect to products and services provided by the Companies operating under the FXOpen brand, nor is it to be considered financial advice.
AUDUSD trade ideas
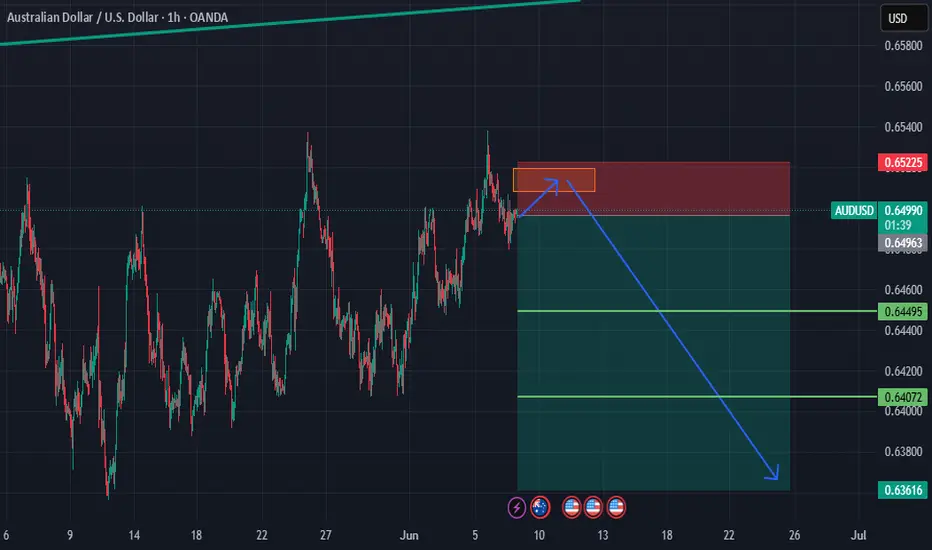
Lingrid | AUDUSD sideways Action at Monthly ResistanceThe price perfectly fulfilled my previous idea . OANDA:AUDUSD has broken below the short-term range and upward trendline near 0.6510, suggesting weakness after failing to hold the breakout. The price is now testing support from the lower boundary of the broader upward channel. A breakdown below 0.6475 may confirm a bearish swing toward deeper support levels.
📉 Key Levels
Sell trigger: confirmed rejection from 0.6510
Buy zone: 0.6460–0.6475 for rebound attempt
Target: 0.6475
Buy trigger: recovery and hold above 0.6510 with bullish momentum
💡 Risks
Reclaiming 0.6510 invalidates breakdown thesis
Channel support bounce could trap sellers
Upcoming macro data may trigger whipsaws in either direction
Traders, if you liked this idea or if you have your own opinion about it, write in the comments. I will be glad 👩💻

AUDUSD → Correction after a false breakout before growthFX:XAUUSD continues to rise amid uncertainty surrounding the dollar, which continues to consolidate. The currency pair is preparing to test resistance at 0.6537
The dollar is stuck in place due to market uncertainty. At the same time, the Australian dollar is strengthening and is ready to test the liquidity zone
Within the current trend, the currency pair is heading towards resistance and the liquidity zone. We opened far away, and as we move towards the target, the potential for further growth may end. A false breakout of 0.6537 could trigger a correction
Resistance levels: 0.6537
Support levels: 0.6509, 0.6479
A sharp move towards resistance without the possibility of further growth could cause a false breakout of 0.6537. Price consolidation below this level could trigger a correction before growth.
Best regards, R. Linda!

AUDUSD Follow the ascending channel selling now from resistanceOANDA:AUDUSD Technical Analysis
The AUD/USD pair is currently following a well-established ascending channel and is now selling off from a key supply zone at 0.65300.
Technical Targets:
1. First Target: 0.64800
2. Second Target: 0.64500
3. Third Target: 0.64100 (Bullish Order Block)
Time Frame: 1-Hour Chart 📊
Stay tuned for more updates, and don't forget to Like, Follow, and Comment for further insights. 🚀
Happy Trading! ✨

AUDUSD DistributionI will look for a valid entry from this 15m supply to enter a short to at least the range low of this model 1 distribution. This would then be a extended model 1 going over into a model 2 with a good return to zone so let's see. A entry would already be valid but i will either wait or skip for a better R/R.

AUD USD – Reloading at 0.6456Price just spiked into the 0.6455 zone If buyers defend it again, I’m eyeing 0.6530 for the next leg.worth keeping on the radar.

audusd for sell *The content on this analysis is subject to change at any time without notice, and is provided for the sole purpose of assisting traders to make independent investment decisions.
AUDUSD Start of Week DropThe DXY index has double bottomed and left a significant FVG at around $1. This has yet to retrace and market sentiment towards seeing the USD under $1 is tough. This FVG is likely to close this week as a last ditch effort to hold the USD at $1 level.
We have business confidence news twice in the early week that is likely to be not great pressuring the AUD, then later on we have USD news that will likely hold or temporarily bolster USD confidence. This is the dynamics shift that I believe will bring on that larger retracement of the USD to $1.
Be ready for a significant rejection once we arrive at the FVG though.

AUD/USD 4H CHART PATTERNThe AUD/USD daily chart displays a clear upward breakout from a consolidation phase, following a prolonged downtrend. The price is moving within an ascending channel and recently tested a key support zone (highlighted in blue), which held firmly. The Ichimoku cloud shows bullish momentum with price action above the cloud. Projected targets are based on pattern continuation and breakout potential. The chart anticipates further gains as bullish pressure builds. The overall trend suggests buying opportunities with well-defined targets and risk levels. Momentum indicators and price structure support a potential rally in the coming sessions.
Entry Point: 0.64950
First Target: 0.6700
Second Target: 0.69380
If you found this analysis helpful, don’t forget to drop a like and comment . Your support keeps quality ideas flowing—let’s grow and win together! 💪📈

audusd sell signal. Don't forget about stop-loss.
Write in the comments all your questions and instruments analysis of which you want to see.
Friends, push the like button, write a comment, and share with your mates - that would be the best THANK YOU.
P.S. I personally will open entry if the price will show it according to my strategy.
Always make your analysis before a trade

AUD/USD Breakout Watch: Eyes on 0.6558 and BeyondThe AUD/USD daily chart has just confirmed a breakout from a sustained consolidation zone that had kept price action capped for nearly two months. The breakout clears the psychological and technical resistance near the 0.6500 level and puts bulls back in control.
🔍 Key Technical Highlights:
Ascending Triangle Breakout: Price had been coiling into an ascending triangle with a horizontal resistance at 0.6500 and rising trendline support. Today's daily close above this resistance confirms the bullish breakout.
Golden Cross Support: The 50-day SMA (currently ~0.6386) has turned higher and is approaching the 200-day SMA (~0.6437), creating a potential "golden cross" that could add momentum to the uptrend.
MACD Confirmation: MACD has crossed above the signal line and is now back in positive territory, supporting the bullish bias.
RSI Momentum: RSI is rising and holding just below 60, suggesting there's still room to the upside before the pair becomes overbought.
Fibonacci Resistance Levels:
Immediate resistance is seen at the 61.8% retracement of the July–October 2024 decline near 0.6558.
Above that, the 78.6% retracement at 0.6730 becomes the next major target.
This breakout, backed by trendline support and bullish momentum signals, suggests AUD/USD could be entering a fresh impulsive leg higher.
-MW

AUDUSD - Medium term prediction - 16/06/25For AUD/USD here (0.6487) I’d peg the odds roughly at:
Rally above 0.6943 first ~60%
Drop below 0.6031 first ~40%
Why a tilt to the upside?
Higher-low structure: Since last year’s low near 0.594, price has formed progressively higher retracements (0.620 → 0.635 → 0.648).
Momentum: Daily candles have been predominantly bullish with shallow pullbacks, and there’s room before any clear overbought signals.
Mid‐range flip: The 0.6031 zone has held as support and the current range midpoint (~0.649) has been reclaimed on a sustained basis—suggesting buyers are in control through the mid‐band.

AUDUSD Potential UpsidesHey Traders, in the coming week we are monitoring AUDUSD for a buying opportunity around 0.64500 zone, AUDUSD is trading in an uptrend and currently is in a correction phase in which it is approaching the trend at 0.64500 support and resistance area.
Trade safe, Joe.

Bullish continuation?AUD/USD is falling towards the support level which is a pullback support that aligns with the 61.8% Fibonacci retracement and could bounce from this level to our take profit.
Entry: 0.6499
Why we like it:
There is a pullback support level that lines up with the 61.8% Fibonacci retracement.
Stop loss: 0.6483
Why we like it:
There is a pullback support level.
Take profit: 0.6537
Why we like it:
There is a pullback resistance level.
Enjoying your TradingView experience? Review us!
Please be advised that the information presented on TradingView is provided to Vantage (‘Vantage Global Limited’, ‘we’) by a third-party provider (‘Everest Fortune Group’). Please be reminded that you are solely responsible for the trading decisions on your account. There is a very high degree of risk involved in trading. Any information and/or content is intended entirely for research, educational and informational purposes only and does not constitute investment or consultation advice or investment strategy. The information is not tailored to the investment needs of any specific person and therefore does not involve a consideration of any of the investment objectives, financial situation or needs of any viewer that may receive it. Kindly also note that past performance is not a reliable indicator of future results. Actual results may differ materially from those anticipated in forward-looking or past performance statements. We assume no liability as to the accuracy or completeness of any of the information and/or content provided herein and the Company cannot be held responsible for any omission, mistake nor for any loss or damage including without limitation to any loss of profit which may arise from reliance on any information supplied by Everest Fortune Group.

AUDUSD Technical & Order Flow AnalysisOur analysis is based on a multi-timeframe top-down approach and fundamental analysis.
Based on our assessment, the price is expected to return to the monthly level.
DISCLAIMER: This analysis may change at any time without notice and is solely intended to assist traders in making independent investment decisions. Please note that this is a prediction, and I have no obligation to act on it, nor should you.
Please support our analysis with a boost or comment!

Bullish bounce off 38.2% Fibonacci support?The Aussie (AUD/USD) is falling towards the pivot which has been identified as a pullback support and could bounce to the 1st resistance.
Pivot: 0.6483
1st Support: 0.6447
1st Resistance: 0.6537
Risk Warning:
Trading Forex and CFDs carries a high level of risk to your capital and you should only trade with money you can afford to lose. Trading Forex and CFDs may not be suitable for all investors, so please ensure that you fully understand the risks involved and seek independent advice if necessary.
Disclaimer:
The above opinions given constitute general market commentary, and do not constitute the opinion or advice of IC Markets or any form of personal or investment advice.
Any opinions, news, research, analyses, prices, other information, or links to third-party sites contained on this website are provided on an "as-is" basis, are intended only to be informative, is not an advice nor a recommendation, nor research, or a record of our trading prices, or an offer of, or solicitation for a transaction in any financial instrument and thus should not be treated as such. The information provided does not involve any specific investment objectives, financial situation and needs of any specific person who may receive it. Please be aware, that past performance is not a reliable indicator of future performance and/or results. Past Performance or Forward-looking scenarios based upon the reasonable beliefs of the third-party provider are not a guarantee of future performance. Actual results may differ materially from those anticipated in forward-looking or past performance statements. IC Markets makes no representation or warranty and assumes no liability as to the accuracy or completeness of the information provided, nor any loss arising from any investment based on a recommendation, forecast or any information supplied by any third-party.

AUDUSD likely to reach level 0.64267AUDUSD is in uptrend and might have a pullback. AUDUSD likely to reach level 0.64267
This analysis is for educational purpose only. Not an investment or financial advise.

AUDUSD Will Fall! Short!
Take a look at our analysis for AUDUSD.
Time Frame: 3h
Current Trend: Bearish
Sentiment: Overbought (based on 7-period RSI)
Forecast: Bearish
The market is on a crucial zone of supply 0.650.
The above-mentioned technicals clearly indicate the dominance of sellers on the market. I recommend shorting the instrument, aiming at 0.647 level.
P.S
We determine oversold/overbought condition with RSI indicator.
When it drops below 30 - the market is considered to be oversold.
When it bounces above 70 - the market is considered to be overbought.
Disclosure: I am part of Trade Nation's Influencer program and receive a monthly fee for using their TradingView charts in my analysis.
Like and subscribe and comment my ideas if you enjoy them!

Audusd 1h📅 June 11, 2025
📣 Forex Signal – AUD/USD
🧭 Timeframe, Setup & Zone:
1h (analysis), 30m (confirmation)
Price is testing a strong supply zone that has historically triggered sharp bearish reversals. This area aligns with the 88.6% Fibonacci retracement, often signaling exhaustion of bullish momentum. Candlestick structure shows weakening buying pressure, with upper shadows and diminishing volume. This sell limit setup targets a high-probability reversal zone with attractive risk-reward potential.
🎯 Setup:
Entry 0.65248
SL 0.65348 (−10.0 pips)
TP1 0.65103 (+14.5 pips) – scalping
TP2 0.64935 (+31.3 pips) – primary
TP3 0.64771 (+47.7 pips) – intraday
TP4 0.64586 (+66.2 pips) – swing
TP5 0.63945 (+130.3 pips) – extended
(RR: 1:1.4 / 3.1 / 4.8 / 6.6 / 13.0)
📊 Indicators (30m):
• RSI shows momentum flattening near the overbought zone, signaling potential reversal
• Stochastic is in overbought territory, preparing a bearish crossover – early signal of seller dominance
📰 Fundamentals & Sentiment:
• AUD remains under pressure from weak export data and concerns over China’s economic slowdown
• USD is steady ahead of tonight’s US CPI release – stronger inflation could boost USD demand
• Short-term sentiment favors USD strength, especially with supportive data
📌 Summary:
The entry zone is a key technical supply area, backed by bearish signals from both price action and indicators. With market sentiment leaning toward USD strength, this setup is ideal for a calculated sell limit strategy targeting both intraday and swing potential.
⚙️ Risk Management:
• Entry is active only upon touching 0.65248
• Max risk: 1–2% of total account balance
• Consider partial profit-taking starting at TP2
#audusd #sell

AUDUSDDOLLAR INDEX on a dramatic twist of reversal on friday june 13th 00;00 time asian session at demand floor 97.621.
dollar reclaims 98.360 by londom session putting pressures on EURUSD,AUDUSD ,USDJPY,GBPUSD ,NZDUSD.
3:00pm
USD
Prelim UoM Consumer Sentiment
53.5 52.2
USD
Prelim UoM Inflation Expectations
6.6%
The University of Michigan (UoM) Consumer Sentiment and Inflation Expectations data will influence the US Dollar Index (DXY) and Federal Reserve policy expectations based on whether the prints exceed or miss forecasts.
Scenario 1: Better-Than-Expected Data
Consumer Sentiment greater than 53.5 and Inflation Expectations > 6.6%:
DXY Reaction: Likely to rise as stronger sentiment and sticky inflation expectations reduce odds of near-term Fed rate cuts. Traders may price out dovish bets, supporting the dollar.
Fed Implications: Elevated inflation expectations (above 6.6%) would reinforce the Fed’s cautious stance, delaying rate cuts until late 2025 or 2026.
Key Levels: DXY could retest 99.206 –99.00 resistance.
Scenario 2: Worse-Than-Expected Data
Consumer Sentiment less than 53.5 and Inflation Expectations < 6.6%:
DXY Reaction: Likely to decline as softer sentiment and easing inflation fears boost bets on Fed rate cuts. Markets could price in a September cut more aggressively.
Fed Implications: Lower inflation expectations (e.g., 6.0–6.5%) would align with recent CPI/PPI cooling, giving the Fed confidence to ease policy sooner.
Key Levels: DXY may drop toward 97.954
Scenario 3: Mixed Data
Sentiment beats, inflation misses (or vice versa):
DXY Reaction: Range-bound or choppy. For example, higher sentiment but lower inflation could offset, keeping DXY in a range bound
Fed Implications: The Fed would emphasize the inflation component over sentiment, as price expectations directly influence policy.
Contextual Factors
Recent Trends: May’s UoM sentiment hit a 2025 low (50.8), while 1-year inflation expectations spiked to 7.3% (later revised to 6.6%). June’s data will test whether inflation fears are easing.
Fed’s Focus: The Fed views inflation expectations as critical to actual inflation trends. A sustained rise above 6% could delay cuts despite softer CPI/PPI.
Broader Risks: Trade tensions (Trump’s tariffs) and political pressure on the Fed add volatility to dollar dynamics.
Conclusion
The dollar’s reaction hinges most critically on inflation expectations. A print above 6.6% would signal lingering price pressures, bolstering the Fed’s hawkish resolve and supporting DXY. Conversely, a drop below 6.0% could accelerate dollar selling as markets bet on earlier easing. Traders should also watch for revisions to May’s inflation expectations (previously revised down from 7.3% to 6.6%), which could amplify volatility.
#audusd

AUDUSD LONG FORECAST Q2 W25 D16 Y25AUDUSD LONG FORECAST Q2 W25 D16 Y25
Professional Risk Managers👋
Welcome back to another FRGNT chart update📈
Diving into some Forex setups using predominantly higher time frame order blocks alongside intraday confirmation & breaks of structure.
Let’s see what price action is telling us today! 🔥
💡Here are some trade confluences📝
✅4H Order block identified
✅1H Order block identified
✅15’ order block
✅Intraday bullish breaks of structure
🔑 Remember, to participate in trading comes always with a degree of risk, therefore as professional risk managers it remains vital that we stick to our risk management plan as well as our trading strategies.
📈The rest, we leave to the balance of probabilities.
💡Fail to plan. Plan to fail.
🏆It has always been that simple.
❤️Good luck with your trading journey, I shall see you at the very top.
🎯Trade consistent, FRGNT X


AUD/USD BULLISH BIAS RIGHT NOW| LONG
Hello, Friends!
AUD/USD pair is in the downtrend because previous week’s candle is red, while the price is clearly falling on the 15m timeframe. And after the retest of the support line below I believe we will see a move up towards the target above at 0.651 because the pair oversold due to its proximity to the lower BB band and a bullish correction is likely.
Disclosure: I am part of Trade Nation's Influencer program and receive a monthly fee for using their TradingView charts in my analysis.
✅LIKE AND COMMENT MY IDEAS✅
