AUDUSD Analysis – Falling from the Rising WedgeAUDUSD pair broke below an ascending wedge, a bearish reversal pattern.
Clean rejection from 0.6518, with lower highs and new lower lows confirming bearish momentum.
Price is now sitting below former trendline support, retested and respected as resistance.
Bearish target points toward 0.6400–0.6380 zone, aligning with recent swing lows.
Risk invalidation sits above 0.6520, where structure fails.
Technical Bias: Bearish
Target: 0.6400
Stop-loss zone: Above 0.6520
📊 Current Bias: Bearish
🔍 Key Fundamentals Driving AUDUSD
AUD Fundamentals (Weakening):
Australian jobs data was mixed, and wage growth has plateaued.
RBA remains cautious, with expectations for rate cuts later in 2025.
AUD pressured by China growth risks and weak commodity demand.
Geopolitical drag: Australia-China tensions and weak Chinese retail data from 618 Festival dampen AUD outlook.
USD Fundamentals (Resilient):
USD remains bid on risk-off flows, especially after weak global data and ongoing Middle East tensions.
Fed remains reluctant to cut fast despite disinflation signs – supports the USD.
US data is mixed, but rate cut odds are declining (only one expected in 2025 now per dot plot).
⚠️ Risks to This Bearish View
If China announces new stimulus, AUD could rebound sharply.
A dovish surprise from the Fed (e.g. Powell softening in speeches).
Sharp rebound in risk appetite (e.g. tech-led equity rally).
🗓️ Important Events to Watch
🇨🇳 China industrial profits & PMIs
🇦🇺 RBA Meeting Minutes (July preview hints)
🇺🇸 US Core PCE (June 28)
Global risk tone: watch metals, equities, and geopolitical headlines.
🚀 Which Asset Leads?
AUDUSD is lagging other USD pairs, but will likely lead commodity FX downside if China or metals weaken further.
Watch AUDJPY and EURAUD for further confirmation of risk-off flows and Aussie weakness.
AUDUSD trade ideas

Major resistance ahead?The Aussie (AUD/USD) is rising towards the pivot which has been identified as an overlap resistance and could reverse to the 1st support.
Pivot: 0.6512
1st Support: 0.6466
1st Resistance: 0.6545
Risk Warning:
Trading Forex and CFDs carries a high level of risk to your capital and you should only trade with money you can afford to lose. Trading Forex and CFDs may not be suitable for all investors, so please ensure that you fully understand the risks involved and seek independent advice if necessary.
Disclaimer:
The above opinions given constitute general market commentary, and do not constitute the opinion or advice of IC Markets or any form of personal or investment advice.
Any opinions, news, research, analyses, prices, other information, or links to third-party sites contained on this website are provided on an "as-is" basis, are intended only to be informative, is not an advice nor a recommendation, nor research, or a record of our trading prices, or an offer of, or solicitation for a transaction in any financial instrument and thus should not be treated as such. The information provided does not involve any specific investment objectives, financial situation and needs of any specific person who may receive it. Please be aware, that past performance is not a reliable indicator of future performance and/or results. Past Performance or Forward-looking scenarios based upon the reasonable beliefs of the third-party provider are not a guarantee of future performance. Actual results may differ materially from those anticipated in forward-looking or past performance statements. IC Markets makes no representation or warranty and assumes no liability as to the accuracy or completeness of the information provided, nor any loss arising from any investment based on a recommendation, forecast or any information supplied by any third-party.

AUDUSD BUY OPPORTUNITY Am waiting for a retest for me to take a buy on AUDUSD
ENTRY: 0.63400
SL: 0.63850
TP: 0.64560
Comment your opinion pls 🙏
For Fund Management. Contact me on X @shajudeakinoba1

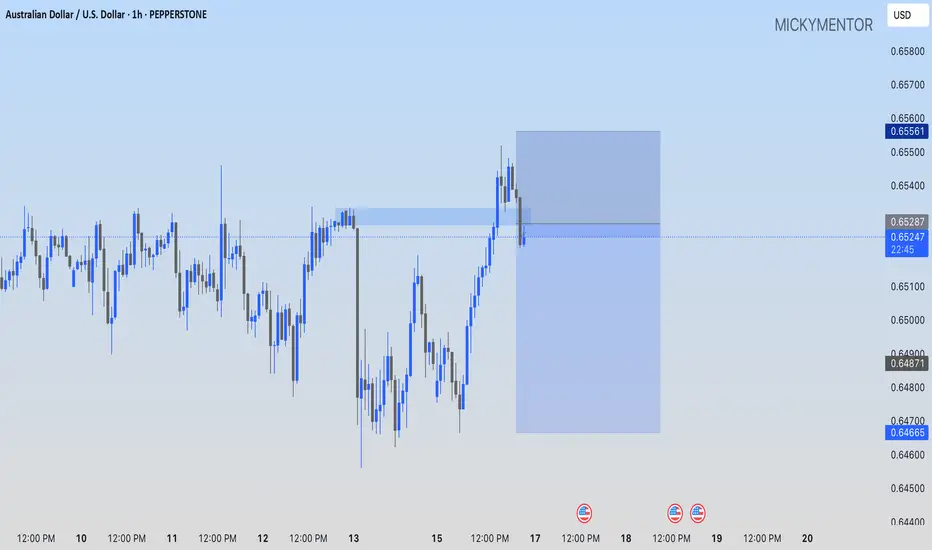
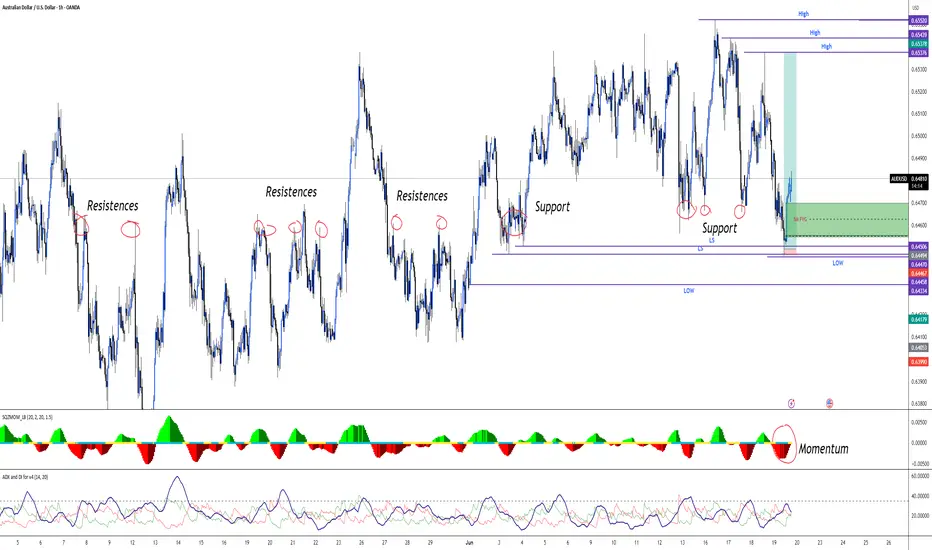
Institutional Manipulation or Perfect Setup? | AUDUSD🎯 This is a 🔥 setup no one’s talking about...
AUDUSD is quietly setting up for something big, and if we apply the VEP Trader – Liquidity Option Strategy, it could deliver a clean high-probability entry.
📍 Trend Overview (1D)
On the daily timeframe, AUDUSD shows a weak bullish trend, but here's what stands out...
The candle on June 18 swept liquidity from 5 previous days:
📅 June 3
📅 June 4
📅 June 13
📅 June 17
📅 June 18
This is a textbook case of institutional liquidity grab. 😮
💧 What Does VEP Trader Tell Us?
When price clears multiple daily lows/highs in a single candle, our strategy flags it as a potential reversal zone.
📸 If you switch to the 1-hour timeframe, you’ll notice something massive:
A huge institutional gap from 0.64554 to 0.64700, exactly where price left behind liquidity.
🚨 What Are We Watching For?
We’re looking for a potential pullback into that gap, alongside:
A bullish divergence on momentum
Support zones holding from previous reactions
Confirmation via Squeeze Momentum
If these align... the opportunity is 🔥.
🎯 Do You See What I See?
👉 Was this manipulation, or just clean price action?
Drop your thoughts in the comments.
Setups like this don’t show up every day — but when they do, you better be ready.
#AUDUSD
#VEPTrader
#LiquiditySweep
#FairValueGap
#SmartMoneyConcepts
#ForexSetup
#PriceActionTrading
#InstitutionalTrading
#CleanStructure
#ForexWatchlist
#GapTrading
#TradingBreakdown
#MomentumDivergence
#RiskRewardRatio
#TradeWhatYouSee
#LiquidityZones
#ForexReversal
#SqueezeMomentum
#TechnicalAnalysis
#ForexOpportunities
#ReversalTrade
#ScalpingSetup
#DayTradingForex
#ForexStrategy
#ForexTraderLife
AU-longas of now structure has broken to the upside and given us a equal high. we should wait for more data before we enter for a buy .

Audusd setup Here's a bullish analysis on AUD/USD (generic and adaptable to most timeframes; if you want it based on a specific chart or timeframe, let me know):
---
📈 AUD/USD Bullish Analysis
1. Support Zone Holding Strong:
AUD/USD has established a firm support level around where price has bounced multiple times.
Recent price action shows a double bottom or rounded base formation, indicating demand buildup.
2. Bullish Trendline Formation:
A new higher low structure is forming, suggesting a shift in momentum.
Price is respecting a short-term ascending trendline, signaling continued buying interest.
3. Breakout Confirmation:
A bullish breakout above the 0.6650 resistance opens room for an upward move.
Next target levels: 0.6700 and 0.6780.
4. RSI & Momentum Indicators:
RSI trending above 50, showing strength.
Bullish divergence on momentum indicators confirms possible upside continuation.
5. Fundamentals (Optional Context):
AUD supported by improving risk sentiment and commodity strength (especially iron ore and gold).
USD weakening slightly due to lower rate hike expectations from the Fed.
---
🎯 Bullish Targets:
Entry zone: 0.6620–0.6640
Target 1: 0.6700
Target 2: 0.6780
Stop-loss: Below support

AUDUSD TRADE SETUPWait for retest the entry level and bearish momentum then take a trade for Sell othewise skip this setup

AUDUSD(20250617)Today's AnalysisMarket news:
Revised version of the Republican tax cut bill in the US Senate: It is planned to raise the debt ceiling to 5 trillion, and the overall framework is consistent with the House version.
Technical analysis:
Today's buying and selling boundaries:
0.6512
Support and resistance levels:
0.6597
0.6566
0.6545
0.6480
0.6459
0.6428
Trading strategy:
If the price breaks through 0.6545, consider buying, and the first target price is 0.6566
If the price breaks through 0.6512, consider selling, and the first target price is 0.6480

CHECK AUDUSD SIGNAL READ CAPTAINaudusd sell now ✅
entry point (0.65430) (0.65400)
TAKE PROFIT 1: (0.65320)
TAKE PROFIT 2: (0.65200)
LAST TARGET (0.65060)
STOP LOSS (0.65550)

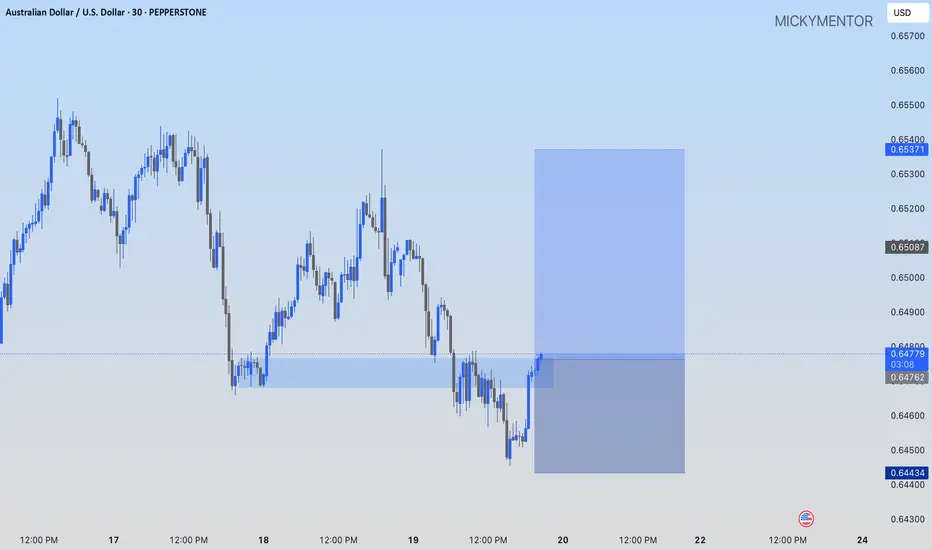
AUDUSD: AN OPPORTUNITY TO GO LONGPEPPERSTONE:AUDUSD I'm buying at the current market price to the 0.65371 price level
AUDUSD Potential UpsidesHey Traders, in today's trading session we are monitoring AUDUSD for a buying opportunity around 0.64600 zone, AUDUSD is trading in an uptrend and currently is in a correction phase in which it is approaching the trend at 0.64600 support and resistance area.
Trade safe, Joe.

AUDUSD Potential UpsidesHey Traders, in today's trading session we are monitoring AUDUSD for a buying opportunity around 0.63800 zone, AUDUSD is trading in an uptrend and currently is in a correction phase in which it is approaching the trend at 0.63800 support and resistance area.
Trade safe, Joe.

Could the Aussie bounce from here?The price is falling towards the pivot and could bounce to the 1st resistance.
Pivot: 0.6410
1st Support: 0.6344
1st Resistance: 0.6539
Risk Warning:
Trading Forex and CFDs carries a high level of risk to your capital and you should only trade with money you can afford to lose. Trading Forex and CFDs may not be suitable for all investors, so please ensure that you fully understand the risks involved and seek independent advice if necessary.
Disclaimer:
The above opinions given constitute general market commentary, and do not constitute the opinion or advice of IC Markets or any form of personal or investment advice.
Any opinions, news, research, analyses, prices, other information, or links to third-party sites contained on this website are provided on an "as-is" basis, are intended only to be informative, is not an advice nor a recommendation, nor research, or a record of our trading prices, or an offer of, or solicitation for a transaction in any financial instrument and thus should not be treated as such. The information provided does not involve any specific investment objectives, financial situation and needs of any specific person who may receive it. Please be aware, that past performance is not a reliable indicator of future performance and/or results. Past Performance or Forward-looking scenarios based upon the reasonable beliefs of the third-party provider are not a guarantee of future performance. Actual results may differ materially from those anticipated in forward-looking or past performance statements. IC Markets makes no representation or warranty and assumes no liability as to the accuracy or completeness of the information provided, nor any loss arising from any investment based on a recommendation, forecast or any information supplied by any third-party.

AUDUSD I Monthly CLS I Model 1 I TR - LiquidityHey, Market Warriors, here is another outlook on this instrument
If you’ve been following me, you already know every setup you see is built around a CLS Footprint, a Key Level, Liquidity and a specific execution model.
If you haven't followed me yet, start now.
My trading system is completely mechanical — designed to remove emotions, opinions, and impulsive decisions. No messy diagonal lines. No random drawings. Just clarity, structure, and execution.
🧩 What is CLS?
CLS is real smart money — the combined power of major investment banks and central banks moving over 6.5 trillion dollars a day. Understanding their operations is key to markets.
✅ Understanding the behavior of CLS allows you to position yourself with the giants during the market manipulations — leading to buying lows and selling highs - cleaner entries, clearer exits, and consistent profits.
📍 Model 1
is right after the manipulation of the CLS candle when CIOD occurs, and we are targeting 50% of the CLS range. H4 CLS ranges supported by HTF go straight to the opposing range.
"Adapt what is useful, reject what is useless, and add what is specifically your own."
— David Perk aka Dave FX Hunter ⚔️
👍 Hit like if you find this analysis helpful, and don't hesitate to comment with your opinions, charts or any questions.

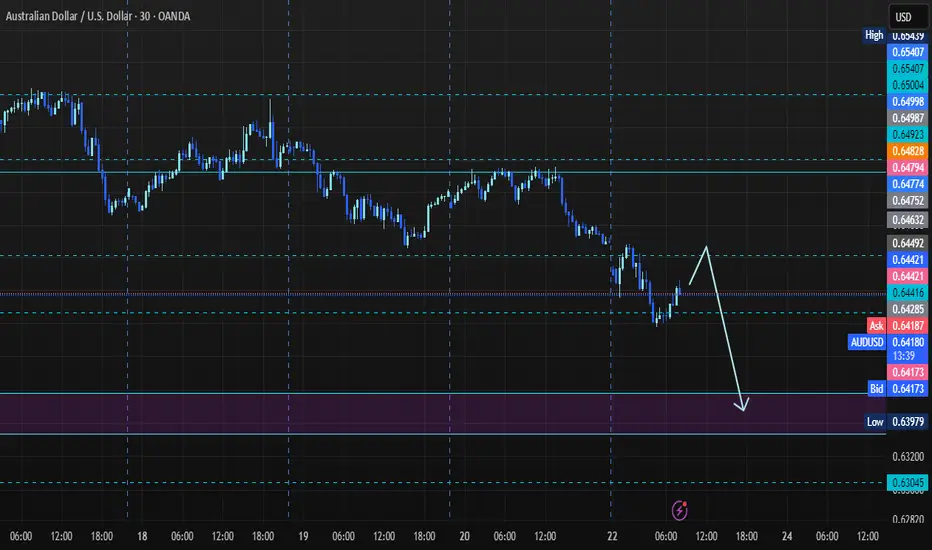
Potential bearish breakout?AUD/USD is falling towards a support level, which acts as a pullback support. A breakout below this level could lead the price to drop further towards our take-profit target
Entry: 0.6533
Why we like it:
There is a pullback support level.
Stop loss: 0.6560
Why we like it:
There is a resistance level at the 138.2% Fibonacci extension.
Take profit: 0.6492
Why we like it:
There is a pullback support level that aligns with the 71% Fibonacci retracement.
Enjoying your TradingView experience? Review us!
Please be advised that the information presented on TradingView is provided to Vantage (‘Vantage Global Limited’, ‘we’) by a third-party provider (‘Everest Fortune Group’). Please be reminded that you are solely responsible for the trading decisions on your account. There is a very high degree of risk involved in trading. Any information and/or content is intended entirely for research, educational and informational purposes only and does not constitute investment or consultation advice or investment strategy. The information is not tailored to the investment needs of any specific person and therefore does not involve a consideration of any of the investment objectives, financial situation or needs of any viewer that may receive it. Kindly also note that past performance is not a reliable indicator of future results. Actual results may differ materially from those anticipated in forward-looking or past performance statements. We assume no liability as to the accuracy or completeness of any of the information and/or content provided herein and the Company cannot be held responsible for any omission, mistake nor for any loss or damage including without limitation to any loss of profit which may arise from reliance on any information supplied by Everest Fortune Group.

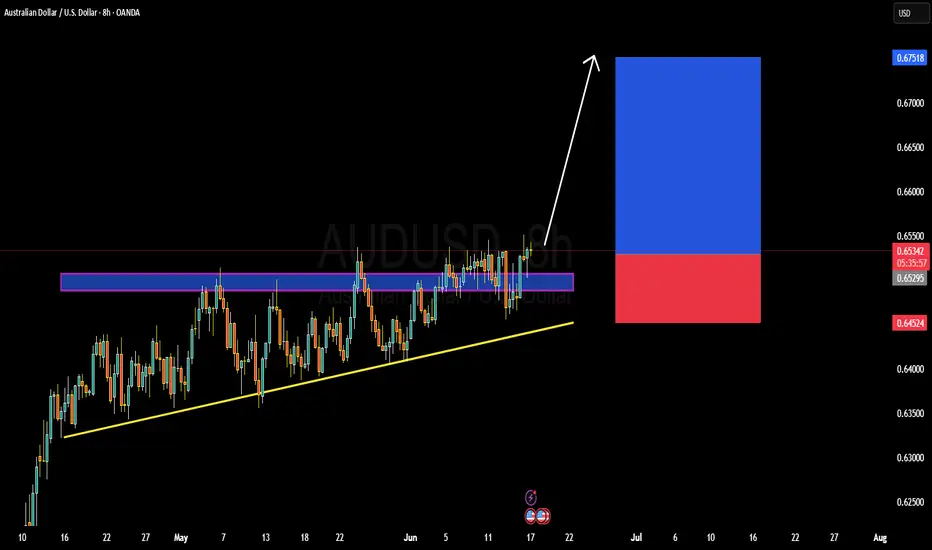
AUDUSD TECHNICALS AND FUNDAMENTALS DETAILED ANALYSISAUDUSD has officially broken out of a multi-week ascending triangle structure, and momentum is now building for a bullish continuation. The price is currently trading around 0.6533 after a strong breakout above the 0.6520 resistance zone. This consolidation was forming higher lows, signaling accumulation and bullish intent. The clean breakout above the horizontal resistance confirms buyers are in control. With this pattern validated, my short-term target is 0.6700–0.6750, aligning with the measured move projection.
From a macro perspective, AUD is gaining strength due to a divergence in monetary policy outlooks. The Reserve Bank of Australia remains hawkish, supported by sticky inflation data and a tight labor market, while the Federal Reserve has recently hinted at a dovish turn, acknowledging signs of economic slowdown. Additionally, a weaker U.S. dollar index (DXY) and rising commodity prices—especially iron ore and copper—are tailwinds for the Australian dollar. These fundamental shifts are reinforcing the bullish technical breakout.
On the 8H chart, the ascending triangle is a clear signal of bullish pressure. The zone around 0.6450–0.6520 acted as strong demand during the consolidation phase. A successful breakout retest of this zone could offer secondary entry opportunities. The risk-reward ratio is attractive, with a defined invalidation below the trendline and a target extending toward yearly highs near 0.6750.
This setup stands out as high-probability. With bullish price action, supportive fundamentals, and risk-on sentiment returning across FX majors, AUDUSD is primed for further upside. I’m holding long with conviction, expecting continuation toward the projected breakout target. This trade aligns with current market structure, trend strength, and macro drivers—perfect timing in a trending market environment.
Looking To Sell AUD/USD Into 4h Supply ZoneThe market structure on AUD/USD shifted bearish last week as it created successive lower lows ah lower highs, from the 4H timeframe, we see price headed towards an area of supply.
PLAN
1. Wait for retest of Friday's lower high with candlestick confirmation to short into supply
Bearish drop?The Aussie (AUD/USD) is rising towards the pivot and could drop to the pullback support.
Pivot: 0.6497
1st Support: 0.6466
1st Resistance: 0.6510
Risk Warning:
Trading Forex and CFDs carries a high level of risk to your capital and you should only trade with money you can afford to lose. Trading Forex and CFDs may not be suitable for all investors, so please ensure that you fully understand the risks involved and seek independent advice if necessary.
Disclaimer:
The above opinions given constitute general market commentary, and do not constitute the opinion or advice of IC Markets or any form of personal or investment advice.
Any opinions, news, research, analyses, prices, other information, or links to third-party sites contained on this website are provided on an "as-is" basis, are intended only to be informative, is not an advice nor a recommendation, nor research, or a record of our trading prices, or an offer of, or solicitation for a transaction in any financial instrument and thus should not be treated as such. The information provided does not involve any specific investment objectives, financial situation and needs of any specific person who may receive it. Please be aware, that past performance is not a reliable indicator of future performance and/or results. Past Performance or Forward-looking scenarios based upon the reasonable beliefs of the third-party provider are not a guarantee of future performance. Actual results may differ materially from those anticipated in forward-looking or past performance statements. IC Markets makes no representation or warranty and assumes no liability as to the accuracy or completeness of the information provided, nor any loss arising from any investment based on a recommendation, forecast or any information supplied by any third-party.

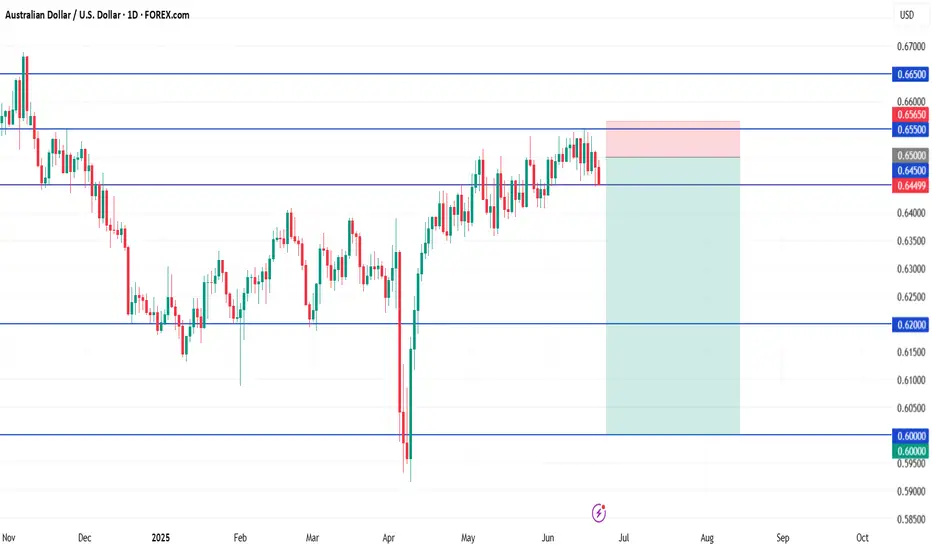
AUD/USD ShortStandard / Aggressive Entry
Sell Limit: 0.6500
Stop Loss: 0.6565
TP1: 0.6200
TP2: 0.6000
Why: Likely to trigger sooner, even on light retracement or spread spike.
🛡️ Conservative Entry
Sell Limit: 0.6520
Stop Loss: 0.6580
TP1: 0.6200
TP2: 0.6000
Why: Waits for a deeper, cleaner pullback toward top of resistance zone. Safer but may not trigger.
Could the Aussie bounce from here?The price is falling towards the support level which is an overlap support that is slightly below the 61.8% Fibonacci retracement and could reverse from this level to our take profit.
Entry: 0.6455
Why we like it:
There is an overlap support that is slightly below the 61.8% Fibonacci retracement.
Stop loss: 0.6407
Why we like it:
There is a pullback support that aligns with the 145% Fibonacci extension.
Take profit: 0.6513
Why we like it:
There is an overlap resistance.
Enjoying your TradingView experience? Review us!
Please be advised that the information presented on TradingView is provided to Vantage (‘Vantage Global Limited’, ‘we’) by a third-party provider (‘Everest Fortune Group’). Please be reminded that you are solely responsible for the trading decisions on your account. There is a very high degree of risk involved in trading. Any information and/or content is intended entirely for research, educational and informational purposes only and does not constitute investment or consultation advice or investment strategy. The information is not tailored to the investment needs of any specific person and therefore does not involve a consideration of any of the investment objectives, financial situation or needs of any viewer that may receive it. Kindly also note that past performance is not a reliable indicator of future results. Actual results may differ materially from those anticipated in forward-looking or past performance statements. We assume no liability as to the accuracy or completeness of any of the information and/or content provided herein and the Company cannot be held responsible for any omission, mistake nor for any loss or damage including without limitation to any loss of profit which may arise from reliance on any information supplied by Everest Fortune Group.

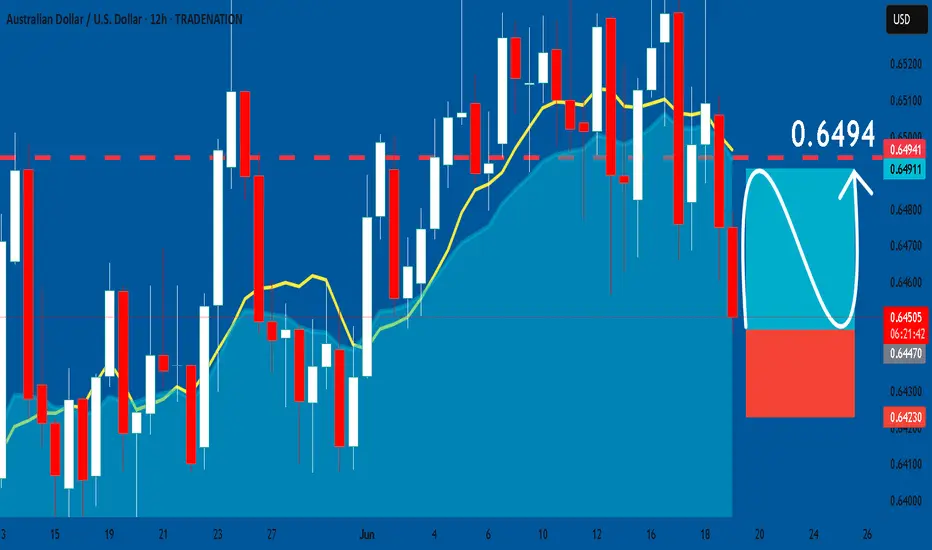
AUDUSD: Long Trade with Entry/SL/TP
AUDUSD
- Classic bullish pattern
- Our team expects retracement
SUGGESTED TRADE:
Swing Trade
Buy AUDUSD
Entry - 0.6447
Stop - 0.6423
Take - 0.6494
Our Risk - 1%
Start protection of your profits from lower levels
Disclosure: I am part of Trade Nation's Influencer program and receive a monthly fee for using their TradingView charts in my analysis.
❤️ Please, support our work with like & comment! ❤️
Potential bearish drop?AUD/USD has reacted off the resistance level which is a pullback resistance and could drop from this level to our take profit.
Entry: 0.6498
Why we like it:
There is a pullback resistance level.
Stop loss: 0.6519
Why we like it:
There is a pullback resistance level.
Take profit: 0.6468
Why we like it:
There is a pullback support that is slightly above the 61.8% Fibonacci projection.
Enjoying your TradingView experience? Review us!
Please be advised that the information presented on TradingView is provided to Vantage (‘Vantage Global Limited’, ‘we’) by a third-party provider (‘Everest Fortune Group’). Please be reminded that you are solely responsible for the trading decisions on your account. There is a very high degree of risk involved in trading. Any information and/or content is intended entirely for research, educational and informational purposes only and does not constitute investment or consultation advice or investment strategy. The information is not tailored to the investment needs of any specific person and therefore does not involve a consideration of any of the investment objectives, financial situation or needs of any viewer that may receive it. Kindly also note that past performance is not a reliable indicator of future results. Actual results may differ materially from those anticipated in forward-looking or past performance statements. We assume no liability as to the accuracy or completeness of any of the information and/or content provided herein and the Company cannot be held responsible for any omission, mistake nor for any loss or damage including without limitation to any loss of profit which may arise from reliance on any information supplied by Everest Fortune Group.
