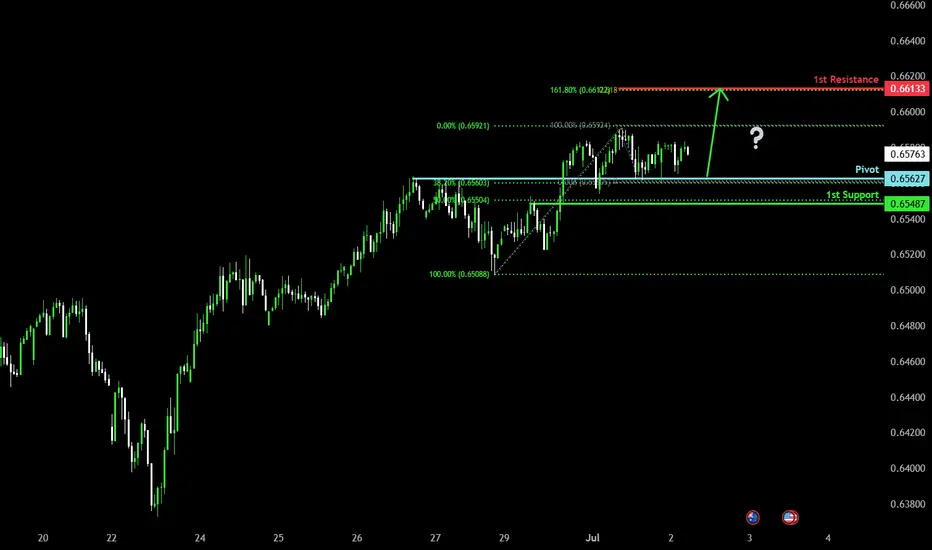
Bullish bounce?The Aussie (AUD/USD) is falling towards the pivot and could bounce to the 1st resistance that aligns with the 161.8% Fibonacci extension and the 61.8% Fibonacci projection.
Pivot: 0.6562
1st Support: 0.6548
1st Resistance: 0.6613
Risk Warning:
Trading Forex and CFDs carries a high level of risk to your capital and you should only trade with money you can afford to lose. Trading Forex and CFDs may not be suitable for all investors, so please ensure that you fully understand the risks involved and seek independent advice if necessary.
Disclaimer:
The above opinions given constitute general market commentary, and do not constitute the opinion or advice of IC Markets or any form of personal or investment advice.
Any opinions, news, research, analyses, prices, other information, or links to third-party sites contained on this website are provided on an "as-is" basis, are intended only to be informative, is not an advice nor a recommendation, nor research, or a record of our trading prices, or an offer of, or solicitation for a transaction in any financial instrument and thus should not be treated as such. The information provided does not involve any specific investment objectives, financial situation and needs of any specific person who may receive it. Please be aware, that past performance is not a reliable indicator of future performance and/or results. Past Performance or Forward-looking scenarios based upon the reasonable beliefs of the third-party provider are not a guarantee of future performance. Actual results may differ materially from those anticipated in forward-looking or past performance statements. IC Markets makes no representation or warranty and assumes no liability as to the accuracy or completeness of the information provided, nor any loss arising from any investment based on a recommendation, forecast or any information supplied by any third-party.
AUDUSD trade ideas
AUDUSD InsightHello to all our subscribers,
Please feel free to share your personal opinions in the comments. Don't forget to like and subscribe.
Key Points
- According to the U.S. Department of Labor’s Job Openings and Labor Turnover Survey (JOLTS), job openings in May increased by 374,000 from the previous month to 7.769 million, significantly exceeding market expectations of 7.3 million.
- U.S. President Trump has indicated that he has no intention of further extending the reciprocal tariff exemption set to expire on the 9th, warning that tariffs of 30% to 35% could be imposed on Japan.
- Trump's tax cut proposal has dramatically passed the Senate and is now awaiting passage in the House. President Trump aims to sign the bill into law before July 4th.
- Australia's May CPI rose 2.1% year-on-year, falling short of market expectations. Some analysts now expect the Reserve Bank of Australia (RBA) to cut interest rates in July.
Key Economic Events This Week
+ July 2: U.S. June ADP Non-Farm Employment Change
+ July 3: U.S. June Non-Farm Payrolls, U.S. June Unemployment Rate
AUDUSD Chart Analysis
The pair has been steadily rising and recently reached the 0.66000 level. In the longer term, a rise toward the 0.69000 level seems likely. However, expectations of a rate cut by the Reserve Bank of Australia have introduced new uncertainty. There is also minor resistance near the 0.67000 level, which could lead to a potential reversal if market conditions align. While maintaining a bullish outlook, we will closely monitor the price action around the 0.67000 level.

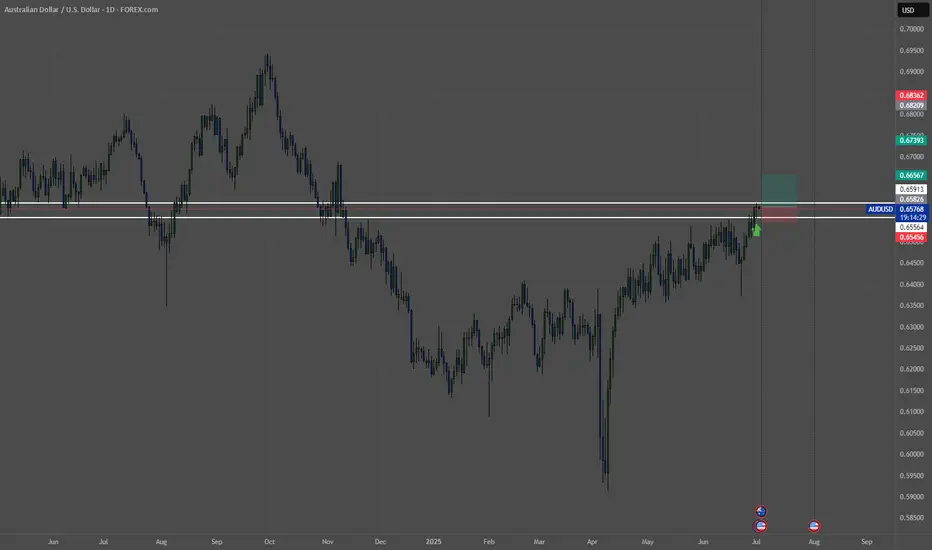
AUDUSD - Daily - LongDirection: Up-trending
Levels: Bouncing off 0.656
Price action: Pinbar off the level.
AUDUSD Buyers In Panic! SELL!
My dear subscribers,
AUDUSD looks like it will make a good move, and here are the details:
The market is trading on 0.6571 pivot level.
Bias - Bearish
My Stop Loss - 0.6603
Technical Indicators: Both Super Trend & Pivot HL indicate a highly probable Bearish continuation.
Target - 0.6511
About Used Indicators:
The average true range (ATR) plays an important role in 'Supertrend' as the indicator uses ATR to calculate its value. The ATR indicator signals the degree of price volatility.
Disclosure: I am part of Trade Nation's Influencer program and receive a monthly fee for using their TradingView charts in my analysis.
———————————
WISH YOU ALL LUCK


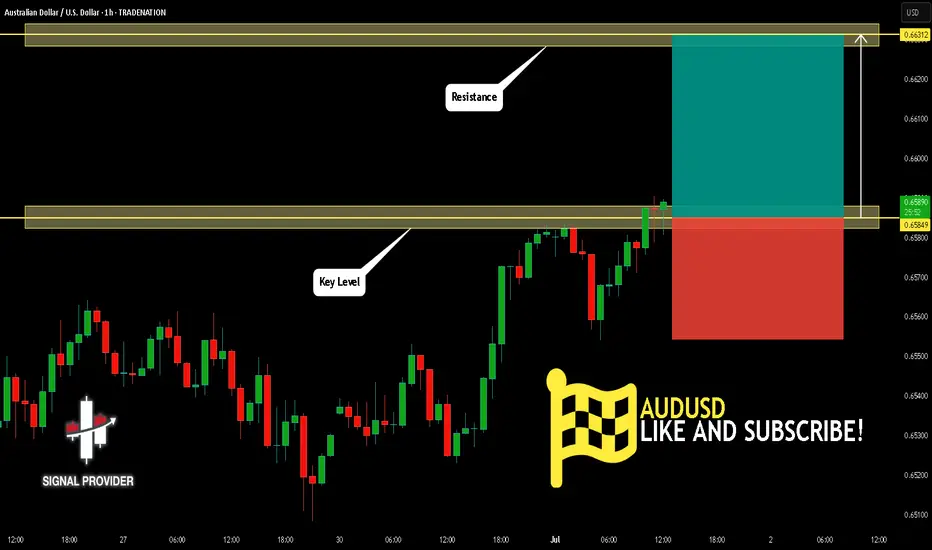
AUDUSD Is Bullish! Buy!
Here is our detailed technical review for AUDUSD.
Time Frame: 1h
Current Trend: Bullish
Sentiment: Oversold (based on 7-period RSI)
Forecast: Bullish
The market is trading around a solid horizontal structure 0.658.
The above observations make me that the market will inevitably achieve 0.663 level.
P.S
We determine oversold/overbought condition with RSI indicator.
When it drops below 30 - the market is considered to be oversold.
When it bounces above 70 - the market is considered to be overbought.
Disclosure: I am part of Trade Nation's Influencer program and receive a monthly fee for using their TradingView charts in my analysis.
Like and subscribe and comment my ideas if you enjoy them!
AUDUSD: Bullish Continuation After Breakout 🇦🇺🇺🇸
AUDUSD is going to rise more following a bullish breakout
of a key daily/intraday horizontal resistance.
Next goal - 0.66
❤️Please, support my work with like, thank you!❤️
I am part of Trade Nation's Influencer program and receive a monthly fee for using their TradingView charts in my analysis.

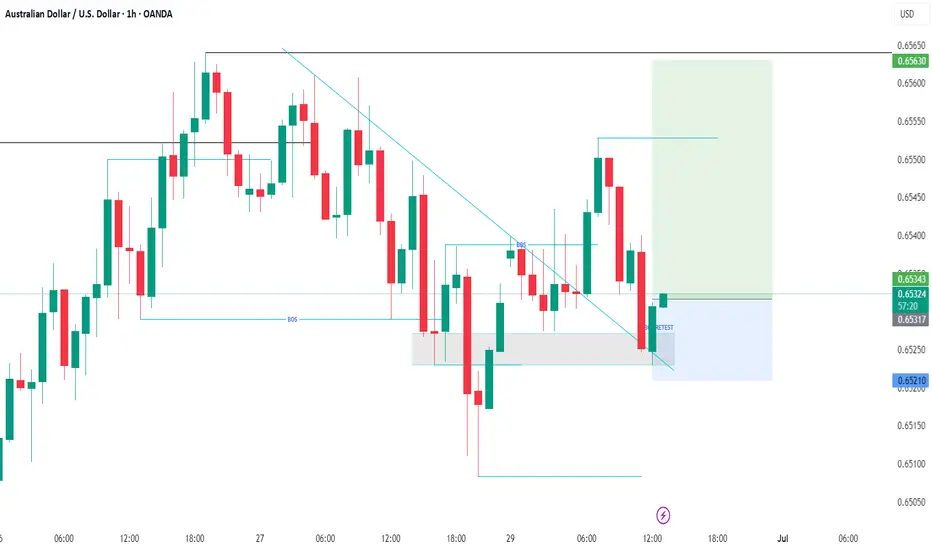
I love a fresh daily structure break, here's why.......All the information you need to find a high probability trade are in front of you on the charts so build your trading decisions on 'the facts' of the chart NOT what you think or what you want to happen or even what you heard will happen. If you have enough facts telling you to trade in a certain direction and therefore enough confluence to take a trade, then this is how you will gain consistency in you trading and build confidence. Check out my trade idea!!
www.tradingview.com

AUD/USD ShortStandard / Aggressive Entry
Sell Limit: 0.6500
Stop Loss: 0.6565
TP1: 0.6200
TP2: 0.6000
Why: Likely to trigger sooner, even on light retracement or spread spike.
🛡️ Conservative Entry
Sell Limit: 0.6520
Stop Loss: 0.6580
TP1: 0.6200
TP2: 0.6000
Why: Waits for a deeper, cleaner pullback toward top of resistance zone. Safer but may not trigger.
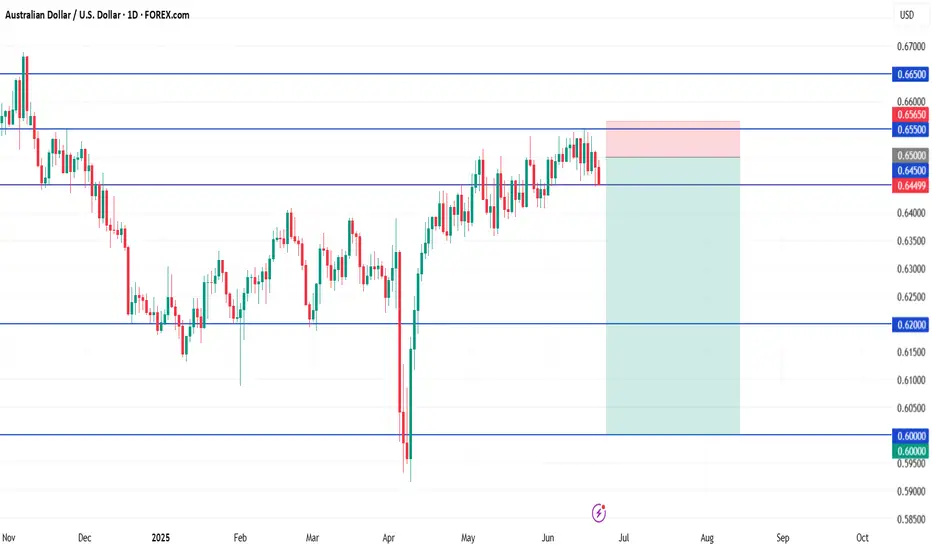
Ok we are short Price closed under support so we will wait for pullback to the green lines above 76 fib level and sell back down to the next support level which the 200 fib level orange lines on the bottom However 🤔 if price breaks above resistance the greennlines and closes above wait for pullback and buy it back-up to the next level of resistance
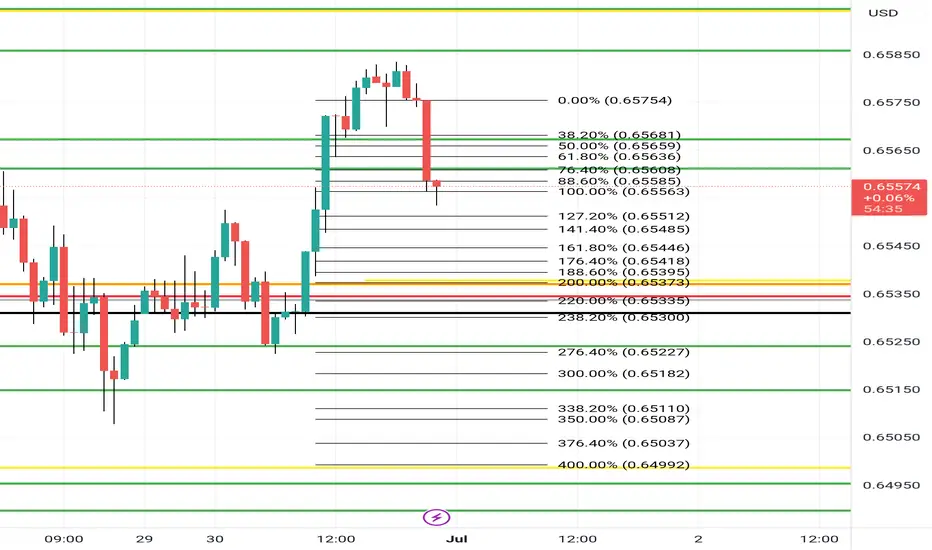
Long Buy now ifIf price doesn't close under the green lines.. and take profits at next level of resistance 188 fib level
However if price 🤔 closes under the green lines wait for pullback and sell back to the next level of support green lines underneath
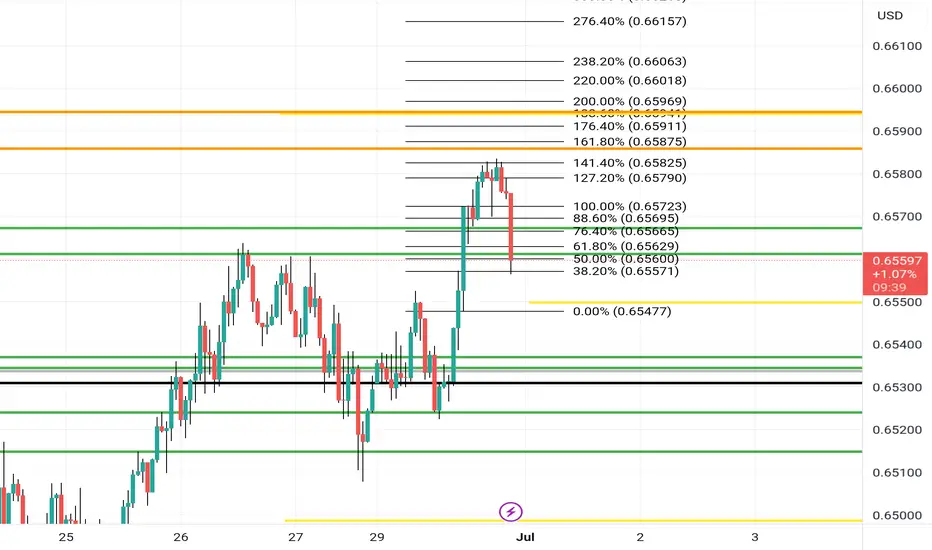
AUDUSD BULLISHTechnically:
AUDUSD is in bullish trend it took resistance at 0.65463 but now finally it break and trade above on now we have to wait for retest the same resistance which will become support.

AUD/USD Approaches Key Resistance with Bullish Momentum IntactAUD/USD has extended its steady climb and is now challenging the 61.8% Fibonacci retracement level (0.6558) from the July–October 2023 decline. The pair is trading within a rising channel structure and has cleared both the 50-day (0.6457) and 200-day (0.6422) SMAs, confirming a medium-term bullish shift.
Price action remains constructive, with higher lows and rising support from the channel base suggesting consistent demand. A sustained break above the 0.6558 level could open the door toward the 78.6% Fib retracement at 0.6730, a level that also aligns with prior resistance from September 2023.
Momentum indicators support the advance. The RSI is at 61.77 and rising, but still comfortably below overbought levels, implying room for further upside. The MACD is marginally positive and could accelerate higher if price confirms a breakout above the 61.8% Fib barrier.
Traders will be watching whether the pair can hold above the confluence of the SMAs and the lower trendline of the channel. A failure here could expose downside toward 0.6420–0.6450. Otherwise, the bullish structure remains intact, with scope for a continuation higher into July.
-MW

Could the Aussie reverse from here?The price is rising towards the pivot and could drop to the 1st support.
Pivot: 0.6598
1st Support: 0.6548
1st Resistance: 0.6628
Risk Warning:
Trading Forex and CFDs carries a high level of risk to your capital and you should only trade with money you can afford to lose. Trading Forex and CFDs may not be suitable for all investors, so please ensure that you fully understand the risks involved and seek independent advice if necessary.
Disclaimer:
The above opinions given constitute general market commentary, and do not constitute the opinion or advice of IC Markets or any form of personal or investment advice.
Any opinions, news, research, analyses, prices, other information, or links to third-party sites contained on this website are provided on an "as-is" basis, are intended only to be informative, is not an advice nor a recommendation, nor research, or a record of our trading prices, or an offer of, or solicitation for a transaction in any financial instrument and thus should not be treated as such. The information provided does not involve any specific investment objectives, financial situation and needs of any specific person who may receive it. Please be aware, that past performance is not a reliable indicator of future performance and/or results. Past Performance or Forward-looking scenarios based upon the reasonable beliefs of the third-party provider are not a guarantee of future performance. Actual results may differ materially from those anticipated in forward-looking or past performance statements. IC Markets makes no representation or warranty and assumes no liability as to the accuracy or completeness of the information provided, nor any loss arising from any investment based on a recommendation, forecast or any information supplied by any third-party.

Bullish continuation for the Aussie?The price has bounced off the support level which is a pullback support and could potentially rise from this level to our take profit.
Entry: 0.5537
Why we like it:
There is a pullback support level.
Stop loss: 0.6490
Why we like it:
There is an overlap support level.
Take profit: 0.6623
Why we like it:
There is a resistance level at the 138.2% Fibonacci extension and the 61.8% Fibonacci projection.
Enjoying your TradingView experience? Review us!
Please be advised that the information presented on TradingView is provided to Vantage (‘Vantage Global Limited’, ‘we’) by a third-party provider (‘Everest Fortune Group’). Please be reminded that you are solely responsible for the trading decisions on your account. There is a very high degree of risk involved in trading. Any information and/or content is intended entirely for research, educational and informational purposes only and does not constitute investment or consultation advice or investment strategy. The information is not tailored to the investment needs of any specific person and therefore does not involve a consideration of any of the investment objectives, financial situation or needs of any viewer that may receive it. Kindly also note that past performance is not a reliable indicator of future results. Actual results may differ materially from those anticipated in forward-looking or past performance statements. We assume no liability as to the accuracy or completeness of any of the information and/or content provided herein and the Company cannot be held responsible for any omission, mistake nor for any loss or damage including without limitation to any loss of profit which may arise from reliance on any information supplied by Everest Fortune Group.

AUDUSDAUD/USD Exchange Rate
Current Level: 0.6530–0.6550
Slightly bearish near-term bias amid RBA rate cut expectations
Australia 10-Year Government Bond Yield
Current Yield: 4.15% (as of June 30, 2025)
Rose 0.01 percentage points from the previous session.
Reflects market reaction to RBA policy and global trade uncertainty.
Reserve Bank of Australia (RBA) Rate
Current Cash Rate: 3.85% (lowest in two years)
Cut by 25 bps in May 2025 to combat slowing growth and align with 2–3% inflation targets.
Markets price a 90% probability of another 25 bps cut in July 2025.
US Federal Reserve (Fed) Rate
Current Federal Funds Rate: 4.25–4.50%
Unchanged since December 2024; held steady at the June 18, 2025, meeting.
Fed signaled potential for two 25 bps cuts in late 2025 (September/December), contingent on inflation cooling.
Key Implications
Rate Differential:
RBA-Fed spread: –0.40% to –0.65% (AUD negative), pressuring AUD/USD.
Australia’s 10Y yield premium over US 10Y (~4.26%) is –0.11%, reducing AUD carry appeal.
AUD/USD Drivers:
RBA Easing: Expected July cut may weaken AUD further.
Fed Patience: Delayed cuts sustain USD strength.
Yield Sensitivity: Narrowing yield spreads limit AUD upside.
In summary:
AUD/USD trades near 0.6530–0.6550, pressured by RBA-Fed policy divergence and narrowing yield spreads. The RBA’s dovish path (3.85% rate, July cut expected) contrasts with the Fed’s hold at 4.25–4.50%, sustaining USD strength. Australia’s 10Y yield at 4.15% offers minimal premium over US Treasuries, limiting AUD support.
#AUDUSD

AUDUSD AUD/USD Exchange Rate
Current Level: 0.6530–0.6550
Slightly bearish near-term bias amid RBA rate cut expectations
Australia 10-Year Government Bond Yield
Current Yield: 4.15% (as of June 30, 2025)
Rose 0.01 percentage points from the previous session.
Reflects market reaction to RBA policy and global trade uncertainty.
Reserve Bank of Australia (RBA) Rate
Current Cash Rate: 3.85% (lowest in two years)
Cut by 25 bps in May 2025 to combat slowing growth and align with 2–3% inflation targets.
Markets price a 90% probability of another 25 bps cut in July 2025.
US Federal Reserve (Fed) Rate
Current Federal Funds Rate: 4.25–4.50%
Unchanged since December 2024; held steady at the June 18, 2025, meeting.
Fed signaled potential for two 25 bps cuts in late 2025 (September/December), contingent on inflation cooling.
Key Implications
Rate Differential:
RBA-Fed spread: –0.40% to –0.65% (AUD negative), pressuring AUD/USD.
Australia’s 10Y yield premium over US 10Y (~4.26%) is –0.11%, reducing AUD carry appeal.
AUD/USD Drivers:
RBA Easing: Expected July cut may weaken AUD further.
Fed Patience: Delayed cuts sustain USD strength.
Yield Sensitivity: Narrowing yield spreads limit AUD upside.
In summary:
AUD/USD trades near 0.6530–0.6550, pressured by RBA-Fed policy divergence and narrowing yield spreads. The RBA’s dovish path (3.85% rate, July cut expected) contrasts with the Fed’s hold at 4.25–4.50%, sustaining USD strength. Australia’s 10Y yield at 4.15% offers minimal premium over US Treasuries, limiting AUD support.

AUDUSD Bull Flag developing Trend Overview:
The AUDUSD currency price remains in a bullish trend, characterised by higher highs and higher lows. The recent intraday price action is forming a continuation consolidation pattern, suggesting a potential pause before a renewed move higher.
Key Technical Levels:
Support: 0.6465 (primary pivot), followed by 0.6445 and 0.6400
Resistance: 0.6570 (initial), then 0.6590 and 0.6625
Technical Outlook:
A pullback to the 0.6465 level, which aligns with the previous consolidation zone, could act as a platform for renewed buying interest. A confirmed bounce from this support may trigger a continuation toward the next resistance levels at 0.6570, 0.6590, and ultimately 0.6625.
Conversely, a daily close below 0.6465 would suggest weakening bullish momentum. This scenario would shift the bias to bearish in the short term, potentially targeting 0.6445 and 0.6400 as downside levels.
Conclusion:
AUDUSD maintains a bullish structure while trading above the 0.6465 support. A bounce from this level would validate the consolidation as a continuation pattern, with upside potential toward the 0.6570 area. A breakdown below 0.6465, however, would invalidate this view and suggest deeper corrective risk.
This communication is for informational purposes only and should not be viewed as any form of recommendation as to a particular course of action or as investment advice. It is not intended as an offer or solicitation for the purchase or sale of any financial instrument or as an official confirmation of any transaction. Opinions, estimates and assumptions expressed herein are made as of the date of this communication and are subject to change without notice. This communication has been prepared based upon information, including market prices, data and other information, believed to be reliable; however, Trade Nation does not warrant its completeness or accuracy. All market prices and market data contained in or attached to this communication are indicative and subject to change without notice.

AUDUSD BUY SETUPWe have transitioned from a downtrend to and up trend as shown by the transition for lower low and lower high to a higher high and potential higher low. we have pulled back to a key level for an entry.
AUDUSD SHORT DAILY FORECAST Q3 D30 W27 Y25AUDUSD SHORT DAILY FORECAST Q3 D30 W27 Y25
Professional Risk Managers👋
Welcome back to another FRGNT chart update📈
Diving into some Forex setups using predominantly higher time frame order blocks alongside confirmation breaks of structure.
Let’s see what price action is telling us today! 👀
💡Here are some trade confluences📝
✅Daily Order block identified
✅4H Order Block identified
✅1H Order Block identified
🔑 Remember, to participate in trading comes always with a degree of risk, therefore as professional risk managers it remains vital that we stick to our risk management plan as well as our trading strategies.
📈The rest, we leave to the balance of probabilities.
💡Fail to plan. Plan to fail.
🏆It has always been that simple.
❤️Good luck with your trading journey, I shall see you at the very top.
🎯Trade consistent, FRGNT X

AUDUSD WEEKLY HIGHER TIME FRAME FORECAST Q3 W27 Y25AUDUSD WEEKLY HIGHER TIME FRAME FORECAST Q3 W27 Y25
Professional Risk Managers👋
Welcome back to another FRGNT chart update📈
Diving into some Forex setups using predominantly higher time frame order blocks alongside confirmation breaks of structure.
Let’s see what price action is telling us today! 👀
💡Here are some trade confluences📝
✅Weekly 50EMA Rejection
✅Daily Order block identified
✅4H Order Block identified
🔑 Remember, to participate in trading comes always with a degree of risk, therefore as professional risk managers it remains vital that we stick to our risk management plan as well as our trading strategies.
📈The rest, we leave to the balance of probabilities.
💡Fail to plan. Plan to fail.
🏆It has always been that simple.
❤️Good luck with your trading journey, I shall see you at the very top.
🎯Trade consistent, FRGNT X

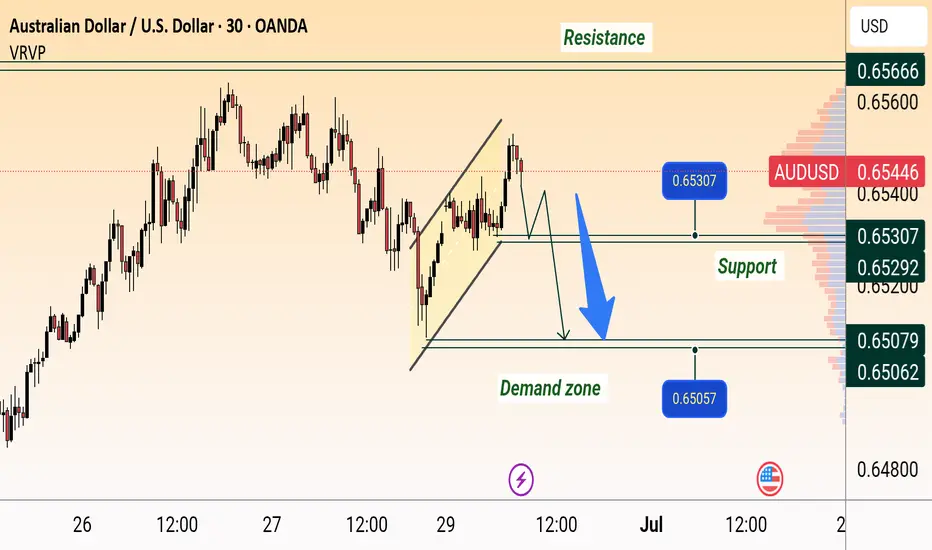
AUD/USD Bearish Reversal SetupAUD/USD Bearish Setup:
Price is showing rejection near resistance around 0.65600 and has broken below the rising channel. A retest of the broken trendline may lead to a drop towards the support zone at 0.65307, and potentially further to the demand zone around 0.65057–0.65000.