AUDUSD Potential UpsidesHey Traders, in today's trading session we are monitoring AUDUSD for a buying opportunity around 0.63800 zone, AUDUSD is trading in an uptrend and currently is in a correction phase in which it is approaching the trend at 0.63800 support and resistance area.
Trade safe, Joe.
AUDUSD trade ideas

Aussie H4 | Heading into a swing-high resistanceThe Aussie (AUD/USD) is rising towards a swing-high resistance and could potentially reverse off this level to drop lower.
Sell entry is at 0.6545 which is a swing-high resistance.
Stop loss is at 0.6571 which is a level that aligns with the 161.8% Fibonacci extension.
Take profit is at 0.6514 which is a pullback support.
High Risk Investment Warning
Trading Forex/CFDs on margin carries a high level of risk and may not be suitable for all investors. Leverage can work against you.
Stratos Markets Limited (tradu.com ):
CFDs are complex instruments and come with a high risk of losing money rapidly due to leverage. 63% of retail investor accounts lose money when trading CFDs with this provider. You should consider whether you understand how CFDs work and whether you can afford to take the high risk of losing your money.
Stratos Europe Ltd (tradu.com ):
CFDs are complex instruments and come with a high risk of losing money rapidly due to leverage. 63% of retail investor accounts lose money when trading CFDs with this provider. You should consider whether you understand how CFDs work and whether you can afford to take the high risk of losing your money.
Stratos Global LLC (tradu.com ):
Losses can exceed deposits.
Please be advised that the information presented on TradingView is provided to Tradu (‘Company’, ‘we’) by a third-party provider (‘TFA Global Pte Ltd’). Please be reminded that you are solely responsible for the trading decisions on your account. There is a very high degree of risk involved in trading. Any information and/or content is intended entirely for research, educational and informational purposes only and does not constitute investment or consultation advice or investment strategy. The information is not tailored to the investment needs of any specific person and therefore does not involve a consideration of any of the investment objectives, financial situation or needs of any viewer that may receive it. Kindly also note that past performance is not a reliable indicator of future results. Actual results may differ materially from those anticipated in forward-looking or past performance statements. We assume no liability as to the accuracy or completeness of any of the information and/or content provided herein and the Company cannot be held responsible for any omission, mistake nor for any loss or damage including without limitation to any loss of profit which may arise from reliance on any information supplied by TFA Global Pte Ltd.
The speaker(s) is neither an employee, agent nor representative of Tradu and is therefore acting independently. The opinions given are their own, constitute general market commentary, and do not constitute the opinion or advice of Tradu or any form of personal or investment advice. Tradu neither endorses nor guarantees offerings of third-party speakers, nor is Tradu responsible for the content, veracity or opinions of third-party speakers, presenters or participants.

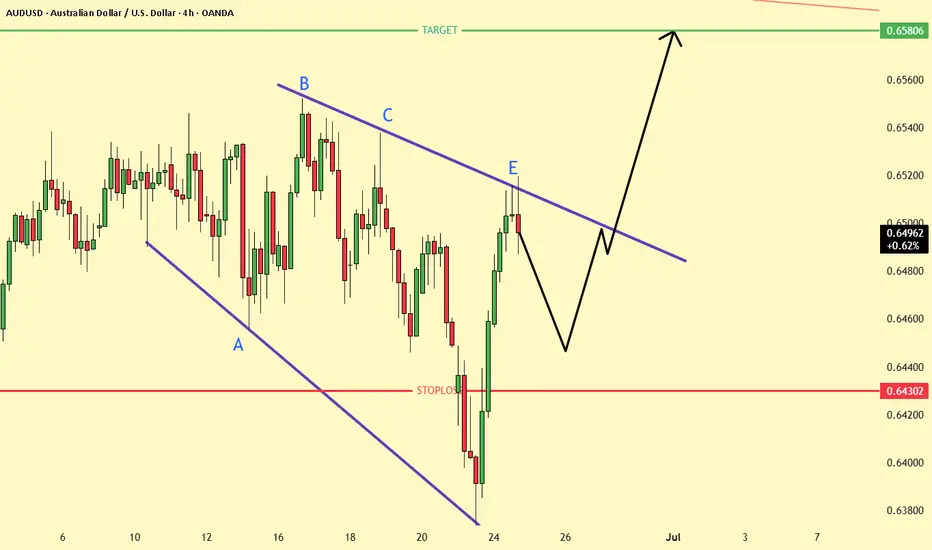
AUDUSD Ranging BullishHi there,
AUDUSD broke above (A) and formed a higher high (C). From this point, it gets interesting.
(BC) represents a full bullish range, and (n) is blocking the drop of (D). If the price falls below 0.64786, the bullish bias will be invalidated.
We have two price targets for a bias of 0.65397.
Happy trading,
K.
Not trading advice

AUDUSD SHORT FORECAST Q2 W26 D26 Y25AUDUSD SHORT FORECAST Q2 W26 D26 Y25
Professional Risk Managers👋
Welcome back to another FRGNT chart update📈
Diving into some Forex setups using predominantly higher time frame order blocks alongside confirmation breaks of structure.
Let’s see what price action is telling us today!
💡Here are some trade confluences📝
✅Daily order block
✅1H Order block
✅Intraday breaks of structure
✅4H Order block
🔑 Remember, to participate in trading comes always with a degree of risk, therefore as professional risk managers it remains vital that we stick to our risk management plan as well as our trading strategies.
📈The rest, we leave to the balance of probabilities.
💡Fail to plan. Plan to fail.
🏆It has always been that simple.
❤️Good luck with your trading journey, I shall see you at the very top.
🎯Trade consistent, FRGNT X

Short trade
1Hr TF overview
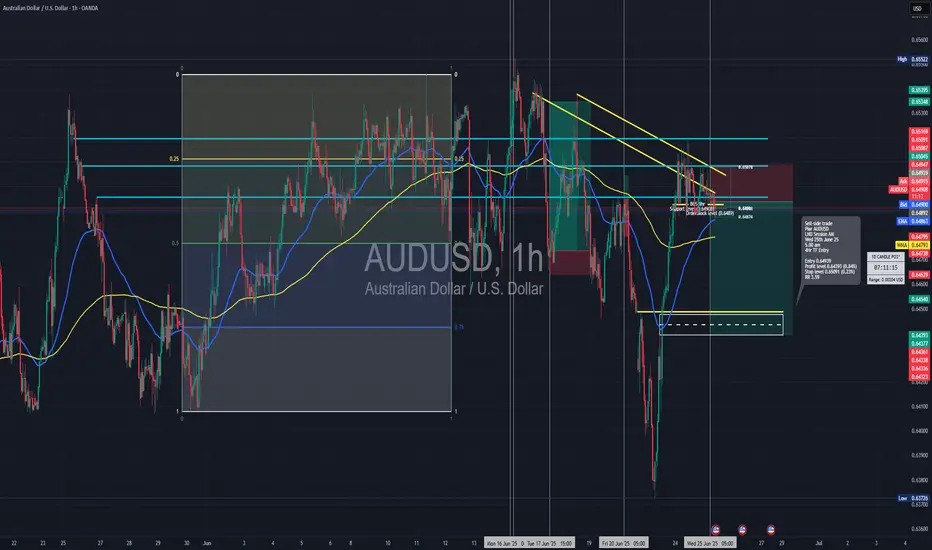
🔻 Trade Journal Entry – Sell-side Trade
📍 Pair: AUDUSD
📅 Date: Wednesday, June 25, 2025
🕒 Time: 5:00 AM (London Session AM)
⏱ Time Frame: 1 Hour
📉 Direction: Sell-side
📊 Trade Breakdown:
Metric Value
Entry Price 0.64939
Profit Level 0.64393 (−0.84%)
Stop Loss 0.65091 (+0.23%)
Risk-Reward
Ratio 3.59 1
🧠 Context / Trade Notes:
Premium Pricing at OB Rejection:
Price entered the premium zone and tapped a 1HR bearish order block, offering a clean entry for short positioning.
Australia's CPI slows, raising rate cut expectationsThe Australian dollar is showing limited movement on Wednesday. In the European session, AUD/USD is trading at 0.6495, up 0.08% on the day.
Australia's inflation rate headed lower in May. Headline CPI rose 2.1%, after gains of 2.4% in the previous three months. This was below the market estimate of 2.3%. Monthly, CPI eased to 0.4%, driven by lower petrol and housing costs.
The key core CPI indicator, annual trimmed mean inflation, also dropped sharply, to 2.4% from 2.8%, its lowest level since Nov. 2021.
The soft inflation report has boosted the case for the Reserve Bank of Australia to lower rates at the July meeting. The markets have priced in a 90% probability of a quarter-point cut, up from 81% prior to the inflation release. The markets have priced in three more rate cuts this year, following rate cuts in February and May.
The markets are counting on the RBA to be dovish in the second half of 2025. With inflation not only within the RBA's target of 2-3% but also falling, the markets expect that the RBA will be keen to lower rates in order to preserve economic growth.
Federal Reserve Chair Powell testified before a House Committee on Tuesday and had a cautious message for lawmakers. Powell said that the Fed was committed to keeping inflation contained and that the Fed planned to maintain rates until the impact of tariffs on inflation was more clear and reiterated that inflation still remained above the Fed's 2% target.
Powell has faced blistering criticism from President Trump for not lowering rates. In his testimony, Powell said that Trump's attacks were "having no effects" on Fed policy.
AUD/USD pushed above resistance at 1.3726 and is testing resistance at 1.3727. Above, there is resistance at 1.3750
1.3713 and 1.3702 are the next support levels


AUDUSD Potential short setup from and H4 Supply zone.We see a momentum loss once we reached the H4 supply zone. We see a lot of liquidity resting below an unmitigated m5 supply, Which could be liquidity for price to move to lower prices.

AUD/USD Shows Bullish Hints, Can Gains Be Sustained?Market Analysis: AUD/USD Shows Bullish Hints, Can Gains Be Sustained?
AUD/USD started a decent increase above the 0.6440 and 0.6465 levels.
Important Takeaways for AUD/USD Analysis Today
- The Aussie Dollar rebounded after forming a base above the 0.6370 level against the US Dollar.
- There was a break above a key bearish trend line with resistance at 0.6470 on the hourly chart of AUD/USD at FXOpen.
AUD/USD Technical Analysis
On the hourly chart of AUD/USD at FXOpen, the pair started a fresh increase from the 0.6370 support. The Aussie Dollar was able to clear the 0.6400 resistance to move into a positive zone against the US Dollar.
There was a close above the 0.6440 resistance and the 50-hour simple moving average. There was a break above a key bearish trend line with resistance at 0.6470. Finally, the pair tested the 0.6520 zone. A high was formed near 0.6519 and the pair recently started a consolidation phase.
The pair dipped and tested the 23.6% Fib retracement level of the upward move from the 0.6372 swing low to the 0.6519 high.
On the downside, initial support is near the 0.6485 level. The next major support is near the 0.6465 zone. If there is a downside break below the 0.6465 support, the pair could extend its decline toward the 0.6445 level. It is close to the 50% Fib retracement level.
Any more losses might signal a move toward 0.6405. On the upside, the AUD/USD chart indicates that the pair is now facing resistance near 0.6520. The first major resistance might be 0.6550. An upside break above 0.6580 might send the pair further higher.
The next major resistance is near the 0.6600 level. Any more gains could clear the path for a move toward 0.6650.
This article represents the opinion of the Companies operating under the FXOpen brand only. It is not to be construed as an offer, solicitation, or recommendation with respect to products and services provided by the Companies operating under the FXOpen brand, nor is it to be considered financial advice.

25.06.25 Morning ForecastPairs on Watch -
FX:AUDUSD
FX:NZDUSD
FX:EURAUD
A short overview of the instruments I am looking at for today, multi-timeframe analysis down to what I will be looking at for an entry. Enjoy!

AUD/USD, AUD/JPY: Soft CPI A Gift For RBA Doves?I have long said that the RBA could cut in July, and today's CPI figures all but confirm one is on tap. But with AUD/USD and AUD/JPY are rising, will bears get their say?
Matt Simpson, Market Analyst at City Index and Forex.com

Looking for buy AUDUSD I'm analyzing AUDUSD, and on the 4-hour timeframe, the overall market is in an uptrend. In the 1-hour timeframe, a minor downtrend has been broken, and the price looks ready to align with the overall uptrend. If the market comeback for retest that strong support then I’ll look for entry.


AUDUSD – Swing Point Failure Sell Setup (AUTH Model)AUDUSD just rejected from a significant swing point — not by accident, but through exhaustion. Price tapped into residual liquidity, failed to break continuation structure, and is now reverting to the dominant bias.
Market Breakdown
• Swing Failure: Price attempted to reverse at a key swing high but failed to hold. This is not a pause — it’s a confirmation of bearish control
• AUTH Context: Liquidity was swept above the swing, triggering a sell-side response
• Structure: Clean rejection wick + lower timeframe shift confirms bearish entry logic
• Bias: Weekly and H4 remain bearish, with price likely to return toward value and imbalance zones
Execution Logic
• Entry: After confirmation (internal structure break or supply wick)
• Invalidation: Hold above the failed swing = setup void
• Target: Move into inefficiency, previous demand zones, or deeper support structure
AUDUSD InsightHello to all our subscribers.
Please share your personal opinions in the comments. Don’t forget to like and subscribe.
Key Points
- Fed Chair Jerome Powell, during his testimony before the House, responded to a question regarding Governor Christopher Waller’s suggestion of a possible July rate cut by stating, “There are a range of possible paths. It’s a possible scenario.” However, the overall tone of the testimony emphasized a wait-and-see stance.
- While there was some noise around the Israel-Iran conflict, it has been confirmed that a ceasefire was agreed upon. The Israeli side stated, “The focus will shift back to Gaza. We will bring the hostages home and dismantle the Hamas regime.”
- Due to the effects of de-dollarization, Australia’s bond market is gaining attention, and Australian government bond yields are on a downward trend.
Major Economic Events This Week
+ June 25: Testimony by Fed Chair Jerome Powell
+ June 26: U.S. Q1 GDP
+ June 27: U.S. May PCE Price Index
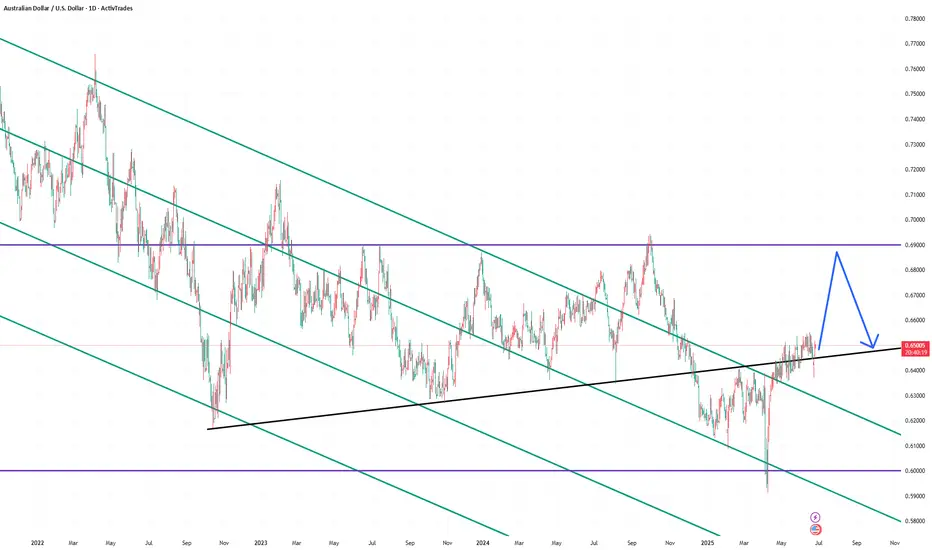
AUDUSD Chart Analysis
After a brief pullback, the AUD/USD pair fell to the 0.64000 level but rebounded from that support zone and is now showing an upward trend. A gradual climb is expected to continue, with the anticipated high near the 0.69000 level. However, there is minor resistance around the 0.67000 level, which could lead to a short-term decline, so caution is advised.
Australian dollar jumps on Israel-Iran cease fireThe Australian dollar is up sharply on Tuesday. In the North American session, AUD/USD is trading at 0.6504, up 0.70% on the day.
Investors' risk appetite is higher today after Israel and Iran agreed to a ceasefire in their 12-day war. The markets have reacted favorably to lower oil prices as fears that Iran would close the Straits of Hormuz, which would have disrupted global oil supplies, have diminished. Risk appetite has returned and risk currencies like the Australian dollar have posted strong gains today.
The Israel-Iran war has triggered sharp swings in oil prices and there are fears of an oil price shock if the fragile ceasefire does not hold. An oil price shock would send petrol prices higher and boost inflation, complicating the Reserve Bank of Australia's plans to lower interest rates.
Australia CPI expected to ease to 2.3%
Australia releases the May inflation report early on Wednesday. Headline CPI has been stuck at 2.4% for three consecutive months, within the Reserve Bank of Australia's target of 2-3% and its lowest level since Nov. 2024. The market estimate for May stands at 2.3%. Trimmed Mean CPI, a key core inflation indication, edged up to 2.8% from 2.7% in April.
The Reserve Bank will be keeping a close eye on the inflation report, with the central bank making a rate announcement on July 8. The RBA trimmed rates by a quarter-point in May and has shifted to a more dovish stance - the Board discussed a jumbo half-point cut at the May meeting.
Fred Chair Powell appears before Congress today and Wednesday and is likely to defend the Fed's wait-and-see stance. The Fed is concerned about President Trump's tariffs and the Israel-Iran war threatens stability in the Middle East, hardly the recipe for further rate cuts. Still, there appears to be some dissent within the Fed, as two members, Michelle Bowman and Christopher Waller, have suggested that the Fed could lower rates as early as September.
AUD/USD is testing resistance at 0.6490. Above, there is resistance at 0.6522
There is support at 0.6400 and 0.6342

BUY AUDUSDAUDUSD providing buy opportunities hot into NY session.
Buy 0,64911
Target 0,655
Pattern: Inverse Head and Shoulder

AUDUSD ready for LONG The falling wedge pattern is typically a bullish reversal signal. The structure shows decreasing selling pressure, and a breakout above the resistance trendline could trigger a strong upside move. The entry appears to be after a retest and confirmation.
AUDUSD Sellers In Panic! BUY!
My dear followers,
This is my opinion on the AUDUSD next move:
The asset is approaching an important pivot point 0.6427
Bias - Bullish
Technical Indicators: Supper Trend generates a clear long signal while Pivot Point HL is currently determining the overall Bullish trend of the market.
Goal - 0.6462
About Used Indicators:
For more efficient signals, super-trend is used in combination with other indicators like Pivot Points.
Disclosure: I am part of Trade Nation's Influencer program and receive a monthly fee for using their TradingView charts in my analysis.
———————————
WISH YOU ALL LUCK

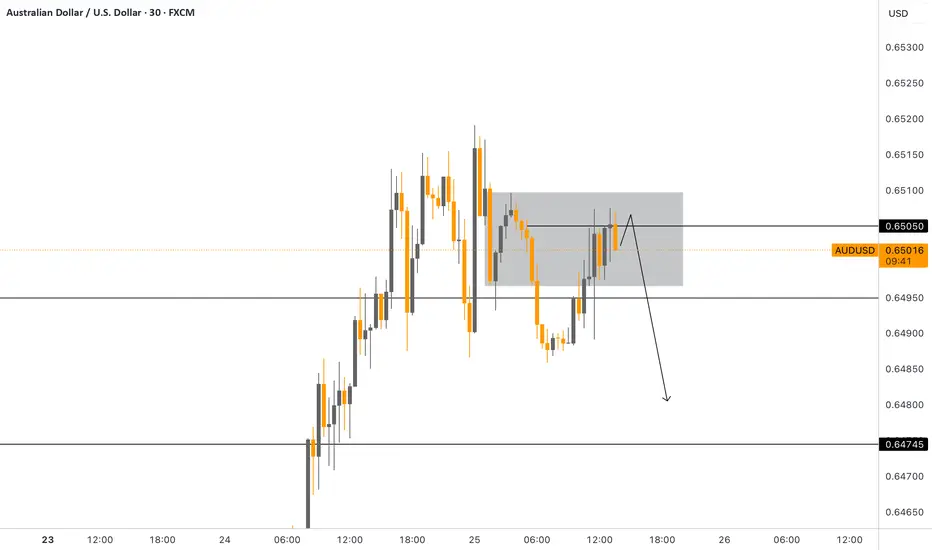
AUDUSD - Quick IdeaAnother last-minute idea, without much explanation… (If you have any questions, let’s discuss them in the comments).

AudusdThis is my bias on AU
Apply proper risk management pls
I’m not a financial advisor. 1% risk is only

AUDUSD - 4h |||Check this out for comprehensive analysis...
#AUSUSD #MJTRADING #FOREX #FXsignals #chart

AUD/USD 2H | MAKE OR BREAK (Key Edge)🟡 AUD/USD 2H Analysis – June 19, 2025
Bias: Neutral → Reactive (Awaiting Breakout Direction)
Timeframe: 2H
🔍 Market Overview:
AUD/USD is approaching a make-or-break level at the confluence of an ascending trendline and a minor horizontal support around 0.6460–0.6470. This comes after price was rejected from the 2025 high (0.6555) — a significant technical ceiling, labeled as a Possible Reversal Point.
✳️ Technical Structure:
🔵 Upper wedge resistance rejected price twice (0.6555)
🔵 Support trendline has been respected since late May
🟠 Current zone (0.6460) = last line of bullish defense
🔻 Breakdown risk is rising due to lower highs & compression
🔼 Bullish Playbook (Bounce Scenario):
Trigger: Bullish reaction from 0.6460 with strong momentum candle or engulfing
Entry: 0.6465–0.6475
Stop: Below 0.6440
Target 1: 0.6515
Target 2: 0.6555 (2025 High / Upper Wedge Edge)
R/R: ~2.0+
🔽 Bearish Playbook (Breakdown Scenario):
Trigger: 2H close below 0.6455 + retest rejection
Entry: 0.6450–0.6445 on retest
Stop: Above 0.6480
Target 1: 0.6400 (demand zone)
Target 2: 0.6300
R/R: ~2.5+
The next 4–8 candles could define the near-term structure. Respect the edge — react, don’t predict.
Zoom in:
Please Manage Your Risk...
#AUDUSD #MJTRADING #TRADINGVIEW #Chart #Analysis #Forex #Forexsignal #FXSignal
