AUDUSD BUY
AUD/USD rises to near 0.6480 as accelerating Fed dovish bets weigh on US Dollar
The AUD/USD pair moves higher to near 0.6480 during the European trading session on Monday. The Aussie pair gains as demand for risk-perceived assets has increased, following an increase in market expectations that the Fed could resume its monetary expansion cycle in the September meeting
The AUD/USD currency pair, commonly known as the “Aussie”, represents how many US dollars (the quote currency) are needed to purchase one Australian dollar (the base currency). Alongside the New Zealand Dollar (NZD) and the Canadian Dollar (CAD), the AUD is considered a commodity currency due to Australia’s significant exports of raw materials such as precious metals, Oil, and agricultural products.
The Reserve Bank of Australia (RBA) has historically maintained higher interest rates compared to other industrialized nations. Combined with the relatively high liquidity of the AUD, this has made the AUD attractive for carry traders looking for higher yields.
SUPPORT 0.64852
SUPPORT 0.65074
SUPPORT 0.65285
RESISTANCE 0.64498
AUDUSD trade ideas

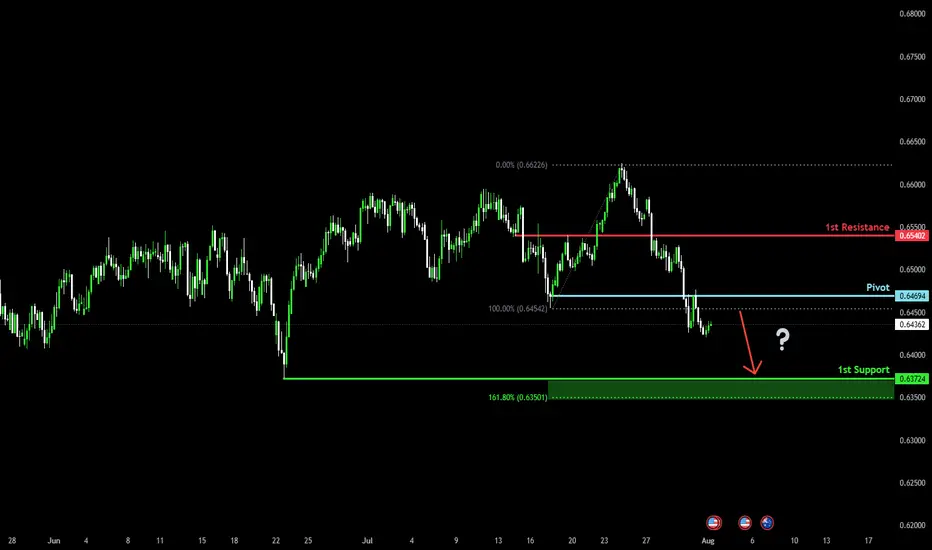
Could we see a further drop for the Aussie?The price has rejected off the pivot, which has been identified as a pullback resistance and could drop to the 1st support, which acts as a swing low support.
Pivot: 0.6469
1st Support: 0.6372
1st Resistance: 0.6540
Risk Warning:
Trading Forex and CFDs carries a high level of risk to your capital and you should only trade with money you can afford to lose. Trading Forex and CFDs may not be suitable for all investors, so please ensure that you fully understand the risks involved and seek independent advice if necessary.
Disclaimer:
The above opinions given constitute general market commentary, and do not constitute the opinion or advice of IC Markets or any form of personal or investment advice.
Any opinions, news, research, analyses, prices, other information, or links to third-party sites contained on this website are provided on an "as-is" basis, are intended only to be informative, is not an advice nor a recommendation, nor research, or a record of our trading prices, or an offer of, or solicitation for a transaction in any financial instrument and thus should not be treated as such. The information provided does not involve any specific investment objectives, financial situation and needs of any specific person who may receive it. Please be aware, that past performance is not a reliable indicator of future performance and/or results. Past Performance or Forward-looking scenarios based upon the reasonable beliefs of the third-party provider are not a guarantee of future performance. Actual results may differ materially from those anticipated in forward-looking or past performance statements. IC Markets makes no representation or warranty and assumes no liability as to the accuracy or completeness of the information provided, nor any loss arising from any investment based on a recommendation, forecast or any information supplied by any third-party.
AUDUSD- SMC Breakdown: Understanding Smart Money Moves📘 SMC Breakdown: Understanding Smart Money Moves
🔹 Buy-side liquidity was engineered to trap late buyers.
🔹 Price created a fakeout above the highs — classic liquidity grab.
🔹 Entry followed right after the FVG (Fair Value Gap) fill.
🔹 Sharp reversal marked by CHOCH (Change of Character), confirming shift in structure.
🔹 Market swept sell-side liquidity, triggering BOS (Break of Structure) — ideal exit or next entry zone.

AUDUSD: Great Trading Opportunity
AUDUSD
- Classic bearish pattern
- Our team expects retracement
SUGGESTED TRADE:
Swing Trade
Sell AUDUSD
Entry - 0.6475
Stop - 0.6480
Take - 0.6464
Our Risk - 1%
Start protection of your profits from lower levels
Disclosure: I am part of Trade Nation's Influencer program and receive a monthly fee for using their TradingView charts in my analysis.
❤️Please, support our work with like & comment!❤️

AUDUSD – Plan Ready for Both ScenariosWe're patiently waiting for price to reach our key zone. If we get a valid sell signal, we’ll take the short.
But if the market breaks above this level with strength and gives us a clean pullback, we’re ready to go long.
No guessing. No hoping. Just reacting to what the market shows us.
📌 Discipline over prediction.

AUDUSD – DAILY FORECAST Q3 | W32 | D6 | Y25📊 AUDUSD – DAILY FORECAST
Q3 | W32 | D6 | Y25
Daily Forecast 🔍📅
Here’s a short diagnosis of the current chart setup 🧠📈
Higher time frame order blocks have been identified — these are our patient points of interest 🎯🧭.
It’s crucial to wait for a confirmed break of structure 🧱✅ before forming a directional bias.
This keeps us disciplined and aligned with what price action is truly telling us.
📈 Risk Management Protocols
🔑 Core principles:
Max 1% risk per trade
Only execute at pre-identified levels
Use alerts, not emotion
Stick to your RR plan — minimum 1:2
🧠 You’re not paid for how many trades you take, you’re paid for how well you manage risk.
🧠 Weekly FRGNT Insight
"Trade what the market gives, not what your ego wants."
Stay mechanical. Stay focused. Let the probabilities work.
FX:AUDUSD

AUDUSD SellLIT cycle. Daily cycle. Liquidity grab or also known as inducement on the high. Session timing.

Australia inflation gauge hits 20-month high, Aussie gains grounThe Australian dollar has extended its gains on Monday. In the North American session, AUD/USD is trading at 0.6483 up 0.22% on the day. The US dollar made inroads last week against all the major currencies except the yen and gained 1.5% against the Australian dollar.
Australia's Melbourne Institute inflation guage soared 0.9% m/m in July, up sharply from 0.1% in June and marking the highest rise since Dec. 2023. The MI gauge, which provides a monthly guide to consumer inflation (official CPI is published quarterly), will no doubt raise concerns at the Reserve Bank of Australia, which has been cautious about cutting rates due to inflation worries.
Last week, CPI for the second quarter eased to 1.9%, down from 2.2% in Q1 and just below the central bank's target of 2%-3%. This cements a rate cut at the Aug. 12 meeting, after the RBA shocked the markets last month when it held rates. The markets had widely priced in a rate cut but the RBA defended its non-move, saying it wanted to see additional inflation data.
The week ended with a softer-than-expected US employment report. Nonfarm payrolls for July rose by only 73 thousand, missing the market estimate of 110 thousand. Adding to the bad news, the June and May reports were both revised sharply lower, down by a combined 258 thousand. The unemployment rate ticked higher to 4.2%, up from 4.1%.
The weak July reading and the downward revisions indicate that the labor market may be cooling more quickly than initially anticipated. The weak numbers support the case for the Fed to lower interest rates at the next rate meeting in September. The likelihood of a cut has climbed to 75%, compared to 63% on Thursday.
The soft jobs report should serve as a wake-up call regarding the effect of US tariffs on the economy, as the employment picture is worse than previously thought.

AUDUSD – DAILY FORECAST Q3 | W32 | D5 | Y25📊 AUDUSD – DAILY FORECAST
Q3 | W32 | D5 | Y25
Daily Forecast 🔍📅
Here’s a short diagnosis of the current chart setup 🧠📈
Higher time frame order blocks have been identified — these are our patient points of interest 🎯🧭.
It’s crucial to wait for a confirmed break of structure 🧱✅ before forming a directional bias.
This keeps us disciplined and aligned with what price action is truly telling us.
📈 Risk Management Protocols
🔑 Core principles:
Max 1% risk per trade
Only execute at pre-identified levels
Use alerts, not emotion
Stick to your RR plan — minimum 1:2
🧠 You’re not paid for how many trades you take, you’re paid for how well you manage risk.
🧠 Weekly FRGNT Insight
"Trade what the market gives, not what your ego wants."
Stay mechanical. Stay focused. Let the probabilities work.
FX:AUDUSD

AUDUSD(20250805)Today's AnalysisMarket News:
Goldman Sachs: The Federal Reserve is expected to cut interest rates by 25 basis points three times starting in September; a 50 basis point cut is possible if the unemployment rate rises further.
Technical Analysis:
Today's Buy/Sell Levels:
0.6470
Support and Resistance Levels:
0.6500
0.6489
0.6482
0.6459
0.6451
0.6440
Trading Strategy:
If the price breaks above 0.6470, consider buying, with the first target price at 0.6489. If the price breaks below 0.6459, consider selling, with the first target price at 0.6440.

AUDUSD SellLit cycle. Daily cycle. Reaction off POI. Price does inducement and timing correlates with session

AUD eyes yield advantage over USD UBS strategists view the Australian dollar as a compelling long opportunity at current levels, supported by expectations that the Reserve Bank of Australia will ease policy more gradually than the U.S. Federal Reserve.
The bank forecasts 75 basis points of rate cuts from the RBA through Q1 2026, compared to 100 basis points from the Fed—helping to preserve a relative yield advantage for the Aussie.
On the daily chart, AUD/USD remains within a well-defined ascending channel that began in late 2024. The pair recently bounced off the lower boundary of the channel near 0.6450, with long lower wicks potentially indicating dip-buying interest.
Immediate resistance could sit at 0.6600, followed by a major zone near 0.6670. A break above these levels could confirm bullish continuation.

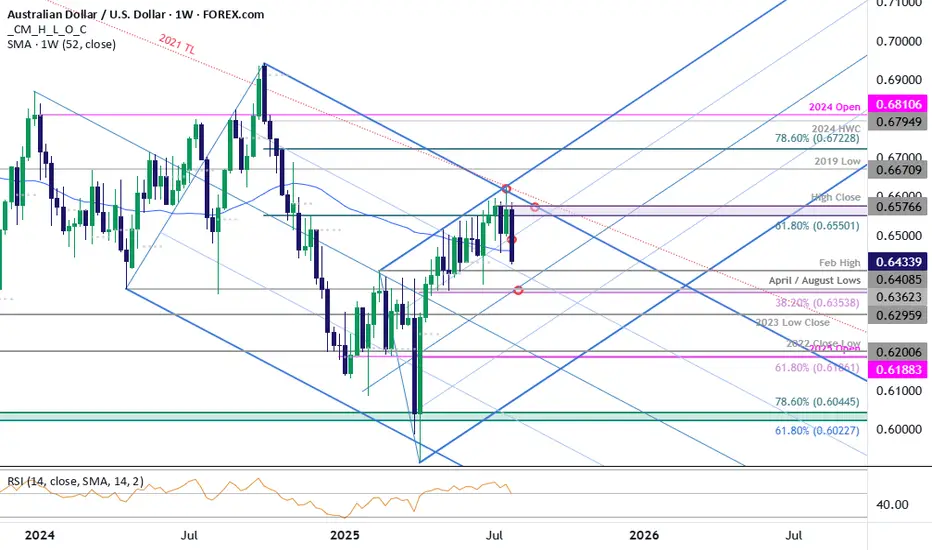
AUD/USD Rejected at Resistance-Fed on TapYesterday’s Fed-induced sell-off broke through the monthly opening-range lows / 52-week moving average with the bears now poised to mark a sixth-consecutive daily decline.
It's worth noting that weekly momentum peaked at 60 on the April advance with RSI now poised to close back below 50. The observation suggests the broader downtrend remains intact and a pivot / break below slope support could mark trend resumption.
Initial weekly support is eyed with the February high at 6408 and is backed by the 38.2% retracement of the yearly range / February high-week close (HWC) at 6354/57. A break / daily close below this region would be required to suggest that a more significant high is in place, potentially signaling a larger reversal underway. In such a scenario, the next downside objectives would be the yearly low-week close and 2023 low-close at 6291/96, followed by the 61.8% retracement and 2022 low-close at 6186–6201. Both of these zones are key areas of interest for potential downside exhaustion / price inflection IF reached.
Look for initial resistance back at the 52-week moving average (currently ~6460) with key resistance now seen back at the 61.8% retracement / yearly high-close at 6550/77. Note that the upper parallel converges on this threshold over the next few weeks and further highlights the technical significance of this zone. Ultimately a breach / weekly close above the 2021 trendline (red) would be needed to validate a breakout of the multi-year downtrend in Aussie.
Bottom line: A reversal off downtrend resistance is now approaching initial support- risk for trend resumption heading into August. From a trading standpoint, the immediate focus is on the weekly close with respect to 6400- rallies should be limited to the 52-week moving average IF Aussie is heading lower on this stretch with a close below needed to keep the immediate short-bias viable heading into the monthly cross.
Keep in mind we get the release of key US employment data tomorrow with Non-Farm Payrolls on tap. Stay nimble into the release and watch the weekly close / August opening-range for guidance for guidance.
-MB
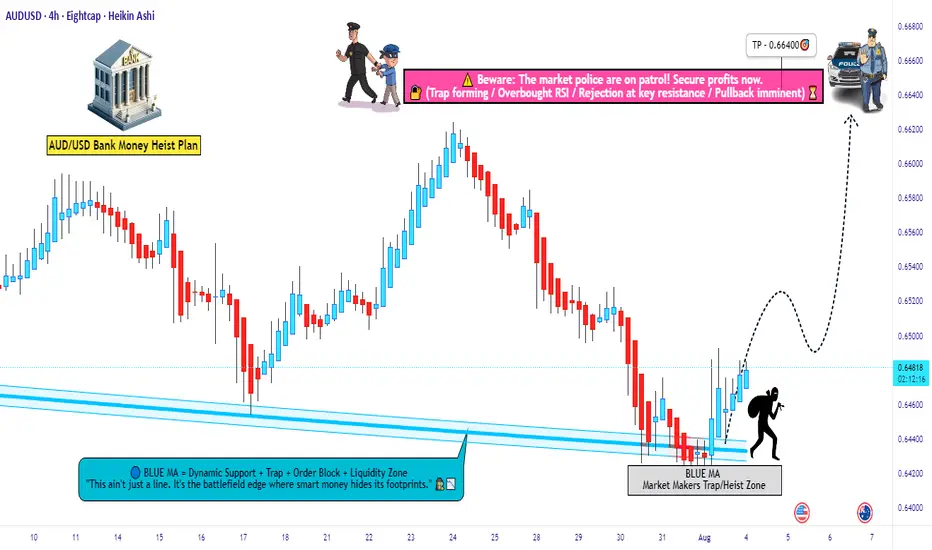
Ready for the Aussie Heist? Is This the Perfect Entry?🚨💰 - "The Aussie Vault Raid: Bullish Robbery in Progress!" 💰🚨
AUD/USD Forex Trade Idea (Thief Style Swing/Day Plan)
📈🔥 Designed for Thief Traders, Market Robbers & Money Makers Worldwide 🤑🐱👤💸
🌍 Hello Global Robbers!
🌟 Hola! Ola! Bonjour! Hallo! Salaam! Konnichiwa! 🌟
Welcome to another bold heist plan from the Thief Trading Crew. This one’s a high-stakes raid on the AUD/USD — "The Aussie" — using our signature Thief Trading Style, combining raw technical setups with real macro/fundamental edge. We're eyeing the Bullish Vault Breakout, so tighten up your gloves — it’s time to rob smart, not hard.
🔓💸 ENTRY PLAN – “The Vault is Unlocked!”
Grab the bullish loot at any valid price zone — but here’s how real thieves move:
📍 Recommended Entry Style:
Use Buy Limit Orders near local swing lows, demand zones, or key pullback entries on the 15m to 30m chart.
Execute DCA (Dollar Cost Averaging) / Layered Orders for more precision.
Align with your MA lines & candle structures for max confirmation.
🛑 STOP LOSS – “Escape Route Secured”
📍 SL hidden beneath recent swing lows below MA (on 4H):
🎯 Suggested Level: 0.64170
💡 Custom-fit your SL based on:
Trade size
Number of active positions
Account risk strategy
🎯 PROFIT TARGET – “Cash Out Before the Cops Show!”
🏴☠️ Take-Profit Zone: 0.66400
This is our bullish breakout reward zone — a high-value zone where profit meets safety.
🔍 MARKET OUTLOOK – "Cops Are Watching, but We're Ahead..."
📈 The AUD/USD market is flashing bullish momentum, supported by:
✅ Risk sentiment flow
✅ US Dollar weakness and rate expectations
✅ Intermarket signals from commodities (Gold/Iron)
✅ Positive macro positioning from smart money (via COT)
✅ Technical demand forming reversal patterns from oversold zones
📎 For a deeper breakdown —
📰 Fundamentals | COT Reports | Sentiment | Intermarket Analysis — Check Klick 🔗
⚠️ THIEF ALERT – “Avoid Sirens. Watch the News.”
Stay out of trouble by following these protocols during major news events:
🚫 Don’t enter trades blindly before/after big news
📍 Use trailing stops to protect gains
🔄 Adjust SL/TP if price nears breakout points during volatility
💥 SUPPORT THE CREW – “Smash That Boost Button!”
Love the plan? Then Boost this chart to show love for the Thief Trading Movement.
Every like, comment, and boost adds power to our robbery network across the globe. 🌍❤️💰
⚖️ DISCLAIMER – “Not Financial Advice, Just Thief Vibes”
📌 This analysis is for educational and entertainment purposes only.
📌 Trade at your own risk and always do your own analysis.
📌 Market moves fast — stay sharp, stay stealthy.
**🎭 See you at the next heist.
Until then, trade rich. Rob wise.
Thief Trader out. 🐱👤💰📉📈**
AUDUSD SWING: SHORT-TERM BEARISH OPPORTUNITY (TRICKY)Hi there,
I'd like to see AUDUSD trade lower after running multiple highs and lows and creating a MSS on the weekly chart.
Price is also currently trading in-between weekly support and resistance levels which could aid the trade play out. The only concern I have is that the current region price is playing at is quite choppy - hence, price might not move cleanly.
Anyways, watchout for my next post tomorrow.
Cheers,
Jabari

short market outlook on AUDUSD todayfor todays AUDUSD market we can except to short the market after price break Asia low and retraces up to premium zone and getting CHOCH

AUDUSD Clear Short opportunityWe have been over extended on multiple oscillators. We are going to start layering sells at now and keep layering new sells every 1 to two candles. Keep risk light per candle. we are going to targe the VWAP for TP. We have pulled far enough away that we can expect a retest.

AUD/USD Analysis Based on Volume, Fibonacci & Stochastic
This AUD/USD setup is based on:
Volume Profile zones to detect institutional interest
Fibonacci levels for structural confirmation
Stochastic oscillator to time the entry more accurately
🔹 Entry: 0.6460
🔹 Stop-Loss: 0.6476
🔹 Take-Profit: 0.6441
🔹 Risk-to-Reward Ratio: 1.19
⚠️ Disclaimer: This analysis is for educational purposes only and does not constitute financial advice. Always do your own due diligence and manage risk appropriately.

AUD bullish swing setupBull points
RSI div
Trend reversal
RRR 1:2
Manage your risk for longer holding

AUDUSD InsightHello to all our subscribers.
Please share your personal opinions in the comments.
Don’t forget to hit the booster and subscribe!
Key Points
- The U.S. ISM Services PMI for July came in at 50.1, indicating continued expansion, but at a slower pace. The figure also fell short of market expectations. Among the subcomponents, the Prices Index rose 2.4 points to 69.9, suggesting strong upward pressure on prices across raw materials and service input costs.
- U.S. President Trump stated, “We will impose a small tariff on pharmaceuticals at first, but within a year or up to a year and a half, it will rise to 150%, and eventually to 250%.”
- In an interview with CNBC, President Trump said he is considering four candidates for the next Federal Reserve Chair, including Kevin Hassett, Chairman of the White House National Economic Council, and former Fed Governor Kevin Warsh.
Key Economic Events This Week
+ August 7: Bank of England (BOE) rate decision
AUDUSD Chart Analysis
Although there has been a recent pullback, the pair continues to follow an upward trend. The fact that both highs and lows are rising confirms the prevailing bullish trend. The medium- to long-term outlook remains upward toward the 0.69000 level, while we will monitor for potential short-term pullbacks around the 0.67000 level.

AUDUSD – DAILY FORECAST Q3 | W32 | D7 | Y25📊 AUDUSD – DAILY FORECAST
Q3 | W32 | D7 | Y25
Daily Forecast 🔍📅
Here’s a short diagnosis of the current chart setup 🧠📈
Higher time frame order blocks have been identified — these are our patient points of interest 🎯🧭.
It’s crucial to wait for a confirmed break of structure 🧱✅ before forming a directional bias.
This keeps us disciplined and aligned with what price action is truly telling us.
📈 Risk Management Protocols
🔑 Core principles:
Max 1% risk per trade
Only execute at pre-identified levels
Use alerts, not emotion
Stick to your RR plan — minimum 1:2
🧠 You’re not paid for how many trades you take, you’re paid for how well you manage risk.
🧠 Weekly FRGNT Insight
"Trade what the market gives, not what your ego wants."
Stay mechanical. Stay focused. Let the probabilities work.
FX:AUDUSD

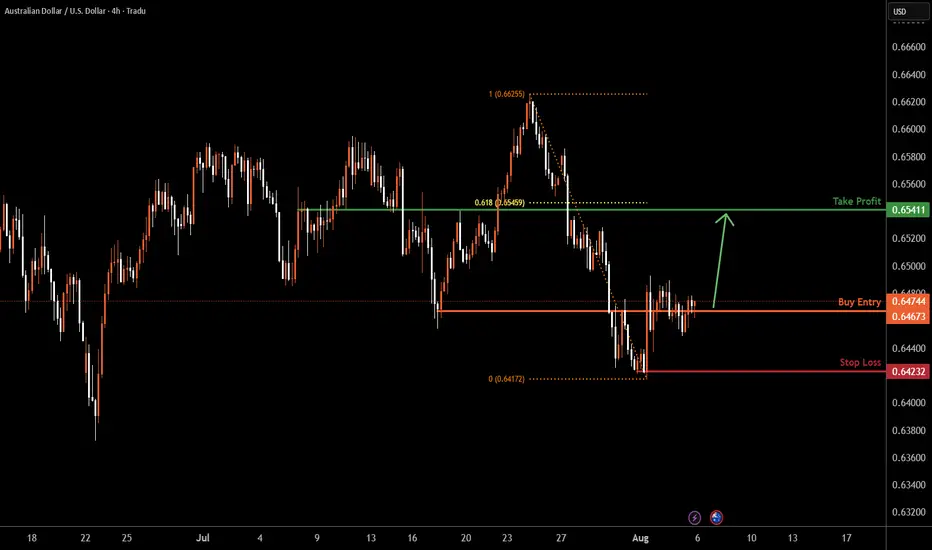
AUDUSD H4 | Could the Aussie reverse from hereAUD/USD is reacting off the buy entry which is a an overlap support and could rise from this level to the upside.
Buy entry is at 0.6472, which is an overlap support.
Stop loss is at 0.6423, which is a swing low support.
Take profit is at 0.6541, which is a pullback resistance that lines up with the 61.8% Fibonacci retracement.
High Risk Investment Warning
Trading Forex/CFDs on margin carries a high level of risk and may not be suitable for all investors. Leverage can work against you.
Stratos Markets Limited (tradu.com ):
CFDs are complex instruments and come with a high risk of losing money rapidly due to leverage. 65% of retail investor accounts lose money when trading CFDs with this provider. You should consider whether you understand how CFDs work and whether you can afford to take the high risk of losing your money.
Stratos Europe Ltd (tradu.com ):
CFDs are complex instruments and come with a high risk of losing money rapidly due to leverage. 66% of retail investor accounts lose money when trading CFDs with this provider. You should consider whether you understand how CFDs work and whether you can afford to take the high risk of losing your money.
Stratos Global LLC (tradu.com ):
Losses can exceed deposits.
Please be advised that the information presented on TradingView is provided to Tradu (‘Company’, ‘we’) by a third-party provider (‘TFA Global Pte Ltd’). Please be reminded that you are solely responsible for the trading decisions on your account. There is a very high degree of risk involved in trading. Any information and/or content is intended entirely for research, educational and informational purposes only and does not constitute investment or consultation advice or investment strategy. The information is not tailored to the investment needs of any specific person and therefore does not involve a consideration of any of the investment objectives, financial situation or needs of any viewer that may receive it. Kindly also note that past performance is not a reliable indicator of future results. Actual results may differ materially from those anticipated in forward-looking or past performance statements. We assume no liability as to the accuracy or completeness of any of the information and/or content provided herein and the Company cannot be held responsible for any omission, mistake nor for any loss or damage including without limitation to any loss of profit which may arise from reliance on any information supplied by TFA Global Pte Ltd.
The speaker(s) is neither an employee, agent nor representative of Tradu and is therefore acting independently. The opinions given are their own, constitute general market commentary, and do not constitute the opinion or advice of Tradu or any form of personal or investment advice. Tradu neither endorses nor guarantees offerings of third-party speakers, nor is Tradu responsible for the content, veracity or opinions of third-party speakers, presenters or participants.
AUDUSD – DAILY FORECAST Q3 | W32 | D4 | Y25📊 AUDUSD – DAILY FORECAST
Q3 | W32 | D4 | Y25
Daily Forecast 🔍📅
Here’s a short diagnosis of the current chart setup 🧠📈
Higher time frame order blocks have been identified — these are our patient points of interest 🎯🧭.
It’s crucial to wait for a confirmed break of structure 🧱✅ before forming a directional bias.
This keeps us disciplined and aligned with what price action is truly telling us.
📈 Risk Management Protocols
🔑 Core principles:
Max 1% risk per trade
Only execute at pre-identified levels
Use alerts, not emotion
Stick to your RR plan — minimum 1:2
🧠 You’re not paid for how many trades you take, you’re paid for how well you manage risk.
🧠 Weekly FRGNT Insight
"Trade what the market gives, not what your ego wants."
Stay mechanical. Stay focused. Let the probabilities work.
FX:AUDUSD
