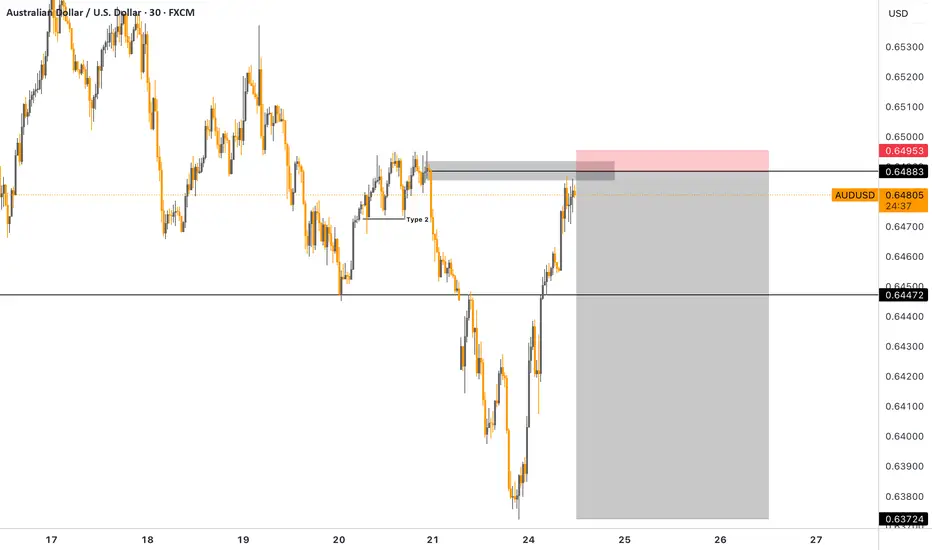
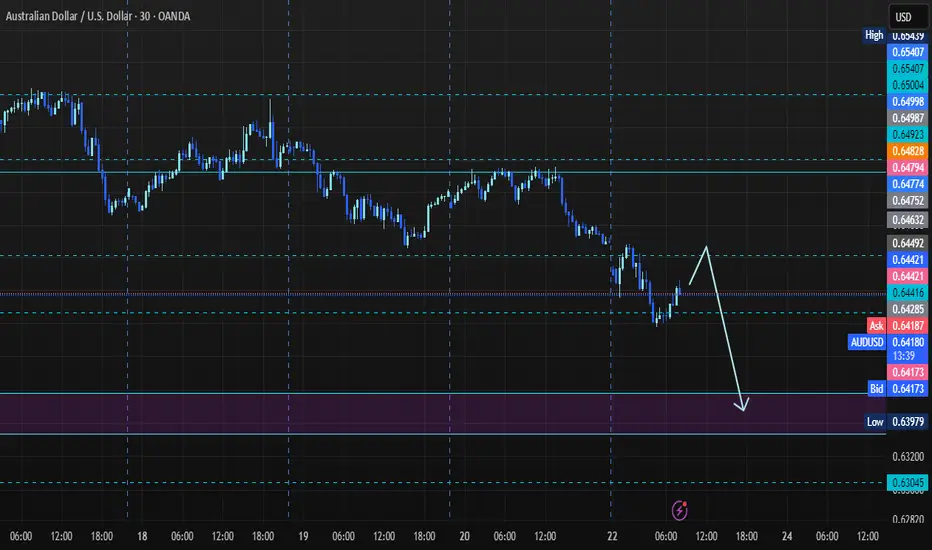
AUDUSD SHORT FORECAST Q2 W26 D24 Y25AUDUSD SHORT FORECAST Q2 W26 D24 Y25
Professional Risk Managers👋
Welcome back to another FRGNT chart update📈
Diving into some Forex setups using predominantly higher time frame order blocks alongside confirmation breaks of structure.
Let’s see what price action is telling us today!
💡Here are some trade confluences📝
✅Daily order block
✅1H Order block
✅Intraday breaks of structure
✅4H Order block
🔑 Remember, to participate in trading comes always with a degree of risk, therefore as professional risk managers it remains vital that we stick to our risk management plan as well as our trading strategies.
📈The rest, we leave to the balance of probabilities.
💡Fail to plan. Plan to fail.
🏆It has always been that simple.
❤️Good luck with your trading journey, I shall see you at the very top.
🎯Trade consistent, FRGNT X
AUDUSD trade ideas

AUDUSD I Monthly CLS I Model 1 I TR - LiquidityHey, Market Warriors, here is another outlook on this instrument
If you’ve been following me, you already know every setup you see is built around a CLS Footprint, a Key Level, Liquidity and a specific execution model.
If you haven't followed me yet, start now.
My trading system is completely mechanical — designed to remove emotions, opinions, and impulsive decisions. No messy diagonal lines. No random drawings. Just clarity, structure, and execution.
🧩 What is CLS?
CLS is real smart money — the combined power of major investment banks and central banks moving over 6.5 trillion dollars a day. Understanding their operations is key to markets.
✅ Understanding the behavior of CLS allows you to position yourself with the giants during the market manipulations — leading to buying lows and selling highs - cleaner entries, clearer exits, and consistent profits.
📍 Model 1
is right after the manipulation of the CLS candle when CIOD occurs, and we are targeting 50% of the CLS range. H4 CLS ranges supported by HTF go straight to the opposing range.
"Adapt what is useful, reject what is useless, and add what is specifically your own."
— David Perk aka Dave FX Hunter ⚔️
👍 Hit like if you find this analysis helpful, and don't hesitate to comment with your opinions, charts or any questions.

AUDUSD – Type 2 AUTH Sell Setup (Weekly Bias | Tight Execution)Price is rejecting from a precision-based Type 2 Area of Liquidity (AOL) — a textbook scenario under the AUTH model, backed by higher-timeframe direction.
Breakdown
• Bias: Weekly momentum remains bearish with clean lower highs and fresh structure breaks
• AOL Type 2: Price taps into refined supply zone within premium, mid-volume zone — no excess, no noise
• Execution: Entry confirmed on lower timeframes after micro shift or rejection wick
• Stop Loss: 7 pips only — precise risk, nothing emotional
• Target: Continuation into inefficiency zones and previous internal demand
• Invalidation: Close above AOL structure – no hesitation, no negotiation
Disclaimer: This setup is shared for educational purposes only. It is not financial advice. Always apply proper risk management and trade responsibly.
AUD/USD Trade Zone!Firstly, we are in a news market right now and news is everything to understanding price action.
After a busy international weekend, AUD/USD opened strong to the sell side. We got the first initial push down last week when Iran attacked Israel. Then, this weekend, Trump struck Iran.
With Trump striking Iran, markets opened bearish initially. After the good news of Iran and Israel coming to peace, we are seeing markets start to rebound a bit.
Where we are currently in the markets is a good structural spot to make some moves. The market has been following a downtrend structure following the Lower-Low, Lower-High pattern and we are currently at the next lower high if the market is going to respect its current market structure.
I am preparing for sells in an overbought market, which is unsure of future international tensions. I am either waiting for a structure break where the gold line indicates or for the market to respect the current structure to play to the low side.
I will be back with future updates.

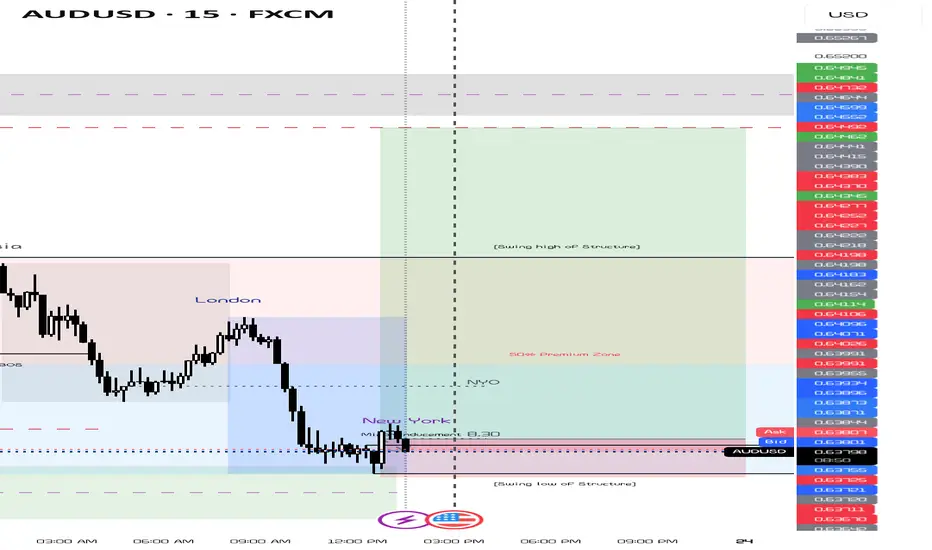
Precision Rejection: AUD/USD Short in MotionBias: Bearish
Date: June 23, 2025
Timeframe: 1-Hour
⸻
Market Context:
AUD/USD has retraced back into a 1H supply zone between 0.6480–0.6500, where strong institutional selling occurred previously. The recent bounce from 0.6372 appears corrective, driven by short-term USD softness, but the broader structure remains bearish.
This current move is setting up for a liquidity grab above recent highs, creating the ideal conditions for a lower high rejection and a possible selloff back into a large imbalance zone resting below.
This area holds:
• Buy stops from breakout traders
• Trapped long entries from the recent retracement
• Institutional sell-side liquidity
• A visible imbalance gap down to the 0.61143 region, waiting to be filled
⸻
My Analysis and Bias:
I believe AUD/USD is setting up for a liquidity sweep above 0.6480, followed by a sharp rejection. After confirming a lower high and bearish momentum, I’m expecting a clean break of 0.6430 support and continuation toward the imbalance fill at 0.61143.
This is a smart money setup:
1. Price taps into supply and rejects
2. A lower high forms after sweep
3. Bearish structure breaks below 0.6430
4. Price fills imbalance resting around 0.61143
⸻
Entry Plan:
• Primary Entry: 0.6482–0.6485 after rejection from supply
• Confirmation Tools: Rejection wick, bearish engulfing candle, or break of minor structure
• Stop Loss: Above 0.6517 (protective stop above liquidity sweep zone)
⸻
Take Profit Levels:
• TP1: 0.6430 – Breaker structure
• TP2: 0.6380 – Major support
• TP3: 0.6300 – Secondary liquidity pool
• TP4: 0.61143 – Imbalance fill (final target)
⸻
Execution Plan Summary:
• Entry: 0.6482 after rejection or clear confirmation
• SL: ~0.6517
• TPs: 0.6430 → 0.6380 → 0.6300 → 0.61143
• Risk/Reward: ~10:1 potential based on charted range
⸻
Final Thoughts:
“This is a premium setup built around smart money concepts. Market structure, supply rejection, and imbalance alignment are all here. Once confirmation hits, I’ll execute — no guessing.
Trade simple. Live lavish.”

Bullish momentum to rise?The Aussie (AUD/USD) is reacting off the pivot which acts as an overlap resistance and could rise to the 1st resistance.
Pivot: 0.6457
1st Support: 0.6388
1st Resistance: 0.6546
Risk Warning:
Trading Forex and CFDs carries a high level of risk to your capital and you should only trade with money you can afford to lose. Trading Forex and CFDs may not be suitable for all investors, so please ensure that you fully understand the risks involved and seek independent advice if necessary.
Disclaimer:
The above opinions given constitute general market commentary, and do not constitute the opinion or advice of IC Markets or any form of personal or investment advice.
Any opinions, news, research, analyses, prices, other information, or links to third-party sites contained on this website are provided on an "as-is" basis, are intended only to be informative, is not an advice nor a recommendation, nor research, or a record of our trading prices, or an offer of, or solicitation for a transaction in any financial instrument and thus should not be treated as such. The information provided does not involve any specific investment objectives, financial situation and needs of any specific person who may receive it. Please be aware, that past performance is not a reliable indicator of future performance and/or results. Past Performance or Forward-looking scenarios based upon the reasonable beliefs of the third-party provider are not a guarantee of future performance. Actual results may differ materially from those anticipated in forward-looking or past performance statements. IC Markets makes no representation or warranty and assumes no liability as to the accuracy or completeness of the information provided, nor any loss arising from any investment based on a recommendation, forecast or any information supplied by any third-party.

EU,AU,Oil Trading TalksThanks for tuning in guys coming with a lot of free sauce that might help you in the coming weeks to have success in this market

Potential bullish rise?AUD/USD has bounced off the support level which is a pullback support and could rise from this level to our take profit.
Entry: 0.6406
Why we like it:
There is a pullback support level.
Stop loss: 0.6359
Why we like it:
There is a pullback support level.
Take profit: 0.6512
Why we like it:
There is a pullback resistance level that lines up with the 78.6% Fibonacci retracement.
njoying your TradingView experience? Review us!
Please be advised that the information presented on TradingView is provided to Vantage (‘Vantage Global Limited’, ‘we’) by a third-party provider (‘Everest Fortune Group’). Please be reminded that you are solely responsible for the trading decisions on your account. There is a very high degree of risk involved in trading. Any information and/or content is intended entirely for research, educational and informational purposes only and does not constitute investment or consultation advice or investment strategy. The information is not tailored to the investment needs of any specific person and therefore does not involve a consideration of any of the investment objectives, financial situation or needs of any viewer that may receive it. Kindly also note that past performance is not a reliable indicator of future results. Actual results may differ materially from those anticipated in forward-looking or past performance statements. We assume no liability as to the accuracy or completeness of any of the information and/or content provided herein and the Company cannot be held responsible for any omission, mistake nor for any loss or damage including without limitation to any loss of profit which may arise from reliance on any information supplied by Everest Fortune Group.

Trade Idea: Sell AUDUSD (Short-Term Weakness Setup) **📉 Trade Idea: Sell AUDUSD (Short-Term Weakness Setup)**
**Bias:** 🔻 Bearish (Short-Term) | ⚖️ Medium-Term Neutral
**Idea:** Aussie looks shaky — and USD weakness isn’t enough to carry it higher right now
---
### **💡 Why Sell?**
**🇦🇺 AUD Struggling:**
* RBA cut rates to 3.85% and left the door wide open for more 🔓
* China slowdown = bad news for Aussie’s export-linked economy 🐉📉
* Mixed commodity prices (iron ore stable, but others lagging) = no strong support 🛢️⛏️
* Market leaning bearish — rising net shorts and soft sentiment 🧊
**🇺🇸 USD Weak But Still Present:**
* Fed is pausing, not panicking — still no full shift to dovish 🧘
* Real yields down, but not crashing → USD not collapsing 💵
* Safe-haven demand quiet but intact = mild USD cushion 🛡️
---
### **📊 Technical Feel (Not Precise Levels, Just Chart Logic):**
* **Lower highs forming:** Price keeps failing to make new pushes up — structure bending 🧱
* **Weak rallies:** Bulls trying, but no follow-through — candles fading fast 🎈
* **Price hovering near a breakdown zone:** Feels like a floor’s about to give way ⛳
* **Momentum flattening:** RSI & MACD both soft — energy’s draining ⬇️
* **Small body candles stacking:** Choppy indecision = no conviction from buyers 📉
* **Volume light on up-moves:** Nobody’s chasing — a bad sign for continuation 📭
---
### **⚠️ Invalidation Clue:**
> If bulls step in hard with strong green candles and wide ranges → stand aside 📛
> But unless they do, short-term drift lower looks more likely
---
### **🎯 Summary:**
AUDUSD looks unmotivated. AUD is soft across the board, and USD doesn’t need to be strong to take advantage.
If momentum stays weak, this pair likely **grinds lower** before finding any real support.

AudUsd Trade IdeaAU is currently bearish on higher time frames with smaller time frames still respecting a Lower High. If price can give the pullback to retest the LH then we could expect price to continue with bearish structures where a 1:3rr could come into play. We could even expect price to tap back into the previous low or even hit the level I have marked below. We'll see what happens.

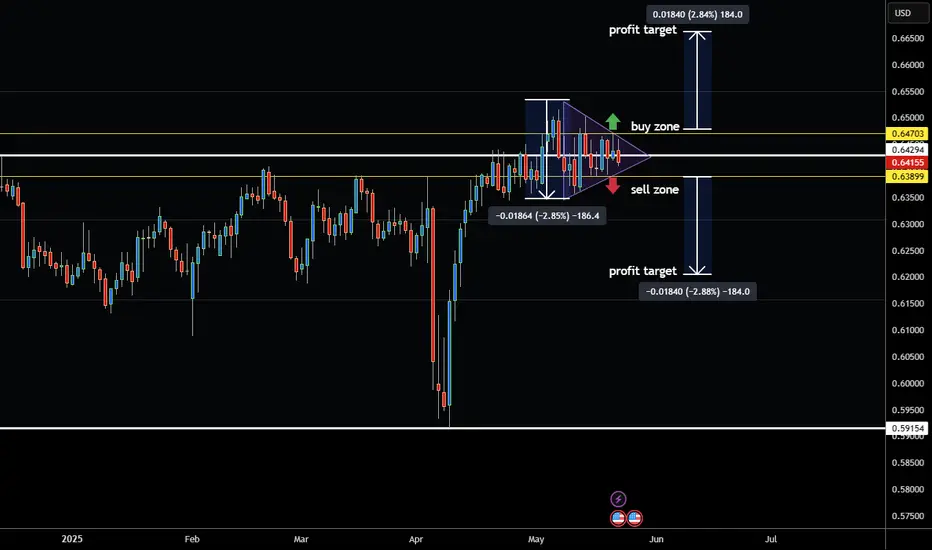
Australian Dollar Consolidation Which Way From Here?Hey traders so today we are going to look at the Austrailian Dollar which is now in chart pattern called a Symetrical Triangle.
So how do we know which way to trade the market right now?
We don't so why guess when instead we can wait for the market to confirm which way it wants to go.
These are normally known as a consolidation patterns, and normally they can break out in the direction of the prevailing trend which appears to be bullish. However they can also break against the trend so the best way to trade it is watch which side it breaks then place an order to enter on the side that market breaks out of. The the other side can then become your stop loss because most likely the market won't go to the other side.
For profit target you can measure the distance of the triangle from top to bottom so in this example 183 pips or ticks.
Always use Risk Management! (just in case your wrong in your analysis)
Hope This Helps Your Trading
Clifford
AUDUSD SETUPWe will enter the given setup .
Watch for market shift on LTF for confirmation entry .
Please follow to support me !
Very Great Short!Hello All. As I told you before( in very Higher TF analysis) market would collapse soon. Now it is time to go to a lower time frame and catch the market with 30 R:R ratio. and I wanna tell you after ending the war between Israel and Iran (and Victory of Iran for sure), Market will be accelerate falling. be happy and have a great time(wink)

AUDUSD likely to reach level 0.64267AUDUSD is in uptrend and might have a pullback. AUDUSD likely to reach level 0.64267
This analysis is for educational purpose only. Not an investment or financial advise.

AUD/USD SELLERS WILL DOMINATE THE MARKET|SHORT
Hello, Friends!
AUD/USD pair is trading in a local uptrend which we know by looking at the previous 1W candle which is green. On the 1D timeframe the pair is going up too. The pair is overbought because the price is close to the upper band of the BB indicator. So we are looking to sell the pair with the upper BB line acting as resistance. The next target is 0.636 area.
Disclosure: I am part of Trade Nation's Influencer program and receive a monthly fee for using their TradingView charts in my analysis.
✅LIKE AND COMMENT MY IDEAS✅

AUDUSD Analysis – Falling from the Rising WedgeAUDUSD pair broke below an ascending wedge, a bearish reversal pattern.
Clean rejection from 0.6518, with lower highs and new lower lows confirming bearish momentum.
Price is now sitting below former trendline support, retested and respected as resistance.
Bearish target points toward 0.6400–0.6380 zone, aligning with recent swing lows.
Risk invalidation sits above 0.6520, where structure fails.
Technical Bias: Bearish
Target: 0.6400
Stop-loss zone: Above 0.6520
📊 Current Bias: Bearish
🔍 Key Fundamentals Driving AUDUSD
AUD Fundamentals (Weakening):
Australian jobs data was mixed, and wage growth has plateaued.
RBA remains cautious, with expectations for rate cuts later in 2025.
AUD pressured by China growth risks and weak commodity demand.
Geopolitical drag: Australia-China tensions and weak Chinese retail data from 618 Festival dampen AUD outlook.
USD Fundamentals (Resilient):
USD remains bid on risk-off flows, especially after weak global data and ongoing Middle East tensions.
Fed remains reluctant to cut fast despite disinflation signs – supports the USD.
US data is mixed, but rate cut odds are declining (only one expected in 2025 now per dot plot).
⚠️ Risks to This Bearish View
If China announces new stimulus, AUD could rebound sharply.
A dovish surprise from the Fed (e.g. Powell softening in speeches).
Sharp rebound in risk appetite (e.g. tech-led equity rally).
🗓️ Important Events to Watch
🇨🇳 China industrial profits & PMIs
🇦🇺 RBA Meeting Minutes (July preview hints)
🇺🇸 US Core PCE (June 28)
Global risk tone: watch metals, equities, and geopolitical headlines.
🚀 Which Asset Leads?
AUDUSD is lagging other USD pairs, but will likely lead commodity FX downside if China or metals weaken further.
Watch AUDJPY and EURAUD for further confirmation of risk-off flows and Aussie weakness.


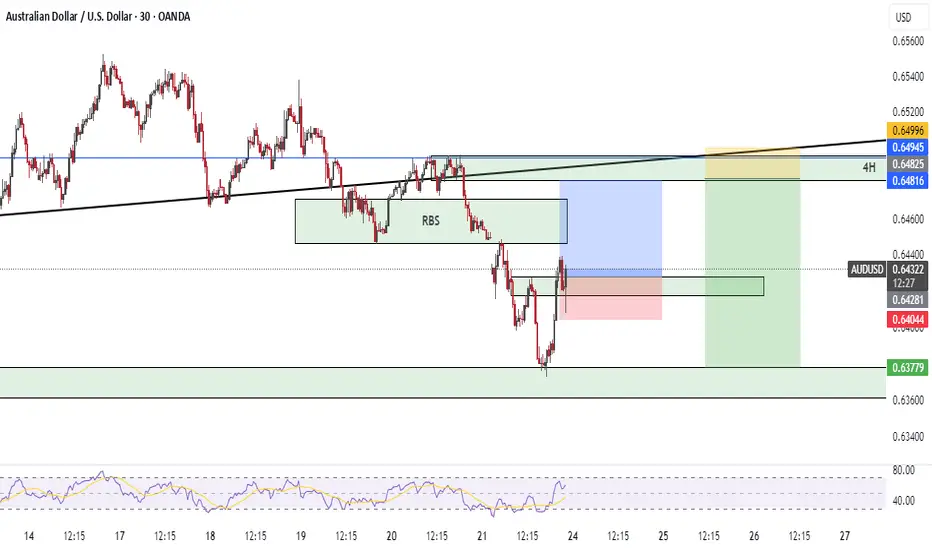
Looking To Sell AUD/USD Into 4h Supply ZoneThe market structure on AUD/USD shifted bearish last week as it created successive lower lows ah lower highs, from the 4H timeframe, we see price headed towards an area of supply.
PLAN
1. Wait for retest of Friday's lower high with candlestick confirmation to short into supply
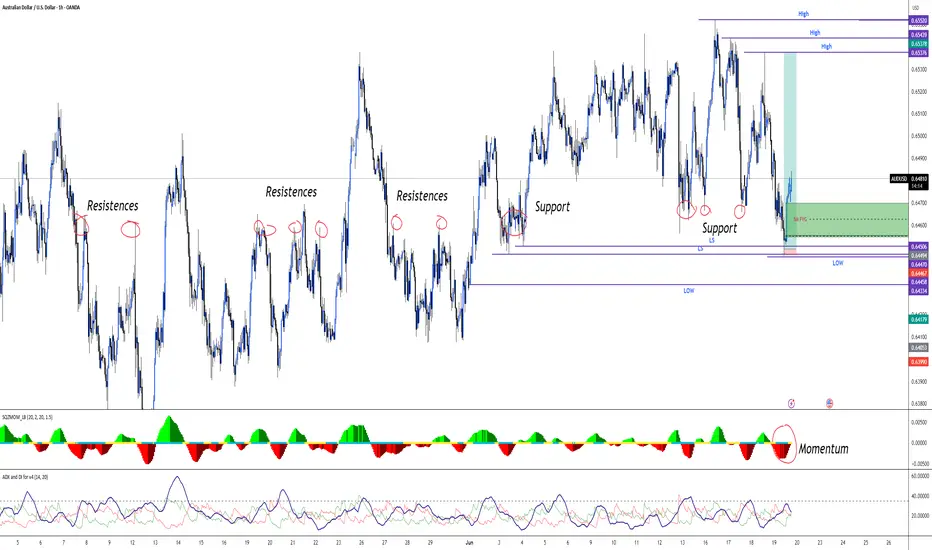
Institutional Manipulation or Perfect Setup? | AUDUSD🎯 This is a 🔥 setup no one’s talking about...
AUDUSD is quietly setting up for something big, and if we apply the VEP Trader – Liquidity Option Strategy, it could deliver a clean high-probability entry.
📍 Trend Overview (1D)
On the daily timeframe, AUDUSD shows a weak bullish trend, but here's what stands out...
The candle on June 18 swept liquidity from 5 previous days:
📅 June 3
📅 June 4
📅 June 13
📅 June 17
📅 June 18
This is a textbook case of institutional liquidity grab. 😮
💧 What Does VEP Trader Tell Us?
When price clears multiple daily lows/highs in a single candle, our strategy flags it as a potential reversal zone.
📸 If you switch to the 1-hour timeframe, you’ll notice something massive:
A huge institutional gap from 0.64554 to 0.64700, exactly where price left behind liquidity.
🚨 What Are We Watching For?
We’re looking for a potential pullback into that gap, alongside:
A bullish divergence on momentum
Support zones holding from previous reactions
Confirmation via Squeeze Momentum
If these align... the opportunity is 🔥.
🎯 Do You See What I See?
👉 Was this manipulation, or just clean price action?
Drop your thoughts in the comments.
Setups like this don’t show up every day — but when they do, you better be ready.
#AUDUSD
#VEPTrader
#LiquiditySweep
#FairValueGap
#SmartMoneyConcepts
#ForexSetup
#PriceActionTrading
#InstitutionalTrading
#CleanStructure
#ForexWatchlist
#GapTrading
#TradingBreakdown
#MomentumDivergence
#RiskRewardRatio
#TradeWhatYouSee
#LiquidityZones
#ForexReversal
#SqueezeMomentum
#TechnicalAnalysis
#ForexOpportunities
#ReversalTrade
#ScalpingSetup
#DayTradingForex
#ForexStrategy
#ForexTraderLife
The US dollar decline is a massive opportunity Hey all,
just a thesis i've had for a while now and there is many charts and data points ive used to get confidence in this. Short term I see the AUD decreasing on the lower demand for out exports (iron, coal, copper), Also house I see an economic contraction likely as house prices have already priced out many and borrowing cost are still elevated from the pandemic lows. With the uncertainty of a possible trade wars, military wars and energy prices i dont see the RBA or Fed lowering rates to what the market is expecting. This will also help the short term decline of the AUD. But once more clarity, economic activity picks up and stimulus either from the fed lowering rates and/or government spending more to keep voters this will fundamentally show the over supply of USD. After all recessions and then subsequent stimulus the USD rises for the crisis and then declines for the next 2 years on Average I see the same playing out but most likely to an even greater scale given the major over supply and focus on the USD.

AUD/USD: The Clearest Short Opportunity This WeekThis week, the macro and market landscape provides a rare alignment across all major models—making AUD/USD the standout short opportunity among G10 FX pairs.
Key Reasons for the Bearish AUD/USD Bias:
1. Commitment of Traders (COT):
Institutional positioning has turned decisively bearish on the Australian dollar, with net shorts increasing and sentiment remaining negative.
2. Z-Score & Positioning Extremes:
Z-Score indicators confirm a below-average long bias for AUD, highlighting that recent speculative flows are heavily skewed to the short side.
3. EXO/Score Model:
Our EXO (macro scoring) model gives AUD/USD a clear SHORT rating, with no offsetting bullish factors in the “core” or “risk/reward” signals.
4. Commodity Edge – Iron Ore:
Iron ore prices, a crucial driver for AUD, have sharply declined in recent weeks. This is a classic “canary in the coal mine” for AUD weakness historically, persistent iron ore declines precede broader AUD selloffs.
5. Sentiment & Risk Environment:
Despite global “risk-on” sentiment, AUD is unable to benefit, as both macro and market participants rotate away from commodity FX and into USD strength.
6. Endo (Fundamental) Model:
While Australia’s macro data still looks solid on a lagging basis, all faster models (positioning, flows, sentiment, commodities) point to an imminent shift typically, ENDO lags in catching turning points.
Conclusion & Tactical View:
SHORT AUD/USD is the highest conviction trade for this week, backed by full alignment of macro, positioning, sentiment, and real-economy factors.
Expect continued downside pressure while commodity markets and COT data remain bearish.
For active traders, the first 3–7 days following this setup historically provide the highest reward-to-risk moves.

Could the Aussie bounce from here?The price is falling towards the pivot and could bounce to the 1st resistance.
Pivot: 0.6410
1st Support: 0.6344
1st Resistance: 0.6539
Risk Warning:
Trading Forex and CFDs carries a high level of risk to your capital and you should only trade with money you can afford to lose. Trading Forex and CFDs may not be suitable for all investors, so please ensure that you fully understand the risks involved and seek independent advice if necessary.
Disclaimer:
The above opinions given constitute general market commentary, and do not constitute the opinion or advice of IC Markets or any form of personal or investment advice.
Any opinions, news, research, analyses, prices, other information, or links to third-party sites contained on this website are provided on an "as-is" basis, are intended only to be informative, is not an advice nor a recommendation, nor research, or a record of our trading prices, or an offer of, or solicitation for a transaction in any financial instrument and thus should not be treated as such. The information provided does not involve any specific investment objectives, financial situation and needs of any specific person who may receive it. Please be aware, that past performance is not a reliable indicator of future performance and/or results. Past Performance or Forward-looking scenarios based upon the reasonable beliefs of the third-party provider are not a guarantee of future performance. Actual results may differ materially from those anticipated in forward-looking or past performance statements. IC Markets makes no representation or warranty and assumes no liability as to the accuracy or completeness of the information provided, nor any loss arising from any investment based on a recommendation, forecast or any information supplied by any third-party.
