AUDUSD 4hour TF - July 6th, 2025AUDUSD 7/6/2025
AUDUSD 4hour Neutral idea
Monthly - Bearish
Weekly - Bearish
Dailly - Bullish
4hour - Ranging
We are still technically bullish overall but we can see here on the 4hour that AU is ranging between 0.65800 & 0.65500. This is a fairly small range so we’re not that interested in taking trades while price action is bouncing between these two zones.
We’re looking for conviction above 0.65800 or below 0.65500 before we can comfortably make a move. Let’s see what both of those situations would look like:
Bullish Continuation - Most of the trend data is suggesting AU is still bullish but we would need to see a strong push above resistance around 0.65800 with a confirmed higher low above before getting into any trades. If we do see this play out I'm looking toward 0.66750 resistance as a target.
Reversal back into channel - Price action seems to be poking out of the bottom of this range but we are still not convinced just yet. For us to strongly consider this a bearish move we would like to see a retest of 0.65500 as resistance followed by bearish conviction. Look for price action to move lower toward key support areas if this happens.
AUDUSD trade ideas

AUDUSD Selling Trading IdeaHello Traders
In This Chart AUDUSD HOURLY Forex Forecast By FOREX PLANET
today AUDUSD analysis 👆
🟢This Chart includes_ (AUDUSD market update)
🟢What is The Next Opportunity on AUDUSD Market
🟢how to Enter to the Valid Entry With Assurance Profit
This CHART is For Trader's that Want to Improve Their Technical Analysis Skills and Their Trading By Understanding How To Analyze The Market Using Multiple Timeframes and Understanding The Bigger Picture on the Chart

AUDUSD SHORT & LONG FORECAST Q3 D11 W28 Y25AUDUSD SHORT & LONG FORECAST Q3 D11 W28 Y25
It’s Fun Coupon Friday! 💸🔥
Professional Risk Managers👋
Welcome back to another FRGNT chart update📈
Diving into some Forex setups using predominantly higher time frame order blocks alongside confirmation breaks of structure.
Let’s see what price action is telling us today! 👀
💡Here are some trade confluences📝
✅Daily Order block identified
✅4H Order Block identified
✅1H Order Block identified
🔑 Remember, to participate in trading comes always with a degree of risk, therefore as professional risk managers it remains vital that we stick to our risk management plan as well as our trading strategies.
📈The rest, we leave to the balance of probabilities.
💡Fail to plan. Plan to fail.
🏆It has always been that simple.
❤️Good luck with your trading journey, I shall see you at the very top.
🎯Trade consistent, FRGNT X

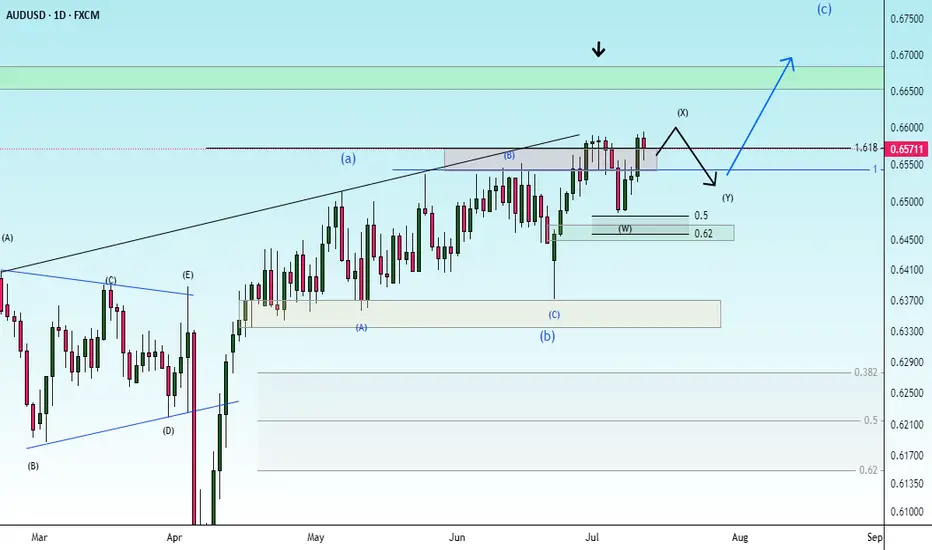
possibility of uptrendThe correction is expected to move in the specified direction and the correction pattern is completed. Then, we are expected to see the start of the upward trend.
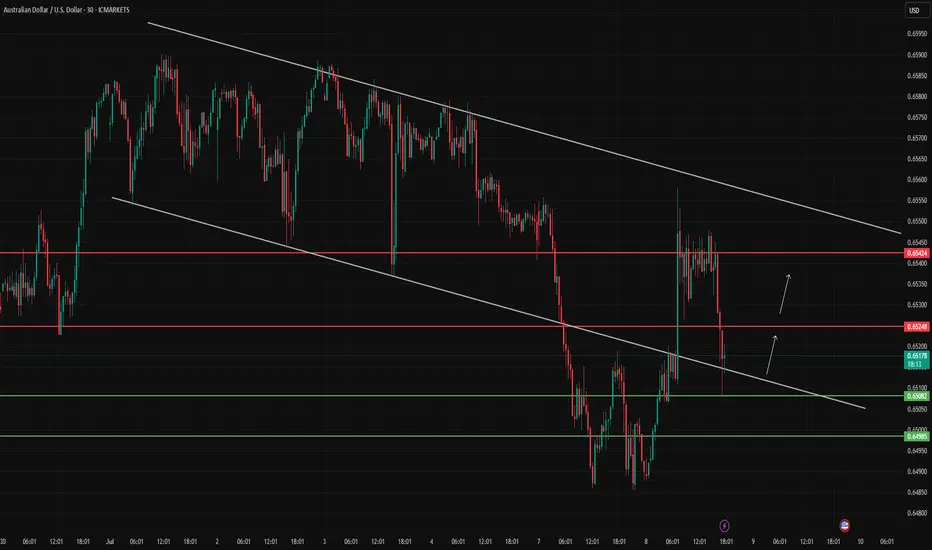
AUDUSD – Watching for a Channel ReboundAUDUSD is testing key support at the lower boundary of the descending channel. Eyes on 0.65248 and 0.65424 as potential rebound targets.
Australian dollar eyes China GDPThe Australian dollar has edged lower on Monday. In the North American session, AUD/USD is trading at 0.6555, down 0.32% on the day. The Aussie took advantage of US dollar weakness last week as it touched a high of 0.6593, its highest level since November 2024.
China's economy is expected to have grown by 5.1% in the second quarter, after back-to-back quarters of gains of 5.4%. The government's annual growth target is around 5.0%, and policymakers won't complain if this target is exceeded for a third consecutive quarter.
China's exports were up 5.8% y/y in June, above the consensus of 5.0% and well above the May gain of 4.8%. The jump in exports was driven by a trade truce with the US that lowered tariffs on Chinese goods from 145% to 55%. Still, the economic picture is uncertain as the tariff truce ends in August.
China will also release industrial production and retail sales for June, with the markets forecasting weaker numbers. Industrial production, which has been decelerating in recent months, is expected to ease to 5.6% from 5.8%, while retail sales are expected to fall to 5.6%, down from 6 .4% in May, which was the strongest level since December 2023.
Australia releases Westpac Consumer Sentiment on Tuesday, with a forecast of a 0.4% gain for July . This follows a 0.4% gain in June. Consumers remain cautious, despite the Reserve Bank of Australia's rate cut in May and lower inflation.
The RBA shocked the markets last week when it maintained the cash rate at 3.85%, as all signs appeared to point to a quarter-point cut. The RBA meets next on August 12.
AUD/USD is testing support at 0.6562. Below, there is support at 0.6550
There is resistance at 0.6570 and 0.6582

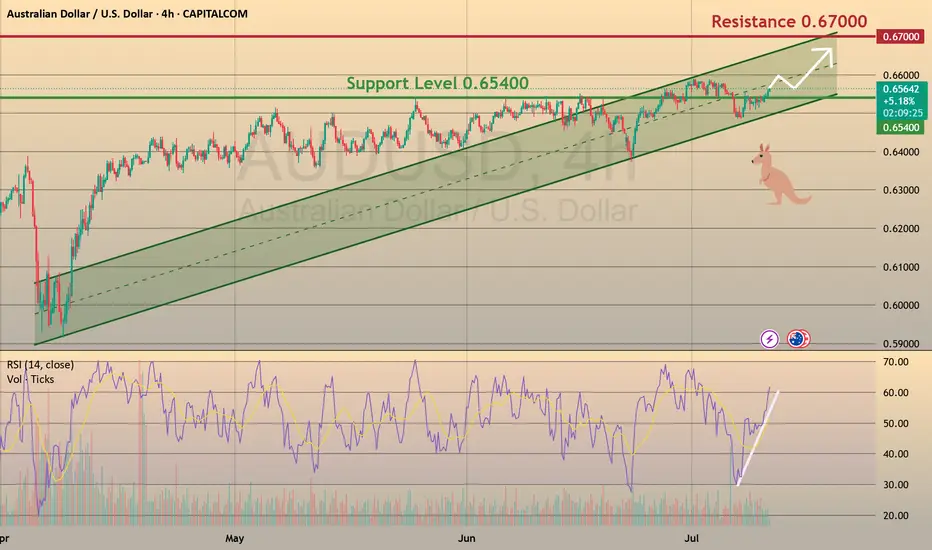
Aussie: Still Growing!
CAPITALCOM:AUDUSD
The bullish momentum continues after our last successful AUDUSD setup, and a move toward the 0.65900 resistance area looks probable now.
🪙 My Trading Plan:
🔼 BUY Stop: 0.65648
❌ Stop Loss: 0.65320
✅ Take Profit: 0.65965
💡 Why am I buying here?
✅ Price broke recent resistance at 0.65500, activating buy trades.
✅ RSI confirm ongoing bullish momentum 📊.
📰 Fundamental Situation:
🏦 RBA Rate Decision Supports AUD
The Reserve Bank of Australia (RBA) surprised markets by holding rates steady at 3.85% 🏛️, diverging from expectations of a cut. This cautious stance reflects the RBA’s preference to wait for clearer signs of slowing inflation 📉 before adjusting policy further.
Governor Michele Bullock emphasized that inflation risks remain persistent ⚠️, driven by high labor costs and weak productivity, possibly requiring a longer period of restrictive policy ⏳. Deputy Governor Andrew Hauser noted the bank is closely monitoring global risks 🌐, especially US tariff developments, underscoring sensitivity to global headwinds that could impact trade and growth 📦.
🌎 Trade Tensions in Focus:
President Trump ruled out extending tariff deadlines beyond August 1 ⛔, announcing new duties:
🔹 50% on copper 🪙
🔹 Potential 200% on pharmaceuticals 💊
🔹 10% on goods from BRICS 🌐
These moves are likely to intensify global trade tensions ⚔️, potentially impacting commodity flows and inflation, which the RBA and markets will continue to monitor closely.
AUDUSD SHORT & LONG – WEEKLY FORECAST Q3 | W 29 | Y25💼 AUDUSD SHORT & LONG – WEEKLY FORECAST
Q3 | W 29 | Y25
📊 MARKET STRUCTURE OVERVIEW
AUDUSD is currently trading around a previously mitigated Daily and 4H Order Block zone.
Price has shown signs of short-term bearish momentum on lower timeframes (1H & 15m), but the broader structure still allows for bullish re-entries from deeper discounted levels.
We’re entering a key decision zone with potential for both short and long opportunities, depending on intraday confirmation.
🔍 Confluences to Watch 📝
✅ Daily OB – Previously Mitigated
Larger structure still holds room for bullish continuation if key internal supports hold.
✅ 4H OB – Mitigated with Initial Rejection
✅ 1H & 15m OBs – Valid for Intraday Shorts
Clean bearish structure on intraday timeframes.
Potential shorts available
📈 Risk Management Protocols
🔑 Core Principles
Risk per trade: Max 1%
Only act at planned levels — never chase
RR minimum: 1:2
Use scaling techniques on intraday shorts, and hold conviction for swings when structure confirms
🧠 Your risk plan is your protection. Without it, your strategy is meaningless.
🧠 Weekly FRGNT Insight
“Bias is flexible. Discipline is not.”
Adapt to what price gives — but never abandon your risk framework.
🏁 Final Thoughts from FRGNT
📌 Both short and long opportunities are valid this week.
📌 Choose your bias based on structure + confirmation.
📌 Let the order flow lead and risk management guide.
❤️ Stay sharp, stay structured. I’ll see you at the very top.
🎯 Trade consistent. FRGNT X

AUDUSD: Short Setup Ahead of Key Data OANDA:AUDUSD
AUDUSD is hovering near a rising trendline, with price action compressing and signaling a potential downside break in the coming sessions.
Just above, the 0.65900 resistance zone has capped recent rallies, and the pair’s failure to clear this level strengthens the case for a reversal.
Later today, we will see Westpac Consumer Confidence data for Australia, which could act as a catalyst for a sharp move. A weaker-than-expected print would likely pressure the Aussie further.
📋 Entry Checklist:
✅ Testing rising trendline, signaling potential breakdown
✅ Strong resistance at 0.65900 holding rallies
✅ Key consumer sentiment data could trigger volatility
📈 Trade Plan:
🔻 Sell Entry: 0.65600
❌ Stop Loss: 0.66200
✅ Take Profit: 0.65000
(Tap 👉 Trade Now 👈 on mobile to copy SL & TP easily)
📰 Fundamental Snapshot:
The Reserve Bank of Australia (RBA) surprised markets by holding rates steady at 3.85%, diverging from expectations of a potential cut. The RBA remains cautious amid persistent inflation risks driven by high labor costs and weak productivity, suggesting rates may stay restrictive longer.
Governor Michele Bullock highlighted that inflation could remain above forecasts, while Deputy Governor Andrew Hauser emphasized monitoring global uncertainties, including U.S. tariff developments, reflecting the RBA’s sensitivity to external headwinds impacting growth and trade.

FULL BACK SUPPORT LEVEL 📉 AUDUSD – Potential Rebound from Key Support
Price is currently responding to a well-established horizontal support level, indicating a possible short-term bullish retracement.
The appearance of a bullish imbalance candle on the 1-hour timeframe further strengthens the case for a recovery move.
🎯 Target: 0.658
🕐 Timeframe: 1H
📌 Outlook: Short-term Bullish

AUDUAD CONTINUE BULLISHTechnically:
AUDUSD Printing bullish flag
AUDUSD Printed it's HL at fib 0.5
AUDUSD no bearish divergence
Take entry when it break it's last HH and pole.
Must manage your riske .

Australian dollar stabilizes after RBA's surpriseThe Australian dollar is in positive territory after a three-day skid, declining 1.5%. In the North American session, AUD/USD is trading at 0.6532, up 0.50% on the day. The Australian dollar rose as much as 0.95% earlier before retreating.
The Reserve Bank of Australia blindslided the markets on Tuesday as the central bank held the cash rate at 3.85%. The markets had priced in a quarter-point cut at 96%, but the RBA had the last laugh. For the first time, the RBA published the vote tally, which was 6-3 in favor of maintaining the rate.
The rate statement was cautious, as members said "there are uncertainties about the outlook for domestic economic activity and inflation".
Governor Bullock tried to calm the markets, saying that the decision was about "timing rather than direction" and that the Bank would "wait a few weeks" to confirm that inflation was on track to ease and remain sustainably around 2.5%. Bullock said that "we don't want to end up having to fight inflation again".
Inflation is moving in the right direction but the RBA wants to see the second-quarter inflation report on July 30, ahead of the rate decision on Aug. 12. Headline CPI in May eased to 2.1% y/y from 2.4% in April. The core rate dropped to 2.8% from 2.4% in April, the lowest rate since early 2022.
The RBA will be hoping that waiting till August will provide some clarity with regard to US tariff policy. President Trump has pledged new tariffs against various countries but this move is not expected to have much impact on Australia's economy.
AUD/USD is testing resistance at 0.6513. Above, there is resistance at 0.6541
There is support at 0.6463 and 0.6435

AUDUSD SHORT & LONG FORECAST Q3 W28 Y25AUDUSD SHORT & LONG FORECAST Q3 W28 Y25
Professional Risk Managers👋
Welcome back to another FRGNT chart update📈
Diving into some Forex setups using predominantly higher time frame order blocks alongside confirmation breaks of structure.
Let’s see what price action is telling us today! 👀
💡Here are some trade confluences📝
✅Daily Order block identified
✅4H Order Block identified
✅1H Order Block identified
🔑 Remember, to participate in trading comes always with a degree of risk, therefore as professional risk managers it remains vital that we stick to our risk management plan as well as our trading strategies.
📈The rest, we leave to the balance of probabilities.
💡Fail to plan. Plan to fail.
🏆It has always been that simple.
❤️Good luck with your trading journey, I shall see you at the very top.
🎯Trade consistent, FRGNT X

AUDUSD - RBA Rate Cut and Tariff Deadline in FocusIn a week that is light on economic data and events, with a heavy emphasis towards what happens next once President Trump’s 90-day tariff pause ends on Wednesday (July 9th), the AUDUSD currency pair has more than most for traders to focus on.
This is due to the fact the RBA, the Australian central bank, decides early Tuesday morning (0530 BST) whether to cut interest rates for the third time in a row from 3.85% to 3.6%, as is widely expected by markets, given that inflation has eased in recent months back into the RBA’s 2-3% target range. This announcement is closely followed by the RBA press conference (0630 BST), which could also be an important influence on the direction of AUDUSD depending on the comments Governor Bullock makes regarding future rate moves, economic growth and tariffs.
In terms of trade tariffs, President Trump last week suggested that he is unlikely to extend the 90 day pause, although he has changed his mind before. He also indicated that letters are being sent to trading partners outlining tariffs of between 10-70% on imports depending on whether he believes the country has been negotiating in good faith or not. These new tariffs are due to go into force on August 1st, so there is potentially still time for more twists and turns in this story and AUDUSD volatility may well increase across the trading week ahead as it plays out.
AUDUSD touched an 8 month high at 0.6590 last Tuesday (July 1st) before running into a wall of profit taking and eventually closing the week at 0.6550. Given the risk events facing traders that were just outlined above, this type of price action may not be that surprising.
Looking at how this week has started for AUDUSD, early trading in Asia has seen fresh selling to potential support around 0.6500 (see technical update below), which at the time of writing (0730 BST), is still holding, although bounces have so far been limited.
Technical Update: Preparing For The Week Ahead
With potential for a rate cut in Australia and concerns over tariff news this week, it perhaps isn’t too much of a surprise AUDUSD price corrections are materialising as a reaction to recent strength. While this decline may continue over the short term, traders are perhaps more focused on the potentially positive pattern of higher price highs and higher price lows that have materialised since April 9th 2025, which the chart below shows.
Of course, there is no guarantee this pattern will continue over coming sessions but being aware of support and resistance levels that may hold or exaggerate future price moves may be useful to know in advance.
Potential Support Levels:
After price strength, especially if new recovery highs within an uptrend pattern have been posted, it may prove to be Fibonacci retracement levels that act as support to any future price weakness. Calculating these on the period of price strength seen between May 12th up to the July 1st high, the 38.2% retracement level stands at 0.6501.
With the current setback now moving towards 0.6501 this morning, traders may be watching how this potential support level performs on a closing basis, as confirmed breaks lower might lead to a more extended phase of weakness that could prompt tests of 0.6473, the 50% retracement, even 0.6446, the deeper 62% retracement level.
Potential Resistance Levels:
Having seen new highs recently posted, which was the highest AUDUSD trade since mid-November 2024 (see the chart below), we can look at the weekly perspective to establish the next possible resistance levels.
As the chart shows, the latest AUDUSD activity has recently tested weekly resistance at 0.6550, which is equal to the 61.8% Fibonacci retracement of September 2024 to April 2025 weakness. It should be noted, in a similar way to last week, that it is possible AUDUSD may see trading activity above this 0.6550 resistance, but as we are using a weekly timeframe, it is this upcoming Friday's weekly close above this level that is required to suggest possibilities of a successful upside closing break.
Much will depend on future market sentiment and price trends, but weekly closes above 0.6550 if seen, may lead to further price strength towards 0.6688, the November 2024 high.
The material provided here has not been prepared accordance with legal requirements designed to promote the independence of investment research and as such is considered to be a marketing communication. Whilst it is not subject to any prohibition on dealing ahead of the dissemination of investment research, we will not seek to take any advantage before providing it to our clients.
Pepperstone doesn’t represent that the material provided here is accurate, current or complete, and therefore shouldn’t be relied upon as such. The information, whether from a third party or not, isn’t to be considered as a recommendation; or an offer to buy or sell; or the solicitation of an offer to buy or sell any security, financial product or instrument; or to participate in any particular trading strategy. It does not take into account readers’ financial situation or investment objectives. We advise any readers of this content to seek their own advice. Without the approval of Pepperstone, reproduction or redistribution of this information isn’t permitted.

Week of 7/13/25: AUDUSD AnalysisLast week pushed bullish and demand is still in control on all time frames, so we are going to follow bullish order flow.
Looking for bottom liquidity to be taken in the local range before getting in on a long.
Major News:
Tuesday - CPI
Wednesday - PPI
Thursday - Unemployment

Australian dollar stabilizes after RBA's surprise The Australian dollar is in positive territory after a three-day skid, declining 1.5%. In the North American session, AUD/USD is trading at 0.6532, up 0.50% on the day. The Australian dollar rose as much as 0.95% earlier before retreating.
The Reserve Bank of Australia blindslided the markets on Tuesday as the central bank held the cash rate at 3.85%. The markets had priced in a quarter-point cut at 96%, but the RBA had the last laugh. For the first time, the RBA published the vote tally, which was 6-3 in favor of maintaining the rate.
The rate statement was cautious, as members said "there are uncertainties about the outlook for domestic economic activity and inflation".
Governor Bullock tried to calm the markets, saying that the decision was about "timing rather than direction" and that the Bank would "wait a few weeks" to confirm that inflation was on track to ease and remain sustainably around 2.5%. Bullock said that "we don't want to end up having to fight inflation again".
Inflation is moving in the right direction but the RBA wants to see the second-quarter inflation report on July 30, ahead of the rate decision on Aug. 12. Headline CPI in May eased to 2.1% y/y from 2.4% in April. The core rate dropped to 2.8% from 2.4% in April, the lowest rate since early 2022.
The RBA will be hoping that waiting till August will provide some clarity with regard to US tariff policy. President Trump has pledged new tariffs against various countries but this move is not expected to have much impact on Australia's economy.
AUD/USD is testing resistance at 0.6513.
Above, there is resistance at 0.6541
There is support at 0.6463 and 0.6435

Surprise halt by the RBA. A positive for the AUD.After a surprise halt by the RBA, where the Bank kept the cash rate unchanged, MARKETSCOM:AUDUSD reversed sharply higher. Where it may go next? Let's dig in.
FX_IDC:AUDUSD
Let us know what you think in the comments below.
Thank you.
77.3% of retail investor accounts lose money when trading CFDs with this provider. You should consider whether you understand how CFDs work and whether you can afford to take the high risk of losing your money. Past performance is not necessarily indicative of future results. The value of investments may fall as well as rise and the investor may not get back the amount initially invested. This content is not intended for nor applicable to residents of the UK. Cryptocurrency CFDs and spread bets are restricted in the UK for all retail clients.

Bearish drop?AUD/USD has rejected off the pivot which lines up with the 61.8% Fibonacci retracement and could drop to the 1st support, which is a pullback support.
Pivot: 0.6558
1st Support: 0.6409
1st Resistance: 0.6647
Risk Warning:
Trading Forex and CFDs carries a high level of risk to your capital and you should only trade with money you can afford to lose. Trading Forex and CFDs may not be suitable for all investors, so please ensure that you fully understand the risks involved and seek independent advice if necessary.
Disclaimer:
The above opinions given constitute general market commentary, and do not constitute the opinion or advice of IC Markets or any form of personal or investment advice.
Any opinions, news, research, analyses, prices, other information, or links to third-party sites contained on this website are provided on an "as-is" basis, are intended only to be informative, is not an advice nor a recommendation, nor research, or a record of our trading prices, or an offer of, or solicitation for a transaction in any financial instrument and thus should not be treated as such. The information provided does not involve any specific investment objectives, financial situation and needs of any specific person who may receive it. Please be aware, that past performance is not a reliable indicator of future performance and/or results. Past Performance or Forward-looking scenarios based upon the reasonable beliefs of the third-party provider are not a guarantee of future performance. Actual results may differ materially from those anticipated in forward-looking or past performance statements. IC Markets makes no representation or warranty and assumes no liability as to the accuracy or completeness of the information provided, nor any loss arising from any investment based on a recommendation, forecast or any information supplied by any third-party.

AUDUSD SHORT & LONG DAILY FORECAST Q3 D7 W28 Y25AUDUSD SHORT & LONG DAILY FORECAST Q3 D7 W28 Y25
Professional Risk Managers👋
Welcome back to another FRGNT chart update📈
Diving into some Forex setups using predominantly higher time frame order blocks alongside confirmation breaks of structure.
Let’s see what price action is telling us today! 👀
💡Here are some trade confluences📝
✅Daily Order block identified
✅4H Order Block identified
✅1H Order Block identified
🔑 Remember, to participate in trading comes always with a degree of risk, therefore as professional risk managers it remains vital that we stick to our risk management plan as well as our trading strategies.
📈The rest, we leave to the balance of probabilities.
💡Fail to plan. Plan to fail.
🏆It has always been that simple.
❤️Good luck with your trading journey, I shall see you at the very top.
🎯Trade consistent, FRGNT X

Bullish bounce off pullback support?The Aussie (AUD/USD) is falling towards the pivot which acts as a pullback support and could bounce to the 1st resistance.
Pivot: 0.6423
1st Support: 0.6328
1st Resistance: 0.6583
Risk Warning:
Trading Forex and CFDs carries a high level of risk to your capital and you should only trade with money you can afford to lose. Trading Forex and CFDs may not be suitable for all investors, so please ensure that you fully understand the risks involved and seek independent advice if necessary.
Disclaimer:
The above opinions given constitute general market commentary, and do not constitute the opinion or advice of IC Markets or any form of personal or investment advice.
Any opinions, news, research, analyses, prices, other information, or links to third-party sites contained on this website are provided on an "as-is" basis, are intended only to be informative, is not an advice nor a recommendation, nor research, or a record of our trading prices, or an offer of, or solicitation for a transaction in any financial instrument and thus should not be treated as such. The information provided does not involve any specific investment objectives, financial situation and needs of any specific person who may receive it. Please be aware, that past performance is not a reliable indicator of future performance and/or results. Past Performance or Forward-looking scenarios based upon the reasonable beliefs of the third-party provider are not a guarantee of future performance. Actual results may differ materially from those anticipated in forward-looking or past performance statements. IC Markets makes no representation or warranty and assumes no liability as to the accuracy or completeness of the information provided, nor any loss arising from any investment based on a recommendation, forecast or any information supplied by any third-party.

Bullish bounce off pullback support?The Aussie (AUD/USD) has bounced off the pivot and could rise to the 1st resistance, which lines up with the 127.2% Fibonacci extension.
Pivot: 0.6567
1st Support: 0.6544
1st Resistance: 0.6603
Risk Warning:
Trading Forex and CFDs carries a high level of risk to your capital and you should only trade with money you can afford to lose. Trading Forex and CFDs may not be suitable for all investors, so please ensure that you fully understand the risks involved and seek independent advice if necessary.
Disclaimer:
The above opinions given constitute general market commentary, and do not constitute the opinion or advice of IC Markets or any form of personal or investment advice.
Any opinions, news, research, analyses, prices, other information, or links to third-party sites contained on this website are provided on an "as-is" basis, are intended only to be informative, is not an advice nor a recommendation, nor research, or a record of our trading prices, or an offer of, or solicitation for a transaction in any financial instrument and thus should not be treated as such. The information provided does not involve any specific investment objectives, financial situation and needs of any specific person who may receive it. Please be aware, that past performance is not a reliable indicator of future performance and/or results. Past Performance or Forward-looking scenarios based upon the reasonable beliefs of the third-party provider are not a guarantee of future performance. Actual results may differ materially from those anticipated in forward-looking or past performance statements. IC Markets makes no representation or warranty and assumes no liability as to the accuracy or completeness of the information provided, nor any loss arising from any investment based on a recommendation, forecast or any information supplied by any third-party.

Could we see bullish continuation?The Aussie (AUD/USD) is reacting off the pivot and could rise to the 1st resistance which aligns with the 161.8% Fibonacci extension.
Pivot: 0.6581
1st Support: 0.6562
1st Resistance: 0.6621
Risk Warning:
Trading Forex and CFDs carries a high level of risk to your capital and you should only trade with money you can afford to lose. Trading Forex and CFDs may not be suitable for all investors, so please ensure that you fully understand the risks involved and seek independent advice if necessary.
Disclaimer:
The above opinions given constitute general market commentary, and do not constitute the opinion or advice of IC Markets or any form of personal or investment advice.
Any opinions, news, research, analyses, prices, other information, or links to third-party sites contained on this website are provided on an "as-is" basis, are intended only to be informative, is not an advice nor a recommendation, nor research, or a record of our trading prices, or an offer of, or solicitation for a transaction in any financial instrument and thus should not be treated as such. The information provided does not involve any specific investment objectives, financial situation and needs of any specific person who may receive it. Please be aware, that past performance is not a reliable indicator of future performance and/or results. Past Performance or Forward-looking scenarios based upon the reasonable beliefs of the third-party provider are not a guarantee of future performance. Actual results may differ materially from those anticipated in forward-looking or past performance statements. IC Markets makes no representation or warranty and assumes no liability as to the accuracy or completeness of the information provided, nor any loss arising from any investment based on a recommendation, forecast or any information supplied by any third-party.

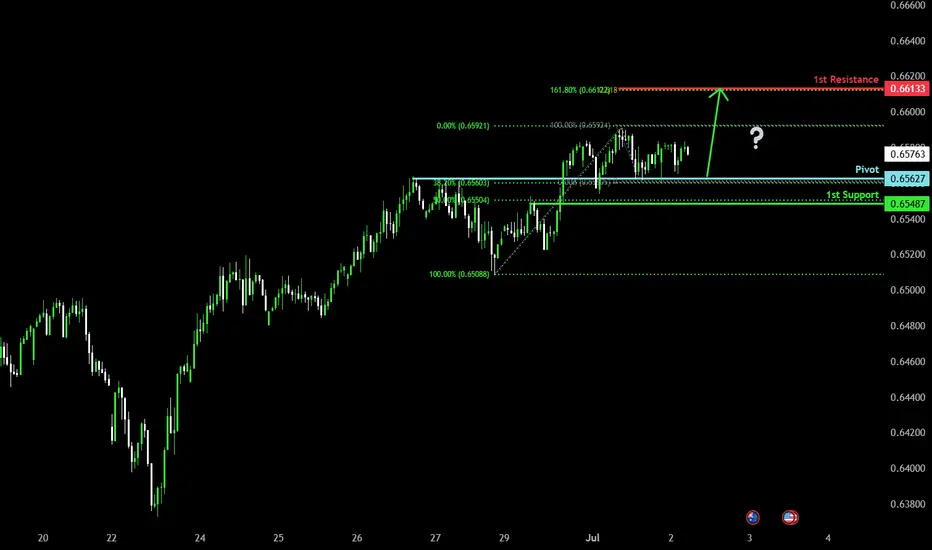
Bullish bounce?The Aussie (AUD/USD) is falling towards the pivot and could bounce to the 1st resistance that aligns with the 161.8% Fibonacci extension and the 61.8% Fibonacci projection.
Pivot: 0.6562
1st Support: 0.6548
1st Resistance: 0.6613
Risk Warning:
Trading Forex and CFDs carries a high level of risk to your capital and you should only trade with money you can afford to lose. Trading Forex and CFDs may not be suitable for all investors, so please ensure that you fully understand the risks involved and seek independent advice if necessary.
Disclaimer:
The above opinions given constitute general market commentary, and do not constitute the opinion or advice of IC Markets or any form of personal or investment advice.
Any opinions, news, research, analyses, prices, other information, or links to third-party sites contained on this website are provided on an "as-is" basis, are intended only to be informative, is not an advice nor a recommendation, nor research, or a record of our trading prices, or an offer of, or solicitation for a transaction in any financial instrument and thus should not be treated as such. The information provided does not involve any specific investment objectives, financial situation and needs of any specific person who may receive it. Please be aware, that past performance is not a reliable indicator of future performance and/or results. Past Performance or Forward-looking scenarios based upon the reasonable beliefs of the third-party provider are not a guarantee of future performance. Actual results may differ materially from those anticipated in forward-looking or past performance statements. IC Markets makes no representation or warranty and assumes no liability as to the accuracy or completeness of the information provided, nor any loss arising from any investment based on a recommendation, forecast or any information supplied by any third-party.