AUDUSD Rejected From Supply Zone – Bearish Slide Incoming?The Aussie dollar (AUDUSD) is showing signs of weakness after repeated rejections at the 0.6470 supply zone. Price has struggled to break this area, forming a solid distribution pattern on the 1H chart. With momentum fading, the pair now looks poised for a potential downside move.
Technical Overview:
Strong Supply Zone: 0.6470 (marked by heavy distribution and LuxAlgo’s visible range)
Current Price: 0.6412
First Target (Support): 0.6221
Second Target (Demand Zone): 0.5986–0.5900
Bias: Bearish unless price breaks and closes above 0.6470 with strength
Confluences Supporting Bearish Outlook:
Prolonged sideways structure near supply = likely distribution
Multiple failed breakout attempts above 0.6470
AUD under pressure from commodity softness + stronger USD
Clean downside levels: 0.6221 (minor support), 0.5986 (major demand)
Trade Setup Idea:
Entry Zone: 0.6410–0.6440 (on rejection candles or breakdown)
Stop Loss: Above 0.6480
Targets:
1. TP1 – 0.6221
2. TP2 – 0.5986
R:R Potential: ~3R if both targets hit
Macro Watch:
Upcoming US data releases could fuel USD strength (FOMC, CPI)
Aussie impacted by China economic data and commodity demand outlook
---
Will AUDUSD collapse from here or surprise us with a breakout? Let me know your outlook in the comments!
---
#AUDUSD #Forex #BearishSetup #TechnicalAnalysis #LuxAlgo #PriceAction #SupplyAndDemand #TrendReversal #SwingTrading #VolumeProfile #USDEvents #ShortTrade
AUDUSD trade ideas

AUD/USD🔹Symbol: AUD/USD
🔹Price: 0.64550
🔹Stop loss: 0.64849
🔹Take profit 1: 0.64217
🔹Take profit 2: 0.63975
🔹Take profit 3: 0.63620
📊Check your chart before entering.
♦️Check before use to make sure there is no important news.

Recap: Predict 3 Pairs!! Today we will be going over the video I made yesterday and we will be looking at the trade I took and other opportunities on the other 2 Piars.

AUDUSD CASH RATE ON FOCUSHi Traders,
Here we looking for some Analysis for incoming cash rate and monetary policy statement on FX:AUDUSD .
The Reserve Bank of Australia is expected to cut interest rates by 25 basis points at its latest meeting from 4.10% previously to 3.85%. The governor's dovish follow-up remarks will weigh on the Aussie dollar.
Have a safe trade!!

AUDUSD BUY NOW!!!!AUDUSD price took out the buyside liquidity with a retest back into the demand zone and price made a sharp liquidity sweep am in now on buy holding till new highs above the BSL is created......
Aussie H4 | Falling toward an overlap supportThe Aussie (AUD/USD) is falling towards an overlap support and could potentially bounce off this level to climb higher.
Buy entry is at 0.6336 which is an overlap support.
Stop loss is at 0.6255 which is a level that lies underneath a pullback support and the 38.2% Fibonacci retracement.
Take profit is at 0.6499 which is a multi-swing-high resistance.
High Risk Investment Warning
Trading Forex/CFDs on margin carries a high level of risk and may not be suitable for all investors. Leverage can work against you.
Stratos Markets Limited (tradu.com):
CFDs are complex instruments and come with a high risk of losing money rapidly due to leverage. 63% of retail investor accounts lose money when trading CFDs with this provider. You should consider whether you understand how CFDs work and whether you can afford to take the high risk of losing your money.
Stratos Europe Ltd (tradu.com):
CFDs are complex instruments and come with a high risk of losing money rapidly due to leverage. 63% of retail investor accounts lose money when trading CFDs with this provider. You should consider whether you understand how CFDs work and whether you can afford to take the high risk of losing your money.
Stratos Global LLC (tradu.com):
Losses can exceed deposits.
Please be advised that the information presented on TradingView is provided to Tradu (‘Company’, ‘we’) by a third-party provider (‘TFA Global Pte Ltd’). Please be reminded that you are solely responsible for the trading decisions on your account. There is a very high degree of risk involved in trading. Any information and/or content is intended entirely for research, educational and informational purposes only and does not constitute investment or consultation advice or investment strategy. The information is not tailored to the investment needs of any specific person and therefore does not involve a consideration of any of the investment objectives, financial situation or needs of any viewer that may receive it. Kindly also note that past performance is not a reliable indicator of future results. Actual results may differ materially from those anticipated in forward-looking or past performance statements. We assume no liability as to the accuracy or completeness of any of the information and/or content provided herein and the Company cannot be held responsible for any omission, mistake nor for any loss or damage including without limitation to any loss of profit which may arise from reliance on any information supplied by TFA Global Pte Ltd.
The speaker(s) is neither an employee, agent nor representative of Tradu and is therefore acting independently. The opinions given are their own, constitute general market commentary, and do not constitute the opinion or advice of Tradu or any form of personal or investment advice. Tradu neither endorses nor guarantees offerings of third-party speakers, nor is Tradu responsible for the content, veracity or opinions of third-party speakers, presenters or participants.

Bullish bounce off 50% Fibonacci support?The Aussie (AUD/USD) is falling towards the pivot, which acts as pullback support and could bounce to the 1st resistance.
Pivot: 0.6426
1st Support: 0.6398
1st Resistance: 0.6468
Risk Warning:
Trading Forex and CFDs carries a high level of risk to your capital and you should only trade with money you can afford to lose. Trading Forex and CFDs may not be suitable for all investors, so please ensure that you fully understand the risks involved and seek independent advice if necessary.
Disclaimer:
The above opinions given constitute general market commentary, and do not constitute the opinion or advice of IC Markets or any form of personal or investment advice.
Any opinions, news, research, analyses, prices, other information, or links to third-party sites contained on this website are provided on an "as-is" basis, are intended only to be informative, is not an advice nor a recommendation, nor research, or a record of our trading prices, or an offer of, or solicitation for a transaction in any financial instrument and thus should not be treated as such. The information provided does not involve any specific investment objectives, financial situation and needs of any specific person who may receive it. Please be aware, that past performance is not a reliable indicator of future performance and/or results. Past Performance or Forward-looking scenarios based upon the reasonable beliefs of the third-party provider are not a guarantee of future performance. Actual results may differ materially from those anticipated in forward-looking or past performance statements. IC Markets makes no representation or warranty and assumes no liability as to the accuracy or completeness of the information provided, nor any loss arising from any investment based on a recommendation, forecast or any information supplied by any third-party.

Aussie Turns Bullish — All Eyes on RBACMCMARKETS:AUDUSD AUD/USD trades near 0.6448 ahead of the RBA rate decision, where a 25bps cut to 3.85% is widely expected. Technically, a breakout above the falling trendline suggests a potential bullish reversal. Immediate support lies at 0.6422–0.6406. A rejection near minor resistance at 0.6456 could trigger a pullback, while a sustained break above that level may open room for gains beyond 0.6500. Market direction hinges on RBA’s tone and Governor Bullock’s guidance on future easing.
Resistance : 0.6456 , 0.6500
Support : 0.6422 , 0.6406

AUDUSD Sell Setup- Go for sell
- Refine entry with smaller SL for better RR, if your strategy allow
- Later AUD news might trigger the move further
"I Found the Code. I Trust the Algo. Believe Me, That’s It."

AUDUSD4hHi traders welcome back
AUDUSD is where we are heading to book our pocket
Don't forget to follow with me and make money

Bearish drop for the Aussie?The price is reacting off the resistace level which is a pullback resistance that lines up with the 61.8% Fibonacci retracement and the 138.2% Fibonacci extension and could potentially drop from this level to our take profit.
Entry: 0.6457
Why we like it:
There is a pullback resistance level that aligns with the 61.8% Fibonacci retracement and the 132.6% Fibonacci extension.
Stop loss: 0.6469
Why we like it:
There is a pullback resistance level.
Take profit: 0.6418
Why we lik eit:
There is a pullback support level that lines up with the 61.8% Fibonacci retracement.
Enjoying your TradingView experience? Review us!
Please be advised that the information presented on TradingView is provided to Vantage (‘Vantage Global Limited’, ‘we’) by a third-party provider (‘Everest Fortune Group’). Please be reminded that you are solely responsible for the trading decisions on your account. There is a very high degree of risk involved in trading. Any information and/or content is intended entirely for research, educational and informational purposes only and does not constitute investment or consultation advice or investment strategy. The information is not tailored to the investment needs of any specific person and therefore does not involve a consideration of any of the investment objectives, financial situation or needs of any viewer that may receive it. Kindly also note that past performance is not a reliable indicator of future results. Actual results may differ materially from those anticipated in forward-looking or past performance statements. We assume no liability as to the accuracy or completeness of any of the information and/or content provided herein and the Company cannot be held responsible for any omission, mistake nor for any loss or damage including without limitation to any loss of profit which may arise from reliance on any information supplied by Everest Fortune Group.

AUD/USD Analysis TodayAustralia's Unemployment Rate Remained Stable in April 📊
May 15 — Data released by the Australian Bureau of Statistics (ABS) showed that after seasonal adjustment, Australia's unemployment rate stayed steady at 4.1% in April 2025 👏. The trend-based unemployment rate also held firm at 4.1%, matching the adjusted figure from March 📈.
Meanwhile, the AUD/USD is currently showing a strong upward trend 🔥, with continued bullish sentiment and a target price of 0.64800 🎯
⚡️⚡️⚡️ AUDUSD ⚡️⚡️⚡️
🚀 Buy@ 0.64400 - 0.64500
🚀 TP 0.64750 - 0.64800
Accurate signals are updated every day 📈 If you encounter any problems during trading, these signals can serve as your reliable guide 🧭 Feel free to refer to them! I sincerely hope they'll be of great help to you 🌟 👇

AUD/USD gearing up for a breakout ahead of RBAThe AUD/USD has been coiling in the last few weeks after making a v-shaped recovery following the tariffs announcement plunge. Is it now ready to finally resume higher?
From a purely technical point of view, the price action looks bullish as it the consolidation below the 200-day moving average and key resistance in the 0.6500 handle suggests price is gearing up for a potentially big breakout. The only issue is that the AUD usually falls when stocks decline, and it is for that reason that we are seeing a bit of hesitation by the by the bulls here.
The other reason could be because of the upcoming rate decision by the Reserve Bank of Australia in the early hours of Tuesday.
Ahead of the RBA rate decision, strong Aussie April job data last week added complexity to the policy outlook with the economy adding 89,000 jobs—well above forecasts—while the unemployment rate held at 4.1%. Despite this, analysts still anticipate another rate cut, following February’s 25 basis point reduction. With inflation stuck at 2.4%, just above the RBA’s 2% target, the bank faces a tricky balancing act.
Meanwhile, the US dollar weakened in early trading after Moody’s downgraded the US credit rating from Aaa to Aa1, reigniting concerns about the country's fiscal stability. The downgrade triggered a market reaction: haven assets rallied, long-term Treasury yields surged past 5%, and equity futures slipped. Interestingly, the AUD/USD rose despite higher US yields, as investors focused more on the growing risks around America’s ballooning debt. Moody’s projects US deficits could reach nearly 9% of GDP by 2035, driven by rising interest payments, entitlement costs, and stagnant revenue—factors compounded by political uncertainty and proposed unfunded tax cuts.
By Fawad Razaqzada, market analyst with FOREX.com

RBA to Cut 0.25% as AUDUSD Tests Key ResistanceAUDUSD is trading in a very support/resistance-heavy area ahead of tomorrow’s RBA decision.
The RBA is widely expected to cut rates by 0.25%. The central bank is likely to factor in the government's extended electricity subsidies, and combined with weak GDP data, a rate cut appears almost certain. Since 2000, Australia's average quarterly GDP growth has been 0.7%. However, since Q3 2022, the figures have consistently come in below average, pointing to prolonged economic weakness.
That said, recent data has shown some improvement. The most recent GDP came in at 0.6%, marking four consecutive quarters of growth in GDP. CPI held steady at 2.4%, beating the 2.2% forecast. Quarterly wage growth rose to 0.9% from 0.7%, and employment increased by 89k — nearly quadruple the forecast and triple the previous month’s figure.
Despite the positive shifts, the combination of persistent weakness, electricity subsidies, and already high interest rates suggests the RBA will need to act. The market currently expects three cuts this year, including the one anticipated tomorrow.
AUDUSD is caught between a weak U.S. dollar and a weak Aussie dollar, and the degree of dovishness from the RBA will be critical this week. A broad resistance zone is currently capping gains. The 0.6450–0.6550 range is key, as it has seen significant volume since August 2023, with multiple tops and bottoms forming within this area. If a breakout occurs, the longer-term trend channel (yellow line) could become the next upside target.
On the downside, watch the 0.6350 support level and the area surrounding it for potential reactions or a clear break with following downward reaction.

AUDUSD Is Very Bullish! Buy!
Take a look at our analysis for AUDUSD.
Time Frame: 30m
Current Trend: Bullish
Sentiment: Oversold (based on 7-period RSI)
Forecast: Bullish
The market is on a crucial zone of demand 0.640.
The oversold market condition in a combination with key structure gives us a relatively strong bullish signal with goal 0.641 level.
P.S
We determine oversold/overbought condition with RSI indicator.
When it drops below 30 - the market is considered to be oversold.
When it bounces above 70 - the market is considered to be overbought.
Disclosure: I am part of Trade Nation's Influencer program and receive a monthly fee for using their TradingView charts in my analysis.
Like and subscribe and comment my ideas if you enjoy them!

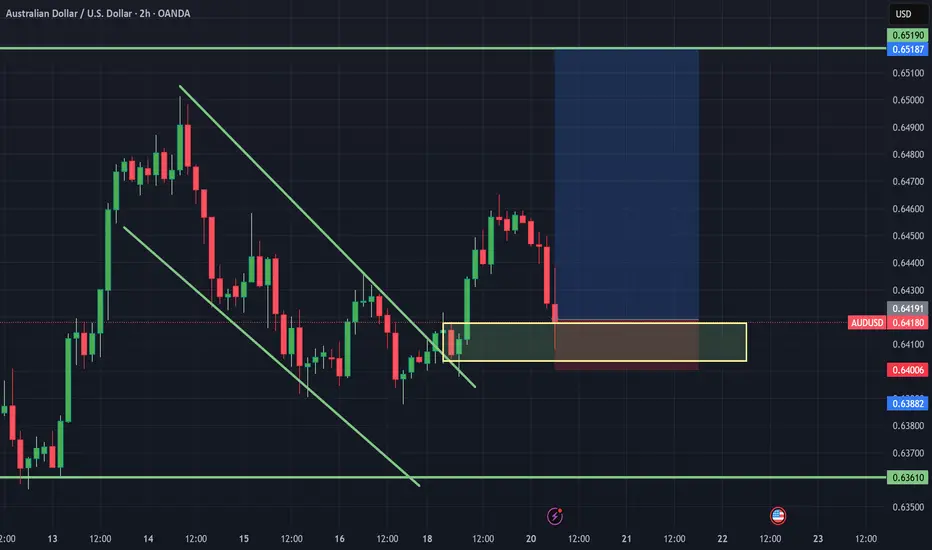
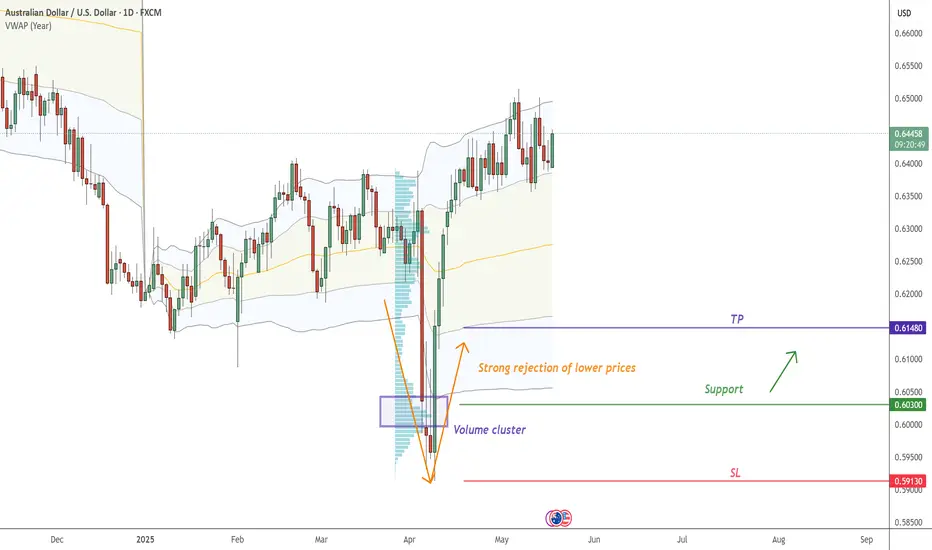
AUD/USD trade with TP + SLOn AUD/USD , it's nice to see a strong buying reaction at the price of 0.60300.
There's a significant accumulation of contracts in this area, indicating strong buyer interest. I believe that buyers who entered at this level will defend their long positions. If the price returns to this area, strong buyers will likely push the market up again.
Rejection of lower prices and high volume cluster are the main reasons for my decision to go long on this trade.
Happy trading
Dale
possibility of uptrendThe current support level is expected to change and the upward trend will begin. If the price breaks the support level, the correction will likely continue.

Scenarios for AUDUSD(4H)In 4 hour timeframe it has formed a range rectangle.I myself more believe it to break it down;But if that doesn't happen we can consider the upward scenario.It is as simple as that

Don't trade Aussie this week!Dear traders,
Among the top 8 forex market currencies, tariffs war affects the Aussie most, because Australia is highly dependent on China.
Rank Trading Partner Exports (A$ million)
1 China 185,141
2 Japan 119,889
3 European Union 31,816
4 United States 30,690
Uncertainty about China's future means, fluctuations in Aussie. I don't trade AUDUSD this week,
only if everything goes well with negotiations between Trump and China, I might use confirmed break over zone of 0.64355 to take long trades.
Regards, Ali

AUDUSDPotential buy from BOS-FVG on M15.
Trendline applied as confirmation (Third tap and breakout).

AUDUSD H4 | Bearish Reversal Based on the H4 chart analysis, the price is approaching our sell entry level at 0.64242, a pullback resistance that aligns close to the 78.6% Fibonacci retracement.
Our take profit is set at 0.6407, a pullback resistance.
The stop loss is placed at 0.6439, above the swing high resistance.
High Risk Investment Warning
Trading Forex/CFDs on margin carries a high level of risk and may not be suitable for all investors. Leverage can work against you.
Stratos Markets Limited (tradu.com):
CFDs are complex instruments and come with a high risk of losing money rapidly due to leverage. 63% of retail investor accounts lose money when trading CFDs with this provider. You should consider whether you understand how CFDs work and whether you can afford to take the high risk of losing your money.
Stratos Europe Ltd (tradu.com):
CFDs are complex instruments and come with a high risk of losing money rapidly due to leverage. 63% of retail investor accounts lose money when trading CFDs with this provider. You should consider whether you understand how CFDs work and whether you can afford to take the high risk of losing your money.
Stratos Global LLC (tradu.com):
Losses can exceed deposits.
Please be advised that the information presented on TradingView is provided to Tradu (‘Company’, ‘we’) by a third-party provider (‘TFA Global Pte Ltd’). Please be reminded that you are solely responsible for the trading decisions on your account. There is a very high degree of risk involved in trading. Any information and/or content is intended entirely for research, educational and informational purposes only and does not constitute investment or consultation advice or investment strategy. The information is not tailored to the investment needs of any specific person and therefore does not involve a consideration of any of the investment objectives, financial situation or needs of any viewer that may receive it. Kindly also note that past performance is not a reliable indicator of future results. Actual results may differ materially from those anticipated in forward-looking or past performance statements. We assume no liability as to the accuracy or completeness of any of the information and/or content provided herein and the Company cannot be held responsible for any omission, mistake nor for any loss or damage including without limitation to any loss of profit which may arise from reliance on any information supplied by TFA Global Pte Ltd.
The speaker(s) is neither an employee, agent nor representative of Tradu and is therefore acting independently. The opinions given are their own, constitute general market commentary, and do not constitute the opinion or advice of Tradu or any form of personal or investment advice. Tradu neither endorses nor guarantees offerings of third-party speakers, nor is Tradu responsible for the content, veracity or opinions of third-party speakers, presenters or participants.

AUD/USD - potential opportunity for a bullish trade
On the daily chart we identify an upward channel in which price has been trading between for the past 130 days. The decisive break below the channel was due to the April 2025 tariff announcements which effected many different markets across the world. At the moment, the current trend is upward with price continuing to trade within this channel.
Zooming down into the 1 hour, we see a failed head and shoulder reversal pattern. The neckline was broken and prices were heading downward but ultimately were stopped by the bottom channel trendline, reinforcing the bottom channel trendline as support. Prices then rallied back upward and caused the reversal pattern to fail.
Notice the RSI and how it differs from price when the neckline was broken. At the point where price touched the downward trendline, the RSI did not create a new low. Yet the moment before price reached the downward trendline, prices have dropped considerably. This means that there is very little momentum behind these price movements, but this little momentum was enough to send prices downward a decent amount. In short, there is little interest in purchasing the security at this time, the demand is low. One would expect prices to continue falling at this point, but instead prices begin to rise. There are many reasons why this could happen, one of them may be that institutions and banks are intentionally supporting price and keeping it from falling below a certain point.
This can be seen clearly in later price action. When price falls back to the bottom of the channel, prices rally quickly on volume that is declining. Normally, volume increases when prices go up. When that doesn't happen, it's important to look out for. A possible conclusion for this misalignment is that institutions and banks are keeping price within this channel for one reason or another. This aligns with the analysis performed on the daily chart which shows price trading within this channel for an extended period and continuing to do so. At this point, the most profitable decision is to place a trade on either end of the channel until a decisive break has occurred, retested the channel, and then broken away from it.
Here is the trade I would take, placing the stop loss below the most recent low and a take profit at the other end of the trendline. This gives a risk to reward of 1 to 2.33 which is an excellent amount.

Week of 5/18/25: Audusd AnalysisAU is bearish in the short-term until 1h timeframe shifts back to bullish to align with 4h and daily structure. We're looking for shorts in the meantime until price reaches the extreme of the swing structure.
Major News:
Unemployment - Thursday
