VIEWS ON AUD USD We are reacting from a weekly supply zone so i headed to the the 4hour time zone for confirmation which we reacted again to a 4hour supply zone which gave further confirmation for a sell signal on 30 minute forcasting the entire week for sells
AUDUSD trade ideas

Ocean dollars are weak(4h)Hello friends.Here is Australian dollar view what will happen.As you see the price now is in a support zone but will this really do and support?!.I believe no and the price strongly may fall down.All are selling :V)

AUS LONGPrice Looks like gaining momentum take out the weekly low intise sellers in to the market before switching to the upside manipulating the lows before taking off to visit previous monthly highs at 0.70000 leave a comment if you agree

A possible bull set up on AUDUSD.AUDUSD left the bears behind after breaking down trend and the sellers zone. It is currently in a consolidation phase and forming a bullish flag, if price eventually form double bottom we will look for a buy opportunity

AUDUSD (MSS + DEMAND + OTE)Hello traders!
My setup: MSS + DEMAND + 705 FIB
Target: till first problematic zone(BOS 1H)
Entry: Through confirmation on LTF
Have a profitable day and don't forget to subscribe for updates!

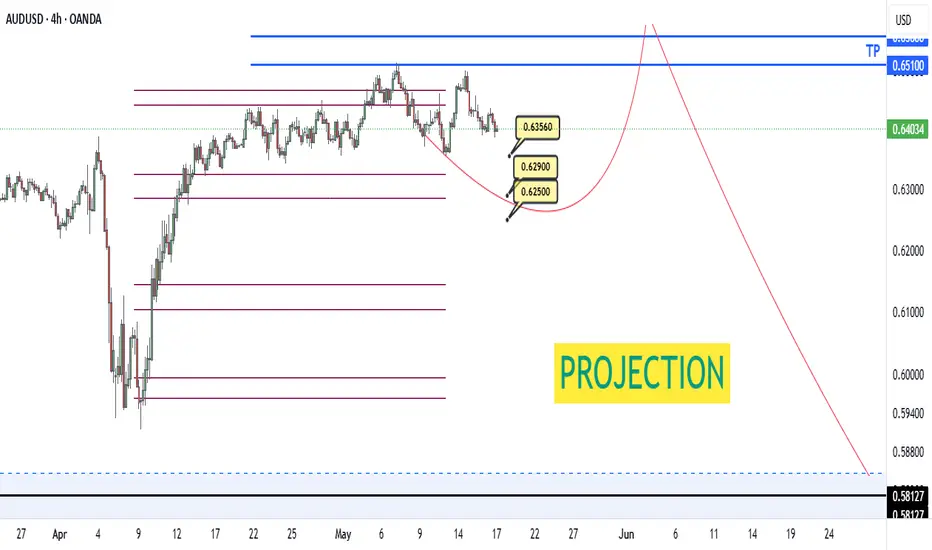
AUDUSD 4HFollowing our previous analysis, buyers failed to sustain momentum, leading to a confirmed bearish move.
The market is now progressing toward the predefined mathematical targets:
0.6356
0.6290 Main target
0.6250 potential final target
The zone around 0.6250 is a key area where we will re-evaluate the price action for a possible reversal, depending on updated market structure and data.
As always, we rely on geometric principles and calculated movement — not guesswork.
Let the market confirm the math.
AUDUSDThe interest rate differential between the U.S. and Australia is a key driver of the AUD/USD exchange rate, influencing capital flows, investor demand, and currency valuation. Here’s how it impacts AUD/USD:
How Interest Rate Differential Affects AUD/USD
Higher Australian Rates vs. U.S. Rates Strengthen AUD:
When the Reserve Bank of Australia (RBA) sets interest rates higher than the U.S. Federal Reserve (Fed), the yield advantage attracts global investors seeking better returns. This leads to increased demand for the Australian dollar, causing AUD/USD to rise as investors sell USD to buy AUD. This phenomenon is often called the "carry trade."
Higher U.S. Rates vs. Australian Rates Strengthen USD:
Conversely, when the Fed’s rates are higher than the RBA’s, investors shift capital into U.S. assets for better yields, boosting the USD and weakening AUD/USD. Since 2022, Fed rate hikes relative to the RBA have correlated with AUD weakness.
Capital Flows and Market Expectations:
The interest rate differential influences international capital flows. Expectations of future rate changes by either central bank, reflected in futures markets and rate trackers, can cause AUD/USD to move ahead of actual policy shifts. For example, anticipated RBA cuts or Fed hikes typically weaken the AUD/USD.
Trade and Economic Context:
The impact of interest rate differentials is moderated by other factors such as commodity prices (Australia’s major exports), trade relations, and global risk sentiment. For instance, U.S. tariffs on China and other countries indirectly pressure the AUD by affecting Australia’s trade environment.
Summary
Scenario AUD/USD Impact Explanation
RBA rates higher than Fed rates AUD/USD rises Higher Australian yields attract capital
Fed rates higher than RBA rates AUD/USD falls Higher U.S. yields attract capital
Market expects RBA cuts AUD/USD falls Anticipated lower yields reduce AUD appeal
Market expects Fed hikes AUD/USD falls Anticipated higher yields boost USD
In essence:
The interest rate differential between Australia and the U.S. is a fundamental determinant of AUD/USD movements. A wider gap favoring the U.S. dollar tends to weaken the AUD/USD pair, while a narrowing or reversal in this gap can support AUD gains. Traders closely should monitor central bank policies, inflation data, and rate expectations to anticipate shifts in this differential and its effect on the currency pair.

AUD-USD Potential Long! Buy!
Hello,Traders!
AUD-USD is making a local
Bearish correction but the
Pair will soon hit a horizontal
Support level of 0.6358 from
Where we will be expecting
A local rebound and a move up
Buy!
Comment and subscribe to help us grow!
Check out other forecasts below too!
Disclosure: I am part of Trade Nation's Influencer program and receive a monthly fee for using their TradingView charts in my analysis.

AUDUSD MOVES UPTREND.....?AUDUSD market moves towards bullish according to my analysis the momentum has shown that market's momentum is going up
It shows the specific target
Target: 🎯. 0.66350
Entry point. 0.64050
Trade according to my analysis if you want to make more money then use proper money management.

AUDUSD - LONG - Simple yet effective Bullish Indicators:
1- Market is respecting trend line support
2- Market is respecting major support level
3- FIB 0.618 level coincide with the Trend line support
4- Series of HH and HL (HL is froming)
5- Formation of Inside bar (Bullish Harami) Candle stick on 1H time Frame

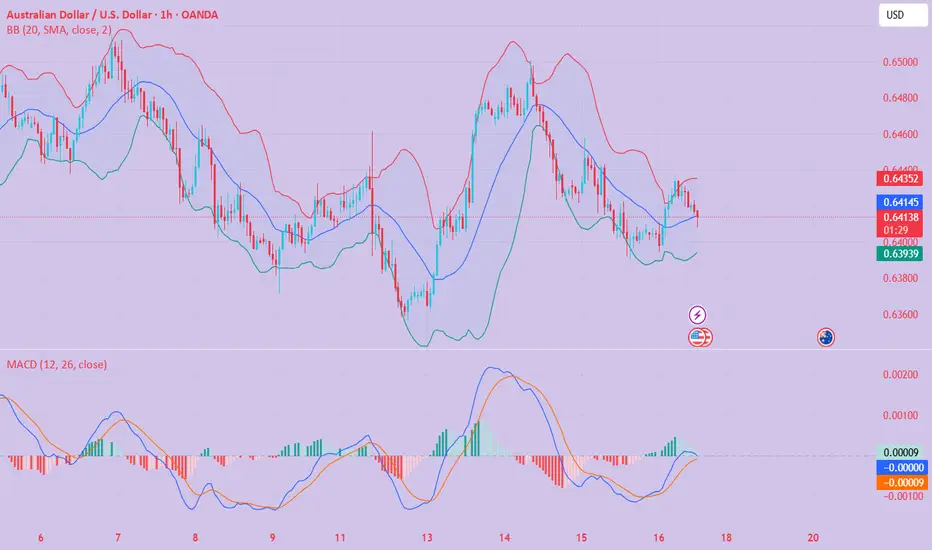
AUDUSD(20250516)Today's AnalysisMarket news:
Fed Chairman Powell: The Fed is adjusting its overall policy-making framework. Zero interest rate is no longer a basic situation. The wording of underemployment and average inflation rate needs to be reconsidered. PCE is expected to drop to 2.2% in April.
Technical analysis:
Today's buying and selling boundaries:
0.6416
Support and resistance levels:
0.6484
0.6458
0.6442
0.6391
0.6375
0.6349
Trading strategy:
If the price breaks through 0.6416, consider buying, the first target price is 0.6442
If the price breaks through 0.6391, consider selling, the first target price is 0.6375
AUDUSD bullish sideways consolidation supported at 0.6355AUDUSD maintains a bullish bias, supported by the prevailing upward trend. Recent intraday movement indicates a corrective pullback toward a key consolidation zone, offering a potential setup for trend continuation.
Key Support Level: 0.6355 – previous consolidation range and pivotal support
Upside Targets:
0.6470 – initial resistance
0.6500 and 0.6550 – extended bullish targets on higher timeframes
A bullish breakout from 0.6355 would suggest continuation of the uptrend, confirming buying momentum.
However, a decisive reversal and daily close below 0.6355 would invalidate the bullish structure, opening the door for further retracement toward 0.6310, with additional support at 0.6235 and 0.6195.
Conclusion
AUDUSD remains bullish above 0.6355. A bounce from this level supports further gains. Traders should watch for confirmation signals before positioning for the next move.
This communication is for informational purposes only and should not be viewed as any form of recommendation as to a particular course of action or as investment advice. It is not intended as an offer or solicitation for the purchase or sale of any financial instrument or as an official confirmation of any transaction. Opinions, estimates and assumptions expressed herein are made as of the date of this communication and are subject to change without notice. This communication has been prepared based upon information, including market prices, data and other information, believed to be reliable; however, Trade Nation does not warrant its completeness or accuracy. All market prices and market data contained in or attached to this communication are indicative and subject to change without notice.

AUDUSD sell Setup- Go for sell if setup given
- also a small trade
- Refine entry with smaller SL for better RR, if your strategy allow
"I Found the Code. I Trust the Algo. Believe Me, That’s It."

AUDUSD Massive Short! SELL!
My dear friends,
My technical analysis for AUDUSD is below:
The market is trading on 0.6454 pivot level.
Bias - Bearish
Technical Indicators: Both Super Trend & Pivot HL indicate a highly probable Bearish continuation.
Target - 0.6420
About Used Indicators:
A pivot point is a technical analysis indicator, or calculations, used to determine the overall trend of the market over different time frames.
Disclosure: I am part of Trade Nation's Influencer program and receive a monthly fee for using their TradingView charts in my analysis.
———————————
WISH YOU ALL LUCK

Could the Aussie bounce from here?The price is falling towards the support level which is a pullback support that lines up with the 71% Fibonacci retracement and the 78.6% Fibonacci projection and could bounce from this level to our take profit.
Entry: 0.6386
Why we like it:
There is a pullback support level that lines up with the 71% Fibonacci retracement and the 78.6% Fibonacci projection.
Stop loss: 0.6356
Why we like it:
There is a pullback support level.
Take profit: 0.6436
Why we like it:
There is a pullback resistance level.
Enjoying your TradingView experience? Review us!
Please be advised that the information presented on TradingView is provided to Vantage (‘Vantage Global Limited’, ‘we’) by a third-party provider (‘Everest Fortune Group’). Please be reminded that you are solely responsible for the trading decisions on your account. There is a very high degree of risk involved in trading. Any information and/or content is intended entirely for research, educational and informational purposes only and does not constitute investment or consultation advice or investment strategy. The information is not tailored to the investment needs of any specific person and therefore does not involve a consideration of any of the investment objectives, financial situation or needs of any viewer that may receive it. Kindly also note that past performance is not a reliable indicator of future results. Actual results may differ materially from those anticipated in forward-looking or past performance statements. We assume no liability as to the accuracy or completeness of any of the information and/or content provided herein and the Company cannot be held responsible for any omission, mistake nor for any loss or damage including without limitation to any loss of profit which may arise from reliance on any information supplied by Everest Fortune Group.

AUD/USD 4H | Wave 2 Pullback in MotionAUD/USD is currently completing a corrective Wave (2) within a larger impulsive structure. After the peak of Wave (1) at 0.65145, price has been in a healthy retracement phase, now nearing key fib confluence zones.
🟣 EMA Confluence:
Price is reacting near the 100 & 200 EMA (0.6373–0.6394), which has acted as dynamic support throughout this structure.
We are currently holding above the 0.382 level, with the golden zone (0.618–0.705) sitting just below.
🔄 Bullish Continuation Scenario:
If the pair holds above 0.6285 and we see bullish confirmation candles, we may begin the next leg higher — Wave (3) — targeting 0.66250–0.66766 as initial projection zones.
📊 RSI:
The RSI is hovering just below the 50 level, showing temporary bearish pressure, but has room to recover if structure holds.
🧠 Plan:
📍 Watching 0.6285–0.6214 for final support
📍 Wave (3) target zone: 0.66500+
📍 Invalidation: Clean break and close below 0.6015
🔔 Wave (2) entries are where the patient traders shine. Eyes on structure, and let price do the heavy lifting.
@WrightWayInvestments
@WrightWayInvestments
@WrightWayInvestments

AudUsd Trade IdeaAu is showing a clear range between 64930 and 63600 with 64350 being the mid level. After price tapped into 64930 we had a clean bearish structure flip on the smaller time frames to support the push back to the downside. Once price got to the mid level we could see price continuing to respect bearish structures. Entry for me was the 1hr bearish engulfing after the retesting the range it was in to confirm our overall direction. I'll be looking for a 1:3rr on this set up. If all goes well we could expect price to tap back into 63600 again. We'll see what happens.

AUDUSD Is Very Bullish! Buy!
Take a look at our analysis for AUDUSD.
Time Frame: 1D
Current Trend: Bullish
Sentiment: Oversold (based on 7-period RSI)
Forecast: Bullish
The market is testing a major horizontal structure 0.641.
Taking into consideration the structure & trend analysis, I believe that the market will reach 0.655 level soon.
P.S
Overbought describes a period of time where there has been a significant and consistent upward move in price over a period of time without much pullback.
Disclosure: I am part of Trade Nation's Influencer program and receive a monthly fee for using their TradingView charts in my analysis.
Like and subscribe and comment my ideas if you enjoy them!

AUD)USD) resistance level back down Read The ChaptianSMC Trading point update
Technical analysis for the AUD/USD pair on the 1-hour timeframe. Here's a breakdown of the idea presented:
Key Elements:
1. Resistance Level (0.65000 - 0.65200 area):
Price is approaching this strong resistance zone.
RSI is in the overbought zone (above 70), indicating potential reversal or correction.
2. Expected Price Action:
The chart suggests that price may spike into the resistance area (possibly a liquidity grab).
After hitting resistance, a drop is expected toward the FVG (Fair Value Gap) zone.
3. FVG and Target Zone (~0.64059):
There’s a highlighted Fair Value Gap that may attract price for mitigation.
Target point is near the EMA200 level and inside a previous structure zone.
This area also aligns with the RSI cooling off.
4. Support Level (~0.63600):
Marked as a stronger support area, though the current trade setup doesn't expect price to reach there soon.
5. EMA200 (blue line around 0.64202):
Acts as dynamic support.
Target is slightly below this EMA, potentially a liquidity sweep before a bounce.
Mr SMC Trading point
---
Summary of the Idea:
Bearish bias after a resistance rejection.
Look for short opportunities around the resistance zone (0.6500 area).
Target near 0.6405–0.6420 (FVG + EMA200).
Overbought RSI supports this pullback expectation.
Pelas support boost 🚀 analysis follow)

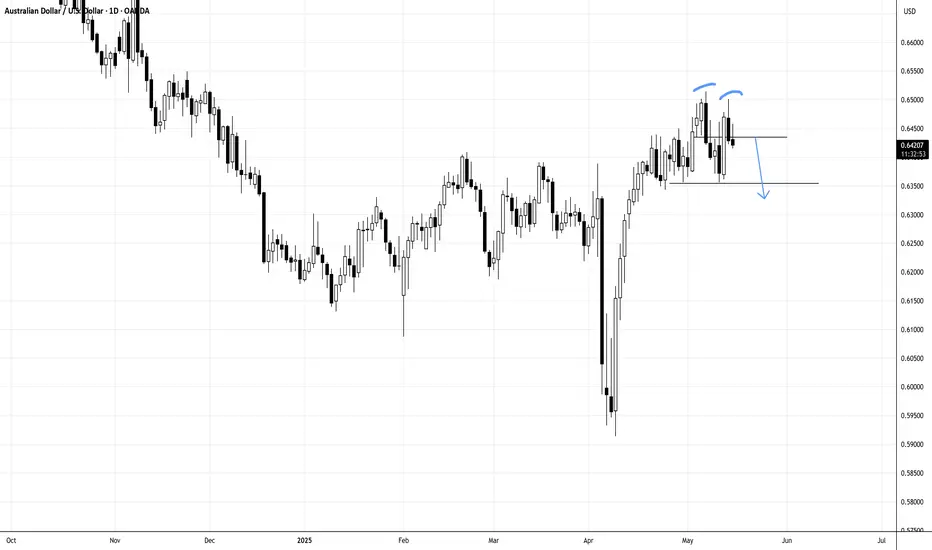
AUDUSD IN DOUBLE TOP, MAY REVERT TO ITS MEAN...AUDUSD
N.B!
- AUDUSD price might not follow the drawn lines . Actual price movements may likely differ from the forecast.
- Let emotions and sentiments work for you
- ALWAYS Use Proper Risk Management In Your Trades
#audusd
TRADE RECAP : AUDUSD ShortThis is the trade we took yesterday AUDUSD short
which moved in our favor in accordance with our analysis/forecast
now we waiting for a scale in to complete the move to the downside.

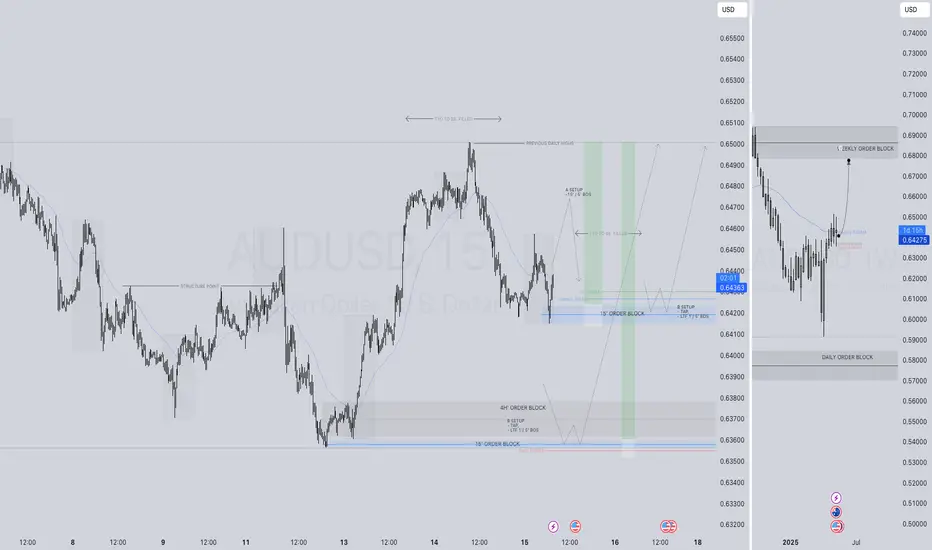
AUDUSD LONG FORECAST Q2 W20 D15 Y25AUDUSD LONG FORECAST Q2 W20 D15 Y25
Professional Risk Managers👋
Welcome back to another FRGNT chart update📈
Diving into some Forex setups using predominantly higher time frame order blocks alongside confirmation breaks of structure.
Let’s see what price action is telling us today!
💡Here are some trade confluences📝
✅Daily order block rejection
✅15’ order block identified
✅Tokyo ranges to be filled
✅Intraday bullish breaks of structure to be confirmed
🔑 Remember, to participate in trading comes always with a degree of risk, therefore as professional risk managers it remains vital that we stick to our risk management plan as well as our trading strategies.
📈The rest, we leave to the balance of probabilities.
💡Fail to plan. Plan to fail.
🏆It has always been that simple.
❤️Good luck with your trading journey, I shall see you at the very top.
🎯Trade consistent, FRGNT X
FRD TRADING .nice playbook short setup in the backside. targeting the low of the week. good luck traders.
