AUDUSD My Opinion! BUY!
My dear subscribers,
AUDUSD looks like it will make a good move, and here are the details:
The market is trading on 0.6455 pivot level.
Bias - Bullish
Technical Indicators: Both Super Trend & Pivot HL indicate a highly probable Bullish continuation.
Target - 0.6512
About Used Indicators:
The average true range (ATR) plays an important role in 'Supertrend' as the indicator uses ATR to calculate its value. The ATR indicator signals the degree of price volatility.
Disclosure: I am part of Trade Nation's Influencer program and receive a monthly fee for using their TradingView charts in my analysis.
———————————
WISH YOU ALL LUCK
AUDUSD trade ideas

audusd sell tradeThe Relative Strength Index (RSI) is showing a downward trend, indicating weakening momentum. Additionally, the Moving Average Convergence Divergence (MACD) is showing a bearish crossover, further supporting the potential for a downward move
AUD/USDThis is a trade setup for AUD/USD, based on volume and trend analysis.
Entry Price: 0.64230
Stop-Loss (SL): 0.64350
Take-Profit (TP): 0.64100
The trade is intended to be executed instantly at the mentioned price, in alignment with both volume behavior and the current trend direction.
Disclaimer: This setup is shared purely for backtesting purposes and to document trade ideas. It is not financial advice. Always perform your own analysis before making any trading decisions.

AUD/USD – Potential Bounce Buy SetupOANDA:AUDUSD
Timeframe: 30m
Type: Counter-trend / Bounce from Support
Risk Level: Medium to High
Possible Reward: 4+
🔹 Setup:
Price is testing the lower boundary of the recent support zone (0.6432 – 0.6420), aligning with the previous channel structure visible on the 8h chart. The descending move has shown initial signs of exhaustion, suggesting a potential bounce.
📈 Entry:
Current price zone 0.6432 – 0.6445
🎯 Targets (TP):
TP1: 0.64624
TP2: 0.64797
TP4: 0.65158
⛔ Stop Loss (SL):
0.64250 (below recent swing low and liquidity pool)
8H chart Overview:
Previous Position from top of Channel:
#AUDUSD #Forex #SmartMoney #PriceAction #MJTrading #ChartDesigner
Psychology Always Matters:

AUDUSD: Dropping To the Weekly FVG, As Expected!In this video, we will analyze the following FX market for July 31 - Aug 1st.
AUDUSD
Been waiting and watching for this move, and we've tracked it for weeks! It's happening now!
Look for it to continue until we reach the +FVG!
Enjoy!
May profits be upon you.
Leave any questions or comments in the comment section.
I appreciate any feedback from my viewers!
Like and/or subscribe if you want more accurate analysis.
Thank you so much!
Disclaimer:
I do not provide personal investment advice and I am not a qualified licensed investment advisor.
All information found here, including any ideas, opinions, views, predictions, forecasts, commentaries, suggestions, expressed or implied herein, are for informational, entertainment or educational purposes only and should not be construed as personal investment advice. While the information provided is believed to be accurate, it may include errors or inaccuracies.
I will not and cannot be held liable for any actions you take as a result of anything you read here.
Conduct your own due diligence, or consult a licensed financial advisor or broker before making any and all investment decisions. Any investments, trades, speculations, or decisions made on the basis of any information found on this channel, expressed or implied herein, are committed at your own risk, financial or otherwise.

XAUUSD and AUDUSD Analysis todayHello traders, this is a complete multiple timeframe analysis of this pair. We see could find significant trading opportunities as per analysis upon price action confirmation we may take this trade. Smash the like button if you find value in this analysis and drop a comment if you have any questions or let me know which pair to cover in my next analysis

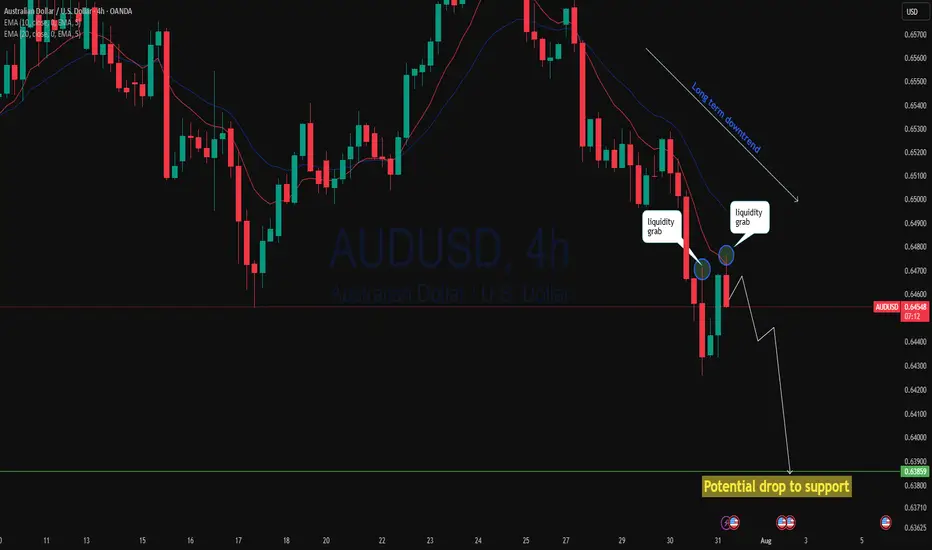
AUDUSD 2 step liquidity grab and drop?AUDUSD 4h has rejected twice from a key area after yesterday's massive breakdown with AUD negative data. Price has done a narrow pullback then this session is rejecting again with a stronger momentum could continue to drop to support. As 4h price action showing strong bearish move we may see continuation of the down trend!
Potential BullsFrom the EW concepts, it looks like a w5 of a leading diagonal is the next print out on a D1 Time frame, and currently is a w4 correction.
By Harmonics, looks like a BAT Pattern finalising H1, and therefore looks like it's time to warm the engines of the chopper ready to fly. Until then we're expecting a bullish move.

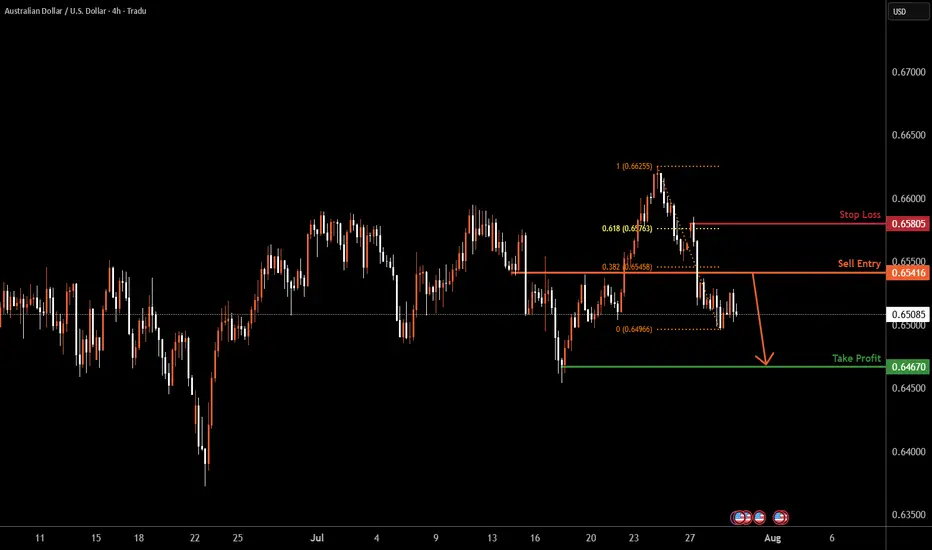
AUDUSD H4| Bearish reversal off 38.2% Fibonacci resistanceAussie (AUD/USD) is rising towards the sell entry, which is a pullback resistance that lines up with the 38.2% Fibonacci retracement and could reverse to the take profit.
Buy entry is at 0.6541, which is a pullback resistance that lines up with the 38.2% Fibonacci retracement.
Stop loss is at 0.6580, which is a pullback resistance that aligns with the 61.8% Fibonacci retracement.
Take profit is at 0.6467, which is a swing low support.
High Risk Investment Warning
Trading Forex/CFDs on margin carries a high level of risk and may not be suitable for all investors. Leverage can work against you.
Stratos Markets Limited (tradu.com ):
CFDs are complex instruments and come with a high risk of losing money rapidly due to leverage. 65% of retail investor accounts lose money when trading CFDs with this provider. You should consider whether you understand how CFDs work and whether you can afford to take the high risk of losing your money.
Stratos Europe Ltd (tradu.com ):
CFDs are complex instruments and come with a high risk of losing money rapidly due to leverage. 66% of retail investor accounts lose money when trading CFDs with this provider. You should consider whether you understand how CFDs work and whether you can afford to take the high risk of losing your money.
Stratos Global LLC (tradu.com ):
Losses can exceed deposits.
Please be advised that the information presented on TradingView is provided to Tradu (‘Company’, ‘we’) by a third-party provider (‘TFA Global Pte Ltd’). Please be reminded that you are solely responsible for the trading decisions on your account. There is a very high degree of risk involved in trading. Any information and/or content is intended entirely for research, educational and informational purposes only and does not constitute investment or consultation advice or investment strategy. The information is not tailored to the investment needs of any specific person and therefore does not involve a consideration of any of the investment objectives, financial situation or needs of any viewer that may receive it. Kindly also note that past performance is not a reliable indicator of future results. Actual results may differ materially from those anticipated in forward-looking or past performance statements. We assume no liability as to the accuracy or completeness of any of the information and/or content provided herein and the Company cannot be held responsible for any omission, mistake nor for any loss or damage including without limitation to any loss of profit which may arise from reliance on any information supplied by TFA Global Pte Ltd.
The speaker(s) is neither an employee, agent nor representative of Tradu and is therefore acting independently. The opinions given are their own, constitute general market commentary, and do not constitute the opinion or advice of Tradu or any form of personal or investment advice. Tradu neither endorses nor guarantees offerings of third-party speakers, nor is Tradu responsible for the content, veracity or opinions of third-party speakers, presenters or participants.
AUDUSD FORECASTLooking into the AUDUSD today, the market is really looking Nice. Waiting for the market to reach at the area of focus. Looking to take as a sell limit order waiting for the price to Liquidate then taking after gaining volume and power to push to the downside, it gives me the high probability to looking into this pair.

AUDUSD InsightHello to all subscribers.
Please share your personal opinions in the comments. Don’t forget to like and subscribe!
Key Points
- According to the U.S. June Job Openings and Labor Turnover Survey (JOLTS), the seasonally adjusted number of job openings was 7.437 million, a decrease of 275,000 from the previous month, falling short of the market expectation of 7.55 million.
- During high-level talks between the U.S. and China held in Stockholm, Sweden, both sides reportedly agreed to extend the tariff suspension measure for an additional 90 days.
- While the Federal Reserve is expected to hold rates steady in the July FOMC meeting, there is growing anticipation for a dovish stance suggesting a possible rate cut in September.
This Week's Major Economic Events
+ July 30: Germany Q2 GDP, U.S. ADP Nonfarm Employment Change (July), U.S. Q2 GDP, Bank of Canada rate decision, FOMC meeting results announcement
+ July 31: Bank of Japan rate decision, Germany July Consumer Price Index (CPI), U.S. June Personal Consumption Expenditures (PCE) Price Index
+ August 1: Eurozone July CPI, U.S. July Nonfarm Payrolls, U.S. July Unemployment Rate
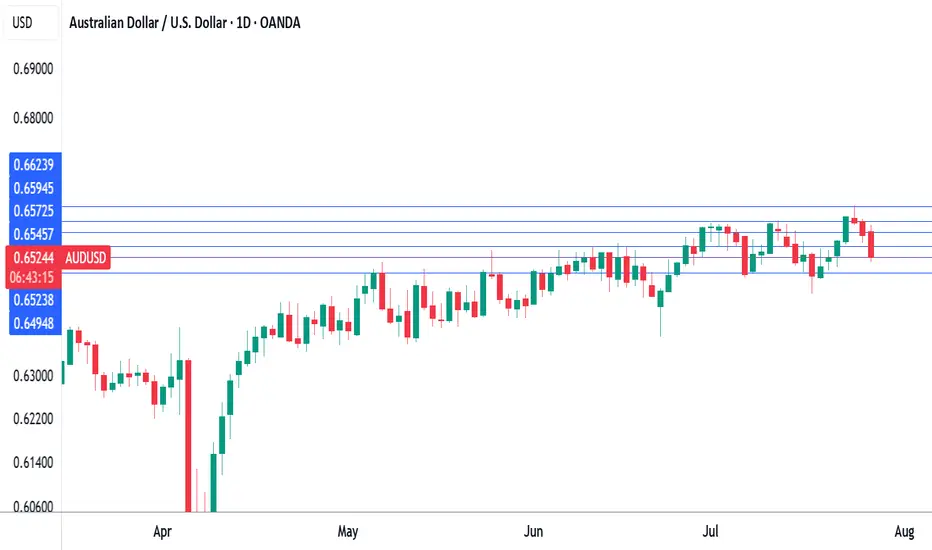
AUDUSD Chart Analysis
The pair recently climbed above the 0.66000 level but has since reversed, giving back gains. However, both higher highs and higher lows are being established, suggesting the current pullback is part of a gradual uptrend. A continued bullish outlook is expected over the long term, with a projected high around the 0.69000 level.

Australian dollar down, eyes US GDP, Australian CPIThe Australian dollar is down for a third straight trading day. In the North American session, the US dollar has posted gains against most of the major currencies, including the Aussie. The greenback received a boost after the US and the EU reached a framework trade agreement after protracted negotiations.
The data calendar is bare on Monday, with no events out of the US or Australia. Things get very busy on Wednesday, with Australian inflation, US GDP and the Federal Reserve rate decision.
Even with no US releases, the US dollar has posted gains against most of the major currencies, including the Aussie. The greenback received a boost after the US and the EU reached a framework trade agreement after protracted negotiations.
President Trump had threatened to impose 30% tariffs on European goods if a deal was not reached by Aug. 1. With the deal, a nasty trade war between the world's two largest economies has been avoided and the US will tariff most EU products at 15%.
The deal with the EU comes on the heels of a similar agreement with Japan, bringing a sigh of relief from the financial markets that have been worried about the economic fallout from Trump's tariff policy. The agreements remove a great deal of uncertainty and investors are hopeful that the US and Chinese negotiators will wrap up their talks with an agreement in hand.
The Federal Reserve meets on Wednesday and is virtually certain to maintain interest rates for a fifth straight meeting. It will be interesting to see if President Trump, who has been sharply critical of Fed policy, reacts to the decision. The money markets are expecting at least one cut before the end of the year, with the money markets pricing in a 61% likelihood a cut in September, according to FedWatch's CME.

AUDUSD Engineered to Drop?🧠MJTrading:
📸 Viewing Tip:
🛠️ Some layout elements may shift depending on your screen size.
🔗 View the fixed high-resolution chart here:
🔻 OANDA:AUDUSD – Tagged the Top | Smart Money Eyes Lower Levels??
📍 Perfect Respect of Channel Structure
AUDUSD has just kissed the upper boundary of a long-standing ascending channel, showing sharp rejection — a sign that premium pricing might now shift toward discount levels.
📈 The aggressive push into the highs likely aimed to clear buy stops — fulfilling smart money objectives before a potential reversal.
📉 And here’s the subtle clue:
Just below the last bullish candle lies a thin slide — a structural weakness.
If price breaks and closes below that full body bearish candle (Below 0.66000), the market could slip fast, unleashing a momentum-driven drop into the first liquidity zone (0.6520s).
🧠 For smart money lovers, this is the classic:
Sweep → Trap → Slide
📏 And for fans of parallelism, the chart’s geometry offers a rare beauty — lines in harmony, structure in rhythm, and opportunity in alignment.
🔍 What to Watch For:
Break below 0.66000 (last candle body) = entry signal
0.6520–0.6540: first liquidity zone
0.6400–0.6300: deeper cleanout, if bearish pressure sustains
Inset: DXY bouncing from long-term demand supports bearish thesis
Manage your risk wisely...
For Lower time frame traders:
Psychology Always Matters:
(Click on the pictures for caption and concepts)
#AUDUSD #SmartMoney #LiquiditySweep #ChannelTrading #ChartDesigner #MJTrading #PriceAction #Forex

Check the trend A triangle pattern is expected to form within the current support range. Then the start of an uptrend is likely. If the price breaks through the 78.6% level, a continuation of the correction and downtrend is possible.

AUDUSD BUYThe AUD/USD pair is trading around 0.6520 on Tuesday. The daily chart’s technical analysis indicates a prevailing bullish bias as the pair remains within the ascending channel pattern. However, the 14-day Relative Strength Index (RSI) has moved below the 50 mark, indicating that a bearish bias is active. Additionally, the pair is positioned below the nine-day Exponential Moving Average (EMA), indicating that short-term price momentum is weaker.
The US and EU reached a framework trade agreement on Sunday that sets 15% tariffs on most European goods, taking effect on August 1. This deal has ended a months-long stand-off, per Bloomberg.
Traders keep their eyes on further developments in the US-China trade talks. The discussions are set to resume on Tuesday after top economic officials from both nations held over five hours of negotiations in Stockholm on Monday. The purpose of this meeting is to resolve ongoing disputes and extend their trade truce by another three months.
US Treasury Chief Scott Bessent met with China’s Vice Premier He Lifeng at Sweden’s Rosenbad government offices. The meeting comes ahead of an August 12 deadline to finalize a long-term tariff agreement with the Trump administration, building on preliminary deals reached in May and June that had helped ease tensions.
The US Federal Reserve (Fed) is widely expected to keep the benchmark interest rate steady between 4.25% and 4.50% at its July meeting. The FOMC press conference will be observed for any signs that rate cuts may start in September.
The Reserve Bank of Australia (RBA) is expected to closely watch the June labor force data and second-quarter inflation figures before deciding on a potential rate cut. Both the monthly and quarterly CPI reports are scheduled for release later this week.
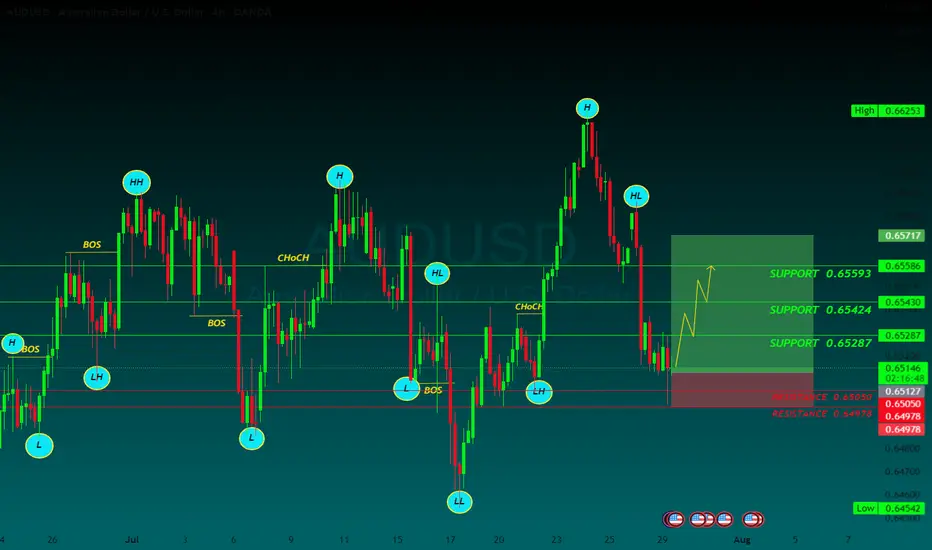
SUPPORT 0.65593
SUPPORT 0.65424
SUPPORT 0.65593
RESISTSNCE 0.65050
RESISTANCE 0.64973
AUDUSD ~ Real Time Elliott Wave UpdatesThis is an update of an AUDUSD chart I had previously posted. We can see that Wave B(Blue) confirms at the 161.8% Fib. level and then sells. Wave B(Blue) pushed a bit higher than I had previously thought, but all other analysis remains the same. The sentiment is a for a sell. Check my previous post for more analysis on this pair.

AUD/USD: Rising Wedge Breakdown Signals Bearish ShiftAUD/USD has broken down from a rising wedge formation after rejecting near the 61.8% Fibonacci retracement at 0.6558. This pattern, typically bearish, suggests the recent uptrend is losing steam — a view reinforced by Friday’s strong bearish candle closing below both the wedge support and the 50-day SMA (0.6510).
The price action now sits just above the 200-day SMA (0.6397), a level that could act as a short-term buffer. If this moving average gives way, focus shifts to the prior horizontal support at 0.6170. Meanwhile, upside attempts may find resistance at the broken wedge support and Fib zone near 0.6550.
Momentum indicators support the bearish case:
MACD is flat but biased lower, hovering near the zero line.
RSI has dipped below 50 (currently ~47.7), indicating weakening bullish momentum.
Unless AUD/USD quickly reclaims 0.6550, the path appears tilted toward further losses, potentially targeting the 0.63–0.62 zone.
Bias: Bearish breakdown with downside pressure while below 0.6550. Watch 0.6397 and 0.6170 as key support levels.
-MW

This Chart Screams Breakout – Are You In?AUD/USD – Bullish Setup Brewing
AUD/USD has been respecting this rising channel beautifully, with clean higher highs and higher lows.
Back in April, we saw a classic bear trap, price wicked below support, lured in shorts, and then reversed sharply. That fakeout sparked a strong rally and confirmed demand.
Currently, price is consolidating near the Key Resistance Zone and bouncing off the lower trendline again a sign of strength.
If this pattern continues, we could soon see a breakout above the upper trendline, potentially sending AUD/USD flying toward 0.68+.
Outlook:
As long as the structure holds, dips are for buying. Bulls remain in control.
DYOR, NFA
Thanks for the reading

AUDUSD corrective pullback supported at 0.6486Trend Overview:
The AUDUSD currency price remains in a bullish trend, characterised by higher highs and higher lows. The recent intraday price action is forming a continuation consolidation pattern, suggesting a potential pause before a renewed move higher.
Key Technical Levels:
Support: 0.6465 (primary pivot), followed by 0.6445 and 0.6400
Resistance: 0.6570 (initial), then 0.6590 and 0.6625
Technical Outlook:
A pullback to the 0.6465 level, which aligns with the previous consolidation zone, could act as a platform for renewed buying interest. A confirmed bounce from this support may trigger a continuation toward the next resistance levels at 0.6570, 0.6590, and ultimately 0.6625.
Conversely, a daily close below 0.6465 would suggest weakening bullish momentum. This scenario would shift the bias to bearish in the short term, potentially targeting 0.6445 and 0.6400 as downside levels.
Conclusion:
AUDUSD maintains a bullish structure while trading above the 0.6465 support. A bounce from this level would validate the consolidation as a continuation pattern, with upside potential toward the 0.6570 area. A breakdown below 0.6465, however, would invalidate this view and suggest deeper corrective risk.
This communication is for informational purposes only and should not be viewed as any form of recommendation as to a particular course of action or as investment advice. It is not intended as an offer or solicitation for the purchase or sale of any financial instrument or as an official confirmation of any transaction. Opinions, estimates and assumptions expressed herein are made as of the date of this communication and are subject to change without notice. This communication has been prepared based upon information, including market prices, data and other information, believed to be reliable; however, Trade Nation does not warrant its completeness or accuracy. All market prices and market data contained in or attached to this communication are indicative and subject to change without notice.

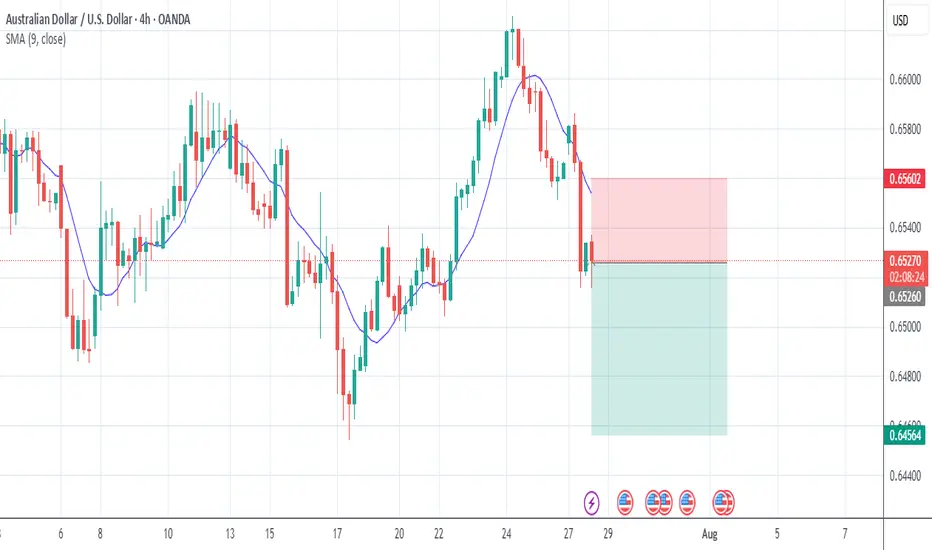
AUDUSD 4HOUR TIME FRAME ANALYSISOn the 4-hour chart, AUD USD has recently shifted into a shallow up-trend after carving out a higher low around 0.6480. From that support zone, price has rallied through a short-term descending channel, breaking its upper trendline just above 0.6500 and holding that breakout on the last two candles. The entry at 0.65231 sits just above a cluster of prior resistance–turned–support (0.6500–0.6520), giving the trade a solid foothold.
Momentum indicators confirm the bullish tilt: the 14-period RSI is riding around 60–65, neither overbought nor fatigued, suggesting room to run toward your target. Likewise, price is comfortably above both its 50-period and 200-period EMAs, with the shorter EMA crossing above the longer one roughly 12 bars ago, signalling that buyers are in control.

AUDUSD 4Hour TF - July 27th, 2025AUDUSD 7/27/2025
AUDUSD 4hour Bullish idea
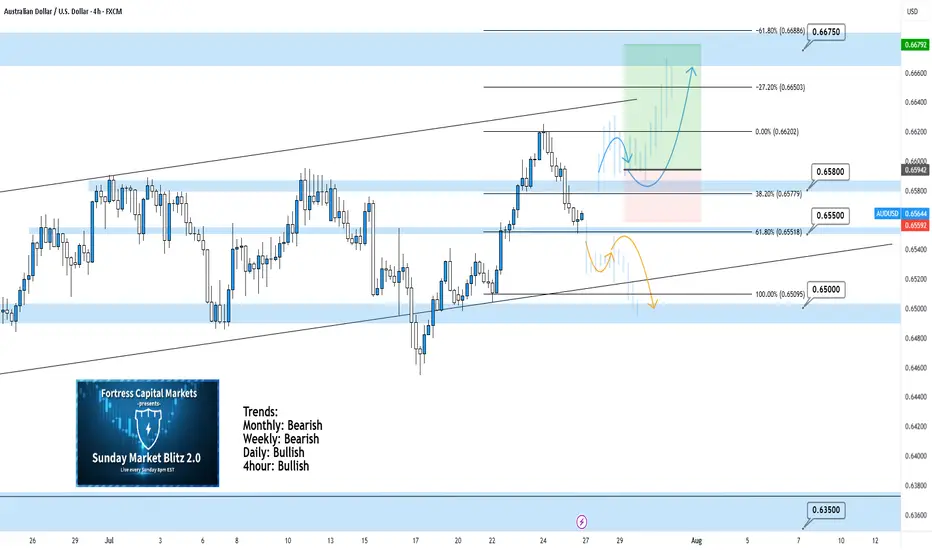
Monthly - Bearish
Weekly - Bearish
Dailly - Bullish
4hour - Bullish
AUDUSD is holding steady in this weekly channel but has been showing signs of high volume ranging over the last month. Going into this week we’re looking mostly bullish but we have some minor zones that could slow price action down.
Here are two scenarios we are looking out for, for the week ahead:
Bullish Continuation - This is our ideal scenario as we want the trend to continue so we can have the best quality trade. For us to get comfortable going long AU we need to see structure above our 0.65800 zone. We want to see price action use this zone as support and establish structure (the next higher low).
If this happens we can look to target higher toward major resistance levels and key fib levels.
Bearish Reversal into range - If we fail to see bullish conviction at the current zone it’s possible price action will fall back into the range. This is a likely scenario as we have seen price action bounce between 0.65800 and 0.65000 multiple times over the last month.
I wouldn’t recommend trading this scenario as I don’t like trading ranges but we could see price action head lower to 0.65000.