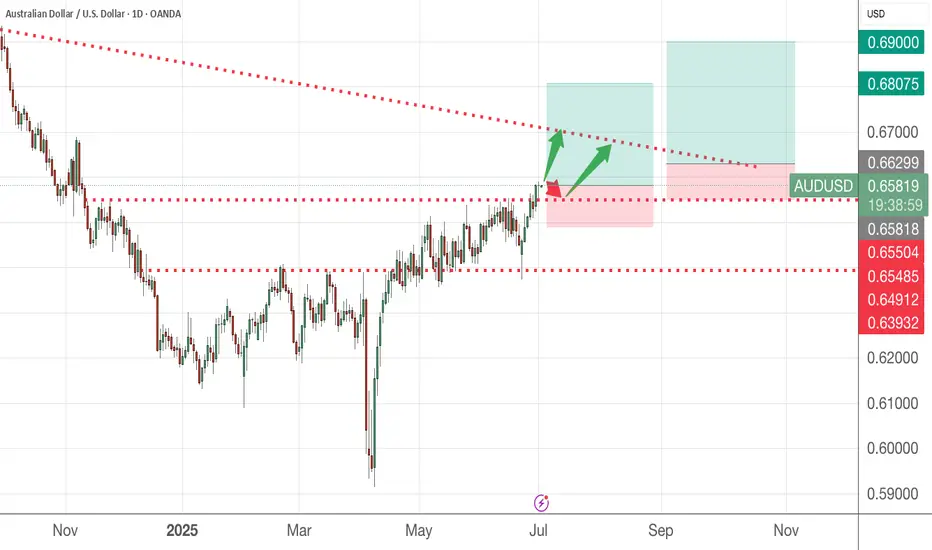
AUDUSD looks promising for a continuationThis pair presents a potential trade opportunity in the form of a short continuation. The price did reach a significant Area of Interest (AoI) in form of an expanding 3-touch structure before turning around. Price did close outside the structure on the H4 with a candlestick reversal pattern and printed a bearish high-test candle on the daily timeframe. This clearly shows a shift in momentum and I am now waiting for a lower time frame (LTF) continuation pattern to confirm the direction and a valid candlestick pattern for entry.
📈 Simplified Trading Rules:
> Follow a Valid Sequence
> Wait for Continuation
> Confirm Entry (valid candlestick pattern)
> Know When to Exit (SL placement)
Remember, technical analysis is subjective; develop your own approach. I use this format primarily to hold myself accountable and to share my personal market views.
⚠ Ensure you have your own risk management in place and always stick to your trading plan.
AUDUSD trade ideas

AUDUSD TRADE SETUPWait for retest the entry level and Bullish momentum candle then take a trade for Buy otherwise skip this setup

demand and supply strategymost traders will be taking an aggressive entry from the supply down to the demand zone but for me being a patient trader, i want to see a new trend, price forming a LL before considering any sell opportunity...
if it doesnt pullback for me to enter then its fine i will sit on my hands and wait for the next opportunity...
please drop a comment...

AUDUSD Will Go Higher From Support! Buy!
Please, check our technical outlook for AUDUSD.
Time Frame: 12h
Current Trend: Bullish
Sentiment: Oversold (based on 7-period RSI)
Forecast: Bullish
The market is trading around a solid horizontal structure 0.656.
The above observations make me that the market will inevitably achieve 0.662 level.
P.S
We determine oversold/overbought condition with RSI indicator.
When it drops below 30 - the market is considered to be oversold.
When it bounces above 70 - the market is considered to be overbought.
Disclosure: I am part of Trade Nation's Influencer program and receive a monthly fee for using their TradingView charts in my analysis.
Like and subscribe and comment my ideas if you enjoy them!

SELLPossible sell. at the moment forming head and shoulders. made a lower high. expecting it to drop

AUDUSD Technical & Order Flow AnalysisOur analysis is based on a multi-timeframe top-down approach and fundamental analysis.
Based on our assessment, the price is expected to return to the monthly level.
DISCLAIMER: This analysis may change at any time without notice and is solely intended to assist traders in making independent investment decisions. Please note that this is a prediction, and I have no obligation to act on it, nor should you.
Please support our analysis with a boost or comment!

AUD/USD SHORT FROM RESISTANCE
Hello, Friends!
We are now examining the AUD/USD pair and we can see that the pair is going up locally while also being in a uptrend on the 1W TF. But there is also a powerful signal from the BB upper band being nearby, indicating that the pair is overbought so we can go short from the resistance line above and a target at 0.644 level.
Disclosure: I am part of Trade Nation's Influencer program and receive a monthly fee for using their TradingView charts in my analysis.
✅LIKE AND COMMENT MY IDEAS✅

AUD/USD Pullback or Trap? Key Level in FocusPrice has slipped below the rising channel and is now pulling back to retest the breakdown area. This retest could decide the next move.
If buyers fail to step in here, and price gets rejected again, it may signal the start of a deeper correction. However, reclaiming the channel could flip the bias back to bullish.

AUD/USD - Full in depth breakdown (MUST READ) 📉 AUD/USD Multi-Timeframe Sell Setup – High Confidence Reversal
Pair: AUD/USD
Timeframes: Weekly / Daily / 1H
Bias: Bearish
Entry Zone: Supply Zone around 0.6700 - 0.6730
Target Zones:
🔹 TP1: 0.6520 (Mid-Range)
🔹 TP2: 0.6360 (Channel Support)
🔹 TP3: 0.6250 (Long-Term Demand Zone)
🧠 Technical Breakdown:
🔸 WEEKLY TIMEFRAME
✅ Long-Term Bearish Channel
Price is respecting a clearly defined descending channel.
This week’s price action has reacted perfectly from the upper boundary of that channel – rejecting continuation of bullish moves.
✅ Major Supply Zone Reaction
The most recent rejection aligns with a historically respected weekly supply zone.
Volume was introduced here in the past, suggesting institutional presence and high sell interest.
🔸 DAILY TIMEFRAME
✅ Daily Market Structure Shift
A confirmed daily break of structure (D-BOS) shows the bullish wave has lost steam.
Most recent rally into Supply 2 has been rejected, forming a lower high within the macro downtrend.
✅ Volume Profile Confluence
Volume is heaviest below current price, suggesting there’s little interest or imbalance left to fill above.
Current price sits in a low volume node, often leading to quick rejections and sell-offs.
✅ Supply Zone + 71% Premium Level
Price has tapped into the 71% Fib retracement level, aligning perfectly with:
Prior supply zones
EMA resistance
Volume-based rejections
🔸 1H TIMEFRAME
✅ CHoCH & i-BOS Confirming Reversal
Clear Change of Character (CHoCH) followed by internal Break of Structure (i-BOS) confirms lower timeframe bearish intent.
Price is currently forming a retracement leg, likely to pull back into supply for another sell.
✅ Bearish Schematic Playing Out
Expecting minor bullish pullback to retest broken structure before continuation into deeper targets.
Clean distribution phase completing before markdown.
📌 Sell Plan:
Sell Zone: 0.6700 – 0.6730 (supply + 71%)
Stop Loss: Above supply zone / channel high
Take Profits:
TP1: 0.6520 (fair value gap zone)
TP2: 0.6360 (channel low)
TP3: 0.6250 (major demand)
⚠️ Risk Management
Enter on lower timeframe confirmation (1H / 15M engulfing or BOS)
Trail stops as each BOS forms
Maintain R:R ≥ 1:3 for higher timeframes
🗓️ Market Outlook:
AUD/USD is aligning across all major timeframes for a high-probability bearish continuation. With structure shifted, supply respected, and volume confirming rejection, sellers are in clear control.
🔔 Follow for more SMC-based setups, clean structure trades, and multi-timeframe confluence strategies.

AUDUSD(20250807)Today's AnalysisMarket News:
Federal Reserve Chairman Neel Kashkari: A rate cut may be appropriate in the short term, and two rate cuts this year are reasonable. Trump: The new Fed governor will likely be temporary, and the appointment will be announced within 2-3 days.
Technical Analysis:
Today's Buy/Sell Levels:
0.6489
Support and Resistance Levels:
0.6538
0.6520
0.6508
0.6470
0.6458
0.6440
Trading Strategy:
If the price breaks above 0.6508, consider a buy entry, with the first target at 0.6520. If the price breaks below 0.6489, consider a sell entry, with the first target at 0.6470

AUDUSD - BullishAUDUSD is Bullish on Fundamental Bias and Seasonal aslo support long position. Divergence can also be observed on RSI.

AUDUSD Swing Trade Plan – 1H Time FrameThe pair is showing early signs of bullish structure with a clean higher low (HL) to higher high (HH) transition. An instant buy entry is considered valid based on the breakout above a key resistance zone.
🔹 Entry: Market Buy (Current Price ≈ 0.65038)
🔹 Stop Loss (SL): 0.64496
🔹 Take Profit (TP): 0.65523
📌 Structure Shift Noted
The break above prior highs confirms a market structure reversal with HL → HH → HH sequence. The bullish RSI divergence and sustained move above the EMA cluster further support upside momentum.
📍 Trade Rationale:
Price broke out of prior resistance and retested it as new support
RSI currently around 63, indicating strength without being overbought
Favorable risk-reward from current levels, targeting previous imbalance area at TP1
🧠 Plan: Monitor candle close above minor intraday range for continued bullish pressure. SL is placed below recent demand and last swing low for structural protection.
💡 Patience and discipline are key — watch how price behaves around the 0.652 zone before scaling in.

AUD/USD Long SetupMarket structure just flipped bullish after sweeping liquidity around the 0.64200 zone.
Entry triggered on bullish break & retest, aiming for 0.65290.
SL well-protected below recent low.
🧠 Smart money move or trap?
Let the market prove you right, not your emotions.
No PAIN | no GAIN. Let the market DECIDE.

AUDUSD?
Hi,
Few days of rejection high 0.64900
Hope it breaks out 0.65000
Anything below 0.64800
I don't think, will get it at another round
All the best
Not a guru

Nibbling some Aussie dollarsNever mind if I am late in the game. I think there is still some room for the Aussie dollars to rally.
I have indicated two potential profit targets.
Please DYODD
AUDUSD: Short entry triggerGood morning everyone,
today I am sharing a Short signal received now via alert from the LuBot Ultimate indicator.
Entry made on correction (approximately 50% of the trigger candle).
In this case I will follow the levels suggested by the indicator regarding both the TP and SL. Levels that will update as the trade progresses.
The signal is confirmed by the negative structure (red candles) that has just started on the 4H and a bearish trend confirmed by the signal a few candles back (Bear Trend signal).
The predictum also shows a bearish signal, therefore predicting a negative situation for the current month.
👍 If you want to see other similar posts, like/boost
🙋♂️ Remember to follow me so you don't miss my future analyses
⚠️ Disclaimer: This post is for informational purposes only and does not constitute financial advice. Always do your research before making investment decisions.

BUY AUDUSDAUDUSD BUY Idea
Session: London
Target: 0,64796
We can expect a bullish liquidity grab in the next few hours

AUD/USDThis analysis is based on a combination of volume analysis, Fibonacci retracement levels, and Stochastic oscillator signals to find an optimal entry point. The trade setup suggests a potential bullish move after confirming support and momentum alignment.
Entry: 0.6475 area
Stop-Loss: 0.6465 area
Take-Profit: 0.6498 area
This setup aims to capitalize on a high-probability bounce within a key Fibonacci zone, confirmed by volume strength and oversold readings on the Stochastic indicator.
⚠️ Disclaimer:
This is not financial advice. Trading involves risk and may not be suitable for all investors. Always do your own research and use proper risk management.

AUD-USDYou can withdraw money to the specified support and if the purchase is approved, keep an eye on it.

AUD/USDAUD/USD – Possible Correction Scenario Based on Volume Analysis
This idea presents a potential correction in AUD/USD, based on recent volume behavior suggesting a shift in market sentiment.
Following a strong move, volume has started to decline near the recent lows, hinting at possible seller exhaustion. This may open the path for a short-term bullish correction toward higher value areas.
📍 Entry: 0.64681
🎯 Target: 0.65050
🛑 Stop-loss: 0.64428
This is a possible scenario, not a guaranteed outcome. Always monitor price action and volume for confirmation.
Disclaimer: This analysis is for educational purposes only and does not constitute financial advice. Always do your own research and manage risk appropriately.
Ask ChatGPT

AUD-USD Will Go Down! Sell!
Hello,Traders!
AUD-USD is trading in a
Downtrend and the pair
Broke the key horizontal
Level of 0.6470 which is
Now a resistance then
Made a retest and a
Confident pullback which
Reinforces our bearish
Bias and makes us expect
A further bearish move down
Sell!
Comment and subscribe to help us grow!
Check out other forecasts below too!
Disclosure: I am part of Trade Nation's Influencer program and receive a monthly fee for using their TradingView charts in my analysis.

AUDUSD Outlook – From Bias to Execution Previous day closed bearish, leading to a sell bias, On the 1H, I then identified a familiar price action pattern, a rising wedge breakdown.

AUDUSD - Sell Setup market is in bear trend with a series of LH and LL. currently market has retraced to a fib level of 0.5% which and continuing bear trend. there is no divergence and market is making a bearish channel with a bearish flag pattern intact.
we instantly enter into the market with our SL level above last LH and TPs as projected.
