AUD_USD BEARISH BREAKOUT|SHORT|
✅AUD_USD broke the key
Structure level of 0.6460
While trading in an local downtrend
Which makes me bearish
And I think that after the retest of
The broken level is complete
A bearish continuation will follow
SHORT🔥
✅Like and subscribe to never miss a new idea!✅
Disclosure: I am part of Trade Nation's Influencer program and receive a monthly fee for using their TradingView charts in my analysis.
AUDUSD trade ideas


AUD USD BUYAfter a healthy correction AUD showing strength with some bullish divergence. A good entry for the restarec Elliot Wave.

AUD/USD ANALYSIS: WHERE ARE WE HEADED Good afternoon
Based on what we are saeeing with AUD/USD we see two options
1) Below .645 low then we can see a decent drop down to .635
2) If we can break the highs of .652 then a drive up to .65951 makes sense
Trade Smarter Live Better
Kris

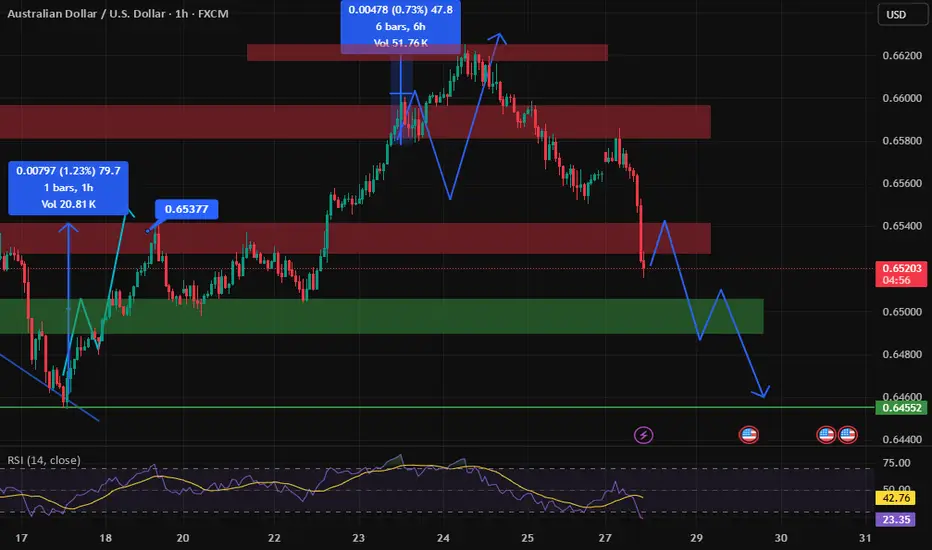
AUDUSD SHORT SETUP – BEARISH BREAK & RETEST📉 AUDUSD SHORT SETUP – BEARISH BREAK & RETEST
Price breaks below rising channel support and retests structure as new resistance. Clean rejection confirms bearish continuation bias.
🔻 Entry: 0.6495
🎯 Targets: 0.6420 → 0.6400 → 0.6370
🛑 SL: 0.6545
⏰ TF: 2H
📊 Bias: Bearish
Technical confluence aligns with momentum shift—waiting for follow-through to key demand zone.
#AUDUSD #ForexSignals #PulseTradesFX

AUD/USD part 2.my trading journal continued.
trend line of ascending triangle bottom appears to be holding. Road map still valid. looking for a entry point at end of 1 hour chart for leg up before a major downward move. (2 potential trades on the table).
remember today some big news out of US today. i final spike down on 5 minute is on the cards.

AUDUSD Analysis – Bullish Structure Still IntactAUDUSD is trading within a clear ascending channel on the H4 chart. After dropping from the FVG zone around 0.65800, price has reacted well to the lower boundary support near 0.64650.
Currently, price action suggests the potential formation of a short-term bottom. If this level holds and the pair rebounds, the next target could be the red FVG zone near 0.65400.
Recent Supporting News:
U.S. consumer confidence slightly weakened, causing the dollar to cool off — offering technical rebound support for AUD.
Trading Strategy:
Prefer short-term Buys near 0.64650 if a confirmed bounce appears, with target around 0.65400. Be cautious if price breaks below the ascending channel.
Do you think AUD will continue to rise within this bullish channel?

AUDUSD - BullishAUDUSD is Bullish on Fundamental Bias and Seasonal aslo support long position. Divergence can also be observed on RSI. Forming an Harmonic pattern so it looks like buyers are in a strong position

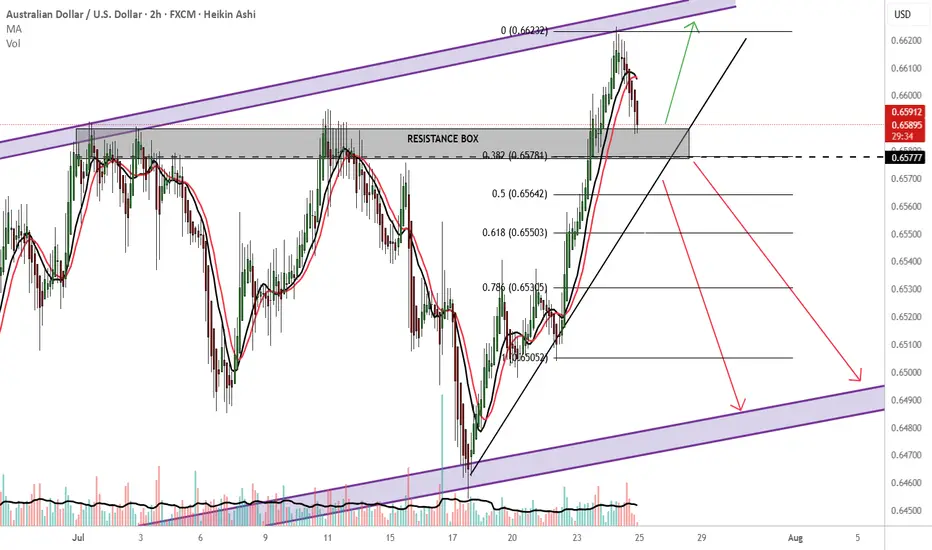
AUDUSD Still early days
20% in me:
Unless strong bullish fundamentals present themselves or the big boys with the big bucks drive a bullish push anywhere from 0.65784 or resistance, I would be looking to sell.
Buy outside the resistance box
TP:0.66600 new immediate high?
Please also consider price action as there are 2 previous rejections in the 0.65784 price area.
80% in me:
-Australia is heavily tied to China via exports
RBA rate cuts?
Falling iron ore prices...
-Perfect price action channel trade. SELL at resistance BUY at support. Bullish long term, bearish short term.
-fib 0.382 downward continuation and close below 0.65784
-Looking for a break below the upward sloping trendline HARD sell
-safer option: wait for a 0.65780 retest, below the upward sloping trendline sells and make bank.
TP: 0.6500
THOUGHTS?
About to Buy AUDUSD waiting for retracementAfter retracing, put stop below wick and only buy if the candle closes

AUD/USD another leg up before down anticipatedroad map plotted. just entered bullish trade for a small leg up. SL to be moved to breakeven. anticipating a generous leg ABC leg down anytime as approaching upper blue trendline forming a ascending triangle. keep an eye out for refersal signals

daily outlook 7-29-25daily outlook 7-29-25 = in this outlook i show my friends what i am gonna trade for today.

AUDUSD - BullishAUDUSD is Bullish on Fundamental Bias and Seasonal aslo support long position. Divergence can also be observed on RSI. Forming an Harmonic pattern so it looks like buyers are in a strong position

Trade Setup: AUDUSD – Short Opportunity Identified A fresh sel Trade Setup: AUDUSD – Short Opportunity Identified
A fresh sell opportunity on AUDUSD has been spotted, backed by bearish market structure, technical resistance, and macroeconomic sentiment favoring a downside move. AUDUSD is currently trading near a key resistance zone around 0.65250, where the price has previously failed to break higher.
The market has shown repeated rejections near this level, indicating potential for a bearish reversal.
The entry at 0.65239 is strategically positioned just below resistance, allowing traders to catch the move early before momentum builds.
The first target at 0.65150 is a short-term intraday support level and offers a quick, low-risk profit opportunity.
The second target of 0.65000 is a psychologically important level and a common magnet for price action in downward trends.
The third target at 0.64890 aligns with a previous swing low, making it a strong candidate for extended profit-taking if momentum continues.
The stop loss at 0.65340 is placed above the resistance and recent high to minimize losses while giving the trade enough room
AUDUSD(20250729)Today's AnalysisMarket news:
After gold prices soared to an all-time high of more than $3,500 an ounce in April, the latest report from the Commodity Futures Trading Commission (CFTC) showed that fund managers have increased their bullish bets to the highest level in 16 weeks.
Technical analysis:
Today's buy and sell boundaries:
0.6538
Support and resistance levels:
0.6610
0.6583
0.6566
0.6511
0.6493
0.6466
Trading strategy:
If the price breaks through 0.6538, consider buying, the first target price is 0.6566
If the price breaks through 0.6511, consider selling, the first target price is 0.6493

AU LongAUDUSD Entry
Entry @ break and retest of minor support/resistance and trendlines minor and 1H
TP1 where 1H and 4H PRZ share @ 0.66155 TP2 @ 0.66584
which also -27 on major structure fib
HH and HL showing on major structure, continuing the uptrend
Price retraced to 38.2, retesting 1H trendline

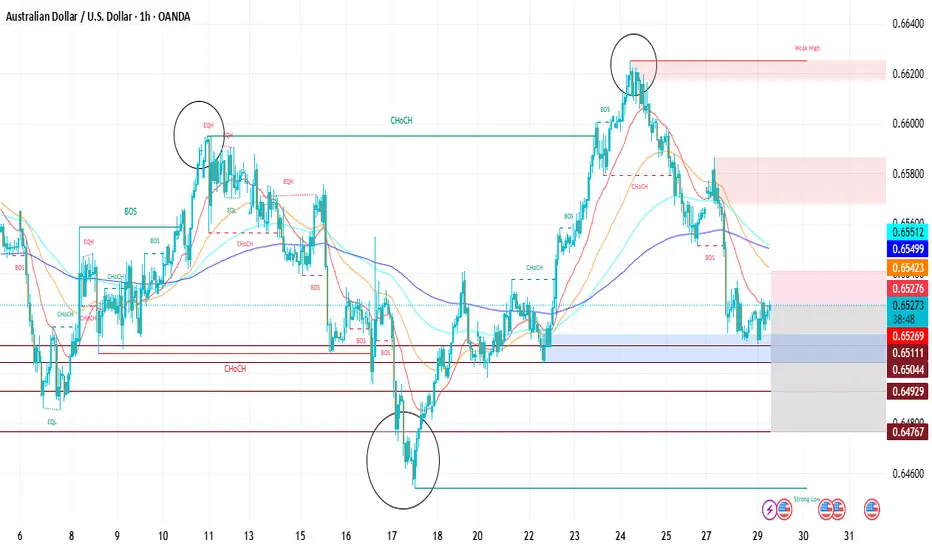
AUDUSD – DAILY FORECAST Q3 | W31 | D28 | Y25AUDUSD – DAILY FORECAST
Q3 | W31 | D28 | Y25
Daily Forecast 🔍📅
Here’s a short diagnosis of the current chart setup 🧠📈
Higher time frame order blocks have been identified — these are our patient points of interest 🎯🧭.
It’s crucial to wait for a confirmed break of structure 🧱✅ before forming a directional bias.
This keeps us disciplined and aligned with what price action is truly telling us.
📈 Risk Management Protocols
🔑 Core principles:
Max 1% risk per trade
Only execute at pre-identified levels
Use alerts, not emotion
Stick to your RR plan — minimum 1:2
🧠 You’re not paid for how many trades you take, you’re paid for how well you manage risk.
🧠 Weekly FRGNT Insight
"Trade what the market gives, not what your ego wants."
Stay mechanical. Stay focused. Let the probabilities work.
FX:AUDUSD


AUD/USD Sell SetupOANDA:AUDUSD
Timeframe: m30
Entry: 0.66151
SL: 0.66266
TP1: 0.66033
TP2: 0.65914
TP4: 0.65681
📊 Setup Rationale
🔺 Channel Top Rejection (8H Overlay) Price has touched the upper boundary of a descending channel visible on the 8-hour chart. This zone has historically acted as a strong resistance, increasing the probability of a reversal.
🧱 Local Structure (30min) Entry aligns with a minor double top (in lower TFs) and bearish momentum. The tight SL allows for a high R:R profile.
🔄 Momentum Shift Watch for bearish engulfing or rejection wick on lower timeframes to confirm entry.
#MJTrading #Forex #AUDUSD #Sell
Psychology always matters:

AUDUSD.JULY 29TH
Bureau of Labor Statistics will publish will JOLTS which measures the Number of job openings during the reported month, excluding the farming industry;
JOLTS Job Openings CB Consumer Confidence forecast 95.9 previous 93.0 .market will watch for data report for clear directional bias .
wednesday 30th
Australian Bureau of Statistics will publish the Consumer price index which Measures Change in the price of goods and services purchased by consumers
'Actual' greater than 'Forecast or below will be watched for clear directional bias .
this data are Frequency Released quarterly, about 25 days after the quarter ends;
and the next report will be on Oct 30, 2025
Consumer prices account for a majority of overall inflation. Inflation is important to currency valuation because rising prices lead the central bank to raise interest rates out of respect for their inflation containment mandate of 2%
Aud CPI q/q forecast 0.8% previous 0.9%
AUD CPI y/y forecast 2.1% previous 2.1%
AUD Trimmed Mean CPI q/q forecast 0.7% previous 0.7%
USD 1:15pm
1:15pm USD ADP Non-Farm Employment Change forecast 82K previous -33K
Advance GDP q/q forecast 2.4% previous -0.5%
Advance GDP Price Index q/q forecst 2.3% previous 3.8%
Pending Home Sales m/m forecast 0.3% previous 1.8%
USD Crude Oil Inventories-3.2M
by 7pm USD Federal Funds Rate previous 4.50% 4.50%
FOMC Statement
7:30pm FOMC Press Conference.
watchout for federal fund rate data report and FOMC (federal open market committee)
NOTE;TRADING ANAY INSTRUMENT IS 100% PROBABILTY ,ANY KEY LEVEL CAN FAIL YOU,DONT EVER TRADE WITH ALL YOUR CAPITAL BECAUSE YOU MENTOR SAY BUY OR SELL.
TRADING IS 100% PROBABILTY AND NO STRATEGY IS PERFECT.
TRADE WITH CAUTION.
WISH A HAPPY NEW WEEK.
BYE.

AUD/USD - Breakout (25.07.2025)The AUD/USD Pair on the M30 timeframe presents a Potential Selling Opportunity due to a recent Formation of a Trendline Pattern. This suggests a shift in momentum towards the downside in the coming hours.
Possible Short Trade:
Entry: Consider Entering A Short Position around Trendline Of The Pattern.
Target Levels:
1st Support – 0.6551
2nd Support – 0.6513
🎁 Please hit the like button and
🎁 Leave a comment to support for My Post !
Your likes and comments are incredibly motivating and will encourage me to share more analysis with you.
Best Regards, KABHI_TA_TRADING
Thank you.
Disclosure: I am part of Trade Nation's Influencer program and receive a monthly fee for using their TradingView charts in my analysis.
