AUDUSD is BullishPrice was in a downtrend, however after the formation of a double bottom a higher high is printed which is an indication of the beginning of a bullish trend. Once the freshly printed higher high is broken we can expect continuation of the bullish trend as per Dow theory. Targets are mentioned on the chart.
AUDUSD trade ideas

AUDUSD SHORT FORECAST Q3 D10 W28 Y25AUDUSD SHORT FORECAST Q3 D10 W28 Y25
Professional Risk Managers👋
Welcome back to another FRGNT chart update📈
Diving into some Forex setups using predominantly higher time frame order blocks alongside confirmation breaks of structure.
Let’s see what price action is telling us today! 👀
💡Here are some trade confluences📝
✅Daily Order block identified
✅4H Order Block identified
✅1H Order Block identified
🔑 Remember, to participate in trading comes always with a degree of risk, therefore as professional risk managers it remains vital that we stick to our risk management plan as well as our trading strategies.
📈The rest, we leave to the balance of probabilities.
💡Fail to plan. Plan to fail.
🏆It has always been that simple.
❤️Good luck with your trading journey, I shall see you at the very top.
🎯Trade consistent, FRGNT X

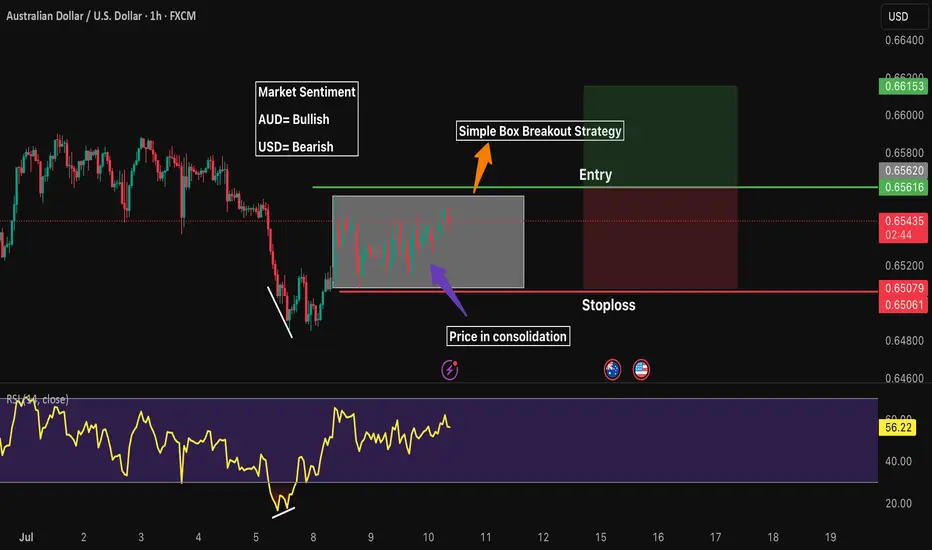
AUDUSD 1H LongMarket Sentiment
AUD= Bullish
USD= Bearish
Waiting for price to breakout from its consolidation box
RR 1:1
Buy AUDI see a W on weekly pivot at the 1H chart
price in 1D seems in up trend and RR is good. lets see

AUD/USD Struggles at ResistanceAUD/USD is now nearly 1.6% off the highs with the weekly opening-range taking shape just below Fibonacci resistance- looking for a potential breakout in the days ahead.
A look at Aussie price action shows AUD/USD reversing pitchfork resistance with the weekly opening-range taking shape just below resistance at the 61.8% retracement of the 2024 decline / weekly open at 6550/53- looking for a reaction off this mark.
A top-side breach of the weekly opening-range exposes the upper parallel again, currently near ~6600. Ultimately, a close above the September low at 6622 is needed to fuel the next major leg of the advance with subsequent resistance objectives eyed at the 2019 low at 6671 and the 78.6% retracement near 6723.
Initial support rests with the June low-day close (LDC) at 6458- note that the 75% parallel converges on this threshold into the close of the week and a break / close below would threaten a larger Aussie pullback. Subsequent support objectives rest at the 200-day moving average (currently ~6411) and 6332/62- a region defined by the 38.2% retracement of the yearly range, the April / August 2024 lows, and the May swing low. Losses beyond this threshold would suggest a more significant high is in place / larger reversal is underway.
Bottom line: The Aussie rally failed into the trendline resistance with the monthly opening-range taking shape just below. While the broader outlook is still constructive, the advance remains vulnerable here and the immediate focus is on a breakout of the weekly range (6486-6553) for guidance. From a trading standpoint, losses would need to be limited to 6458 IF Aussie is heading for a breakout on this stretch with a close above 6622 needed to mark uptrend resumption.
-MB

Could the Aussie reverse from here?The price is rising towards the resistance level which is a pullback resistance that lines up with the 61.8% Fibonacci retracement and could drop from this level to our take profit.
Entry: 0.6650
Why we like it:
There is a pullback resistance that lines up with the 61.8% Fibonacci retracement.
Stop loss: 0.6588
Why we like it:
There is a pullback resistance.
Take profit: 0.6481
Why we like it:
There is a pullback support.
Enjoying your TradingView experience? Review us!
Please be advised that the information presented on TradingView is provided to Vantage (‘Vantage Global Limited’, ‘we’) by a third-party provider (‘Everest Fortune Group’). Please be reminded that you are solely responsible for the trading decisions on your account. There is a very high degree of risk involved in trading. Any information and/or content is intended entirely for research, educational and informational purposes only and does not constitute investment or consultation advice or investment strategy. The information is not tailored to the investment needs of any specific person and therefore does not involve a consideration of any of the investment objectives, financial situation or needs of any viewer that may receive it. Kindly also note that past performance is not a reliable indicator of future results. Actual results may differ materially from those anticipated in forward-looking or past performance statements. We assume no liability as to the accuracy or completeness of any of the information and/or content provided herein and the Company cannot be held responsible for any omission, mistake nor for any loss or damage including without limitation to any loss of profit which may arise from reliance on any information supplied by Everest Fortune Group.

China's PPI slides, Australian dollar steadyThe Australian dollar is almost unchanged on Wednesday. In the European session, AUD/USD is trading at 0.6532, up 0.03% on the day.
China's producer price index surprised on the downside in June, with a steep 3.6% y/y decline. TThe soft PPI report was driven by weak domestic demand and the continuing uncertainty over US tariffs. The lack of consumer demand was reflected in the weak CPI reading of 0.1% y /y, the first gain in four months. Monthly, CPI declined by 0.1%, following a 0.2% drop in May. There was a silver lining as core CPI rose 0.7% y/y, the fastest pace in 14 months.
The uncertainty over US President Trump's tariff policy continues to perplex the financial markets. Trump had promised a new round of tariffs against a host of countries on July 9 but he has delayed that deadline until August 1.
China, the world's second-largest economy after the US, has taken a hit from US tariffs, as China's exports to the US are down 9.7% this year, However, China has mitigated much of the damage as China's exports to the rest of the world are up 6%. There is a trade truce in effect between the two countries but the bruising trade war will continue to dampen US-China trade.
With no tier-1 events out of the US today, the FOMC minutes of the June meeting will be on center stage. The Fed held rates at that meeting and Fed Chair Powell, who has taken a lot of heat from Donald Trump to cut rates, defended his wait-and-see-attitude, citing the uncertainty that Trump's tariffs are having on US growth and inflation forecasts.his was below the May decline of 3.3% and the consensus of -3.2%. China has posted producer deflation for 33 successive months and the June figure marked the steepest slide since July 2023. Monthly, PPI declined by 0.4%, unchanged over the past three months.

AUDUSD1 Hour chart: Price made a bearish impulse and it broke out of a recent structure level, price is currently testing the broken structure and it's forming a bearish correction.

AUDUSD 4H: Sell Zone Confirmed📉 AUDUSD Analysis – Current Trend & Trade Opportunity
Hello Traders,
I’ve prepared an updated analysis for the AUDUSD pair.
At the moment, AUDUSD has shifted out of its previous bullish structure and has now entered a bearish trend. Based on this shift, I’m planning to enter a limit sell trade at the level shared below:
🔹 Limit Sell Entry: 0.65232
🔹 Stop Loss: 0.65576
🔹 Targets:
• TP1: 0.64591
• TP2: 0.64591
• TP3: 0.63738
🔸 Risk/Reward Ratio: 4.27
Considering the trend reversal, I’m looking to open a position from these levels.
I meticulously prepare these analyses for you, and I sincerely appreciate your support through likes. Every like from you is my biggest motivation to continue sharing my analyses.
I’m truly grateful for each of you—love to all my followers💙💙💙

correctionIt is expected that the trend change will form in the current support area and we will see the start of the upward trend.
If the price crosses the specified support levels, the continuation of the downward trend will be likely.

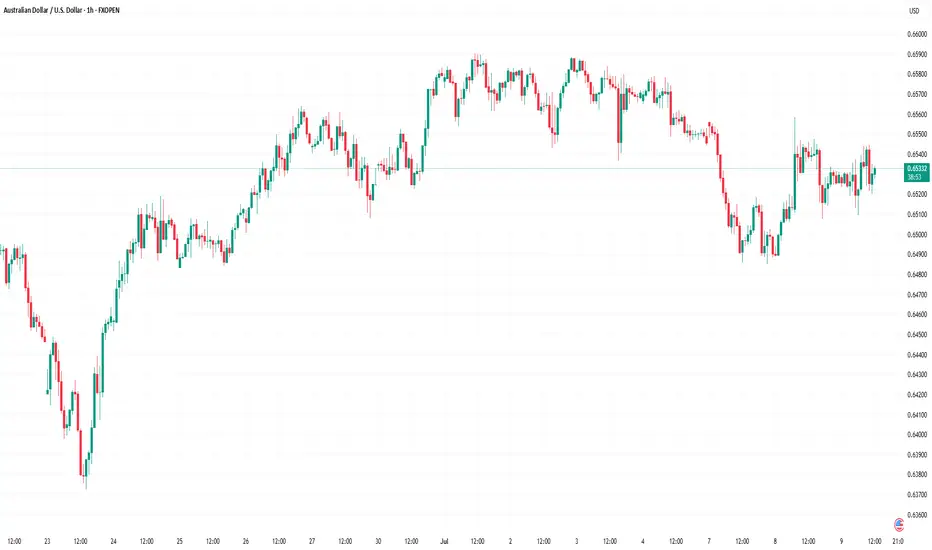
Market Analysis: AUD/USD Attempts Fresh ClimbMarket Analysis: AUD/USD Attempts Fresh Climb
AUD/USD is attempting a fresh increase from the 0.6485 support.
Important Takeaways for AUD/USD Analysis Today
- The Aussie Dollar found support at 0.6485 and recovered against the US Dollar.
- There is a key bearish trend line forming with resistance at 0.6535 on the hourly chart of AUD/USD at FXOpen.
AUD/USD Technical Analysis
On the hourly chart of AUD/USD at FXOpen, the pair started a fresh increase above 0.6550. The Aussie Dollar tested the 0.6585 zone before the bears appeared and pushed it lower against the US Dollar.
The pair declined below the 0.6560 and 0.6550 support levels. The recent low was formed at 0.6485 and the pair is rising again. The bulls pushed it above the 50% Fib retracement level of the downward move from the 0.6588 swing high to the 0.6485 low.
The pair is now consolidating above the 50-hour simple moving average. On the upside, the AUD/USD chart indicates that the resistance is near the 0.6535 zone. There is also a key bearish trend line forming at 0.6535.
The first major resistance might be 0.6550 and the 61.8% Fib retracement level. An upside break above it might send the pair further higher. The next major resistance is near the 0.6560 level. Any more gains could clear the path for a move toward the 0.6585 resistance zone.
If not, the pair might correct lower. Immediate support sits near the 0.6510 level. The next support could be 0.6485. If there is a downside break below 0.6485, the pair could extend its decline toward the 0.6440 zone. Any more losses might signal a move toward 0.6420.
This article represents the opinion of the Companies operating under the FXOpen brand only. It is not to be construed as an offer, solicitation, or recommendation with respect to products and services provided by the Companies operating under the FXOpen brand, nor is it to be considered financial advice.
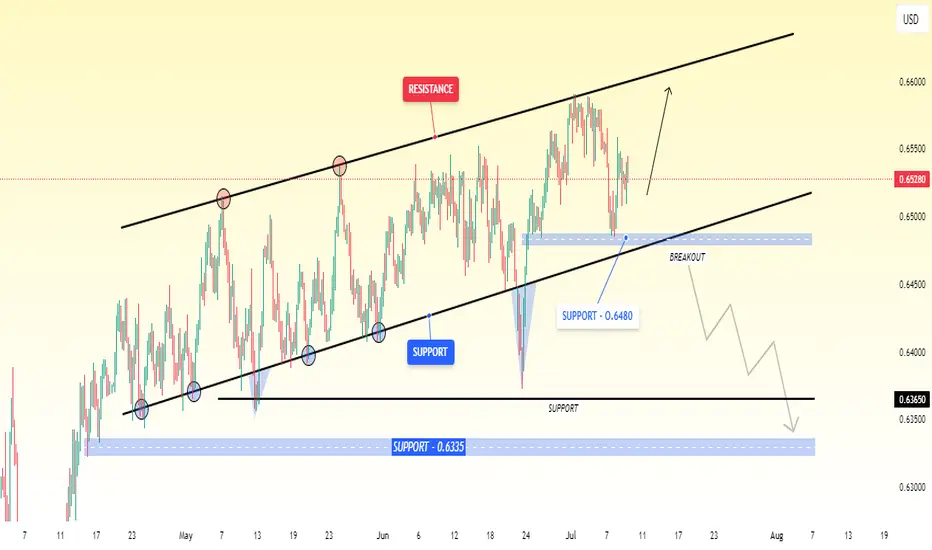
AUD/USD Maintains Upward Momentum Within Rising ChannelThe AUD/USD currency pair is currently moving within an rising channel and appears to be heading toward the upper resistance line of the trend.
However, if the price breaks below the first support level at 0.6480, it may signal a reversal, and the pair could start to decline. In that case, the next key support levels where the price might find buying interest or stabilize are around 0.6365 and 0.6335.
AUDUSD Will Move Lower! Short!
Take a look at our analysis for AUDUSD.
Time Frame: 12h
Current Trend: Bearish
Sentiment: Overbought (based on 7-period RSI)
Forecast: Bearish
The market is on a crucial zone of supply 0.653.
The above-mentioned technicals clearly indicate the dominance of sellers on the market. I recommend shorting the instrument, aiming at 0.649 level.
P.S
Overbought describes a period of time where there has been a significant and consistent upward move in price over a period of time without much pullback.
Disclosure: I am part of Trade Nation's Influencer program and receive a monthly fee for using their TradingView charts in my analysis.
Like and subscribe and comment my ideas if you enjoy them!

AUDUSD STARTED FORMING BEARISH TREND STRUCTUREAUDUSD STARTED FORMING BEARISH TREND STRUCTURE
Price started forming lower low, which indicates bearish trend.
price is expected to remain bearish in upcoming trading sessions.
on lower side market may hit the targets of 0.64500 & 0.63800.
On higher side 0.65900 level can act as a important resistance level.

AUDUSD STARTED FORMING BEARISH TREND STRUCTUREThe AUD/USD pair has recently begun forming a bearish trend structure, signaling a potential continuation of downward momentum in the coming trading sessions. This shift in market sentiment is evident as the price has started printing lower lows, a key characteristic of a bearish trend. Lower lows indicate that sellers are gaining control, pushing the exchange rate downward with each successive decline. Traders and investors should remain cautious, as this pattern suggests further downside potential unless a significant reversal occurs.
On the lower side, the market is expected to test key support levels at 0.64500 and 0.63800. These levels may act as critical zones where buyers could attempt to step in, but if selling pressure persists, a breakdown could lead to an extended decline. A breach below these supports may open the door for deeper losses, reinforcing the bearish outlook. Conversely, if the pair finds stability near these levels, a short-term bounce or consolidation could occur before the next directional move.
On the upside, 0.65900 stands as a crucial resistance level. Any bullish retracement towards this zone could attract fresh selling interest, capping upward movements. A sustained break above this resistance would be necessary to invalidate the current bearish structure, potentially shifting the trend towards neutrality or even bullish reversal. Until then, rallies towards this resistance may present selling opportunities for traders aligning with the prevailing downtrend.
In summary, the AUD/USD pair is exhibiting bearish tendencies, with lower lows confirming seller dominance. The immediate targets lie at 0.64500 and 0.63800, while 0.65900 serves as a key resistance to watch. Traders should monitor price action around these levels for potential bearish continuation or signs of a trend reversal. Risk management remains essential, as unexpected macroeconomic developments or shifts in market sentiment could alter the current trajectory.

Bearish drop off 61.8% Fibonacci resistance?The Aussie (AUD/USD) has rejected off the pivot, which acts as a pullback resistance, and could drop to the 1st support, which has been identified as an overlap support.
Pivot: 0.6550
1st Support: 0.6492
1st Resistance: 0.6590
Risk Warning:
Trading Forex and CFDs carries a high level of risk to your capital and you should only trade with money you can afford to lose. Trading Forex and CFDs may not be suitable for all investors, so please ensure that you fully understand the risks involved and seek independent advice if necessary.
Disclaimer:
The above opinions given constitute general market commentary, and do not constitute the opinion or advice of IC Markets or any form of personal or investment advice.
Any opinions, news, research, analyses, prices, other information, or links to third-party sites contained on this website are provided on an "as-is" basis, are intended only to be informative, is not an advice nor a recommendation, nor research, or a record of our trading prices, or an offer of, or solicitation for a transaction in any financial instrument and thus should not be treated as such. The information provided does not involve any specific investment objectives, financial situation and needs of any specific person who may receive it. Please be aware, that past performance is not a reliable indicator of future performance and/or results. Past Performance or Forward-looking scenarios based upon the reasonable beliefs of the third-party provider are not a guarantee of future performance. Actual results may differ materially from those anticipated in forward-looking or past performance statements. IC Markets makes no representation or warranty and assumes no liability as to the accuracy or completeness of the information provided, nor any loss arising from any investment based on a recommendation, forecast or any information supplied by any third-party.

aud/usdThe Australian Dollar and the US Dollar pair belong the Majors, a group of the most popular traded pairs in the world. This pair's popularity soared because traders were attracted to the interest rate differential of the pair. This has waned in recent years due to economic volatility worldwide.

AUDUSD InsightHello to all our subscribers, and welcome!
Please share your personal thoughts in the comments. Don’t forget to like and subscribe.
Key Points
- U.S. President Donald Trump stated ahead of a cabinet meeting at the White House that he will announce tariffs on semiconductors, pharmaceuticals, and several other items, adding that pharmaceuticals could face tariffs of up to 200%.
- The European Union has not yet received a formal tariff notice from Trump. However, it is reportedly considering a possible agreement to maintain a base tariff rate of 10%.
- Michele Bullock, Governor of the Reserve Bank of Australia, remarked, “I don’t think inflation is sustainably low—I actually believe it is still higher.”
Key Economic Events This Week
+ July 9: FOMC Meeting Minutes Release
+ July 10: Germany June CPI
+ July 11: U.K. May GDP
AUDUSD Chart Analysis
The recent uptrend has temporarily paused around the 0.66000 level. However, the pair is expected to resume its upward momentum in the 0.64700–0.65000 zone. Once the bullish trend resumes, it is likely to rise smoothly toward the 0.67000 level, although minor resistance is expected at 0.67000, which could trigger a short-term pullback. In the longer term, the pair is still projected to rise toward the 0.69000 level.

AUD/USD ORB LONGAUSSIE TRADER
Based on yesterdays price action, we are targeting yesterdays RBA news High
1-3 RR
Don't risk your rent money on these trades, it aint worth it!

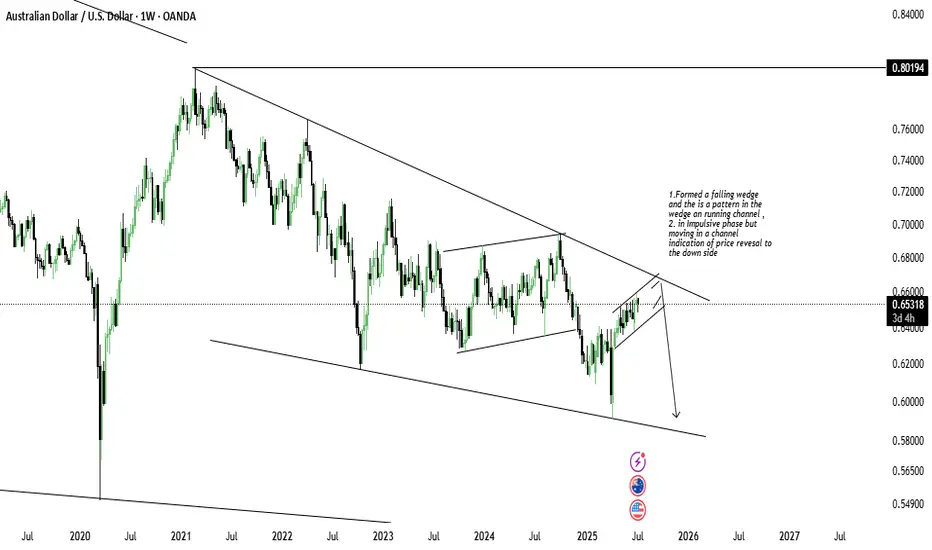
Future sells on AUDUSD 1.Formed a falling wedge and the is a pattern in the wedge an running channel ,
2. in Impulsive phase but moving in a channel indication of price revesal to the down side
Australian dollar stabilizes after RBA's surpriseThe Australian dollar is in positive territory after a three-day skid, declining 1.5%. In the North American session, AUD/USD is trading at 0.6532, up 0.50% on the day. The Australian dollar rose as much as 0.95% earlier before retreating.
The Reserve Bank of Australia blindslided the markets on Tuesday as the central bank held the cash rate at 3.85%. The markets had priced in a quarter-point cut at 96%, but the RBA had the last laugh. For the first time, the RBA published the vote tally, which was 6-3 in favor of maintaining the rate.
The rate statement was cautious, as members said "there are uncertainties about the outlook for domestic economic activity and inflation".
Governor Bullock tried to calm the markets, saying that the decision was about "timing rather than direction" and that the Bank would "wait a few weeks" to confirm that inflation was on track to ease and remain sustainably around 2.5%. Bullock said that "we don't want to end up having to fight inflation again".
Inflation is moving in the right direction but the RBA wants to see the second-quarter inflation report on July 30, ahead of the rate decision on Aug. 12. Headline CPI in May eased to 2.1% y/y from 2.4% in April. The core rate dropped to 2.8% from 2.4% in April, the lowest rate since early 2022.
The RBA will be hoping that waiting till August will provide some clarity with regard to US tariff policy. President Trump has pledged new tariffs against various countries but this move is not expected to have much impact on Australia's economy.
AUD/USD is testing resistance at 0.6513. Above, there is resistance at 0.6541
There is support at 0.6463 and 0.6435

Australian dollar stabilizes after RBA's surprise The Australian dollar is in positive territory after a three-day skid, declining 1.5%. In the North American session, AUD/USD is trading at 0.6532, up 0.50% on the day. The Australian dollar rose as much as 0.95% earlier before retreating.
The Reserve Bank of Australia blindslided the markets on Tuesday as the central bank held the cash rate at 3.85%. The markets had priced in a quarter-point cut at 96%, but the RBA had the last laugh. For the first time, the RBA published the vote tally, which was 6-3 in favor of maintaining the rate.
The rate statement was cautious, as members said "there are uncertainties about the outlook for domestic economic activity and inflation".
Governor Bullock tried to calm the markets, saying that the decision was about "timing rather than direction" and that the Bank would "wait a few weeks" to confirm that inflation was on track to ease and remain sustainably around 2.5%. Bullock said that "we don't want to end up having to fight inflation again".
Inflation is moving in the right direction but the RBA wants to see the second-quarter inflation report on July 30, ahead of the rate decision on Aug. 12. Headline CPI in May eased to 2.1% y/y from 2.4% in April. The core rate dropped to 2.8% from 2.4% in April, the lowest rate since early 2022.
The RBA will be hoping that waiting till August will provide some clarity with regard to US tariff policy. President Trump has pledged new tariffs against various countries but this move is not expected to have much impact on Australia's economy.
AUD/USD is testing resistance at 0.6513.
Above, there is resistance at 0.6541
There is support at 0.6463 and 0.6435

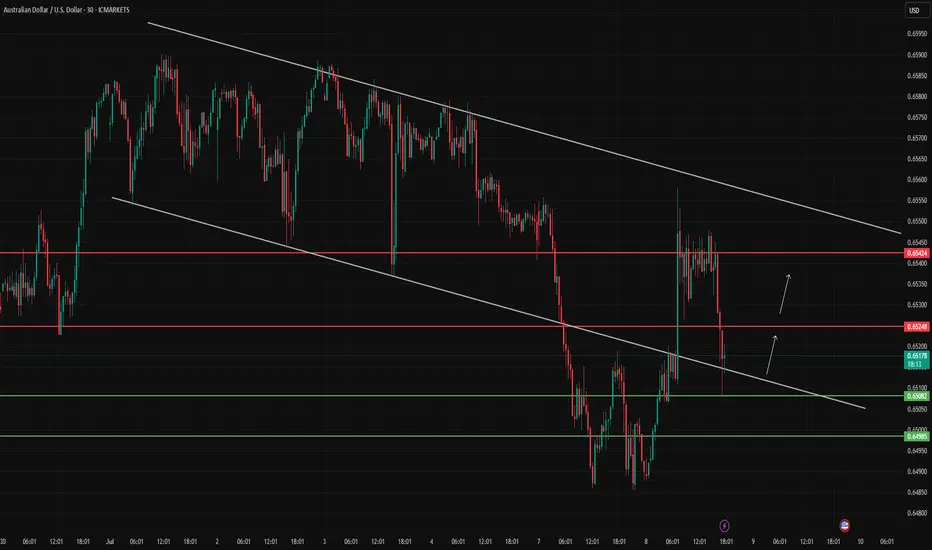
AUDUSD – Watching for a Channel ReboundAUDUSD is testing key support at the lower boundary of the descending channel. Eyes on 0.65248 and 0.65424 as potential rebound targets.