Bullish continuation?AUD/USD is falling towards the support level which is a pullback support that aligns with the 61.8% Fibonacci retracement and could bounce from this level to our take profit.
Entry: 0.6499
Why we like it:
There is a pullback support level that lines up with the 61.8% Fibonacci retracement.
Stop loss: 0.6483
Why we like it:
There is a pullback support level.
Take profit: 0.6537
Why we like it:
There is a pullback resistance level.
Enjoying your TradingView experience? Review us!
Please be advised that the information presented on TradingView is provided to Vantage (‘Vantage Global Limited’, ‘we’) by a third-party provider (‘Everest Fortune Group’). Please be reminded that you are solely responsible for the trading decisions on your account. There is a very high degree of risk involved in trading. Any information and/or content is intended entirely for research, educational and informational purposes only and does not constitute investment or consultation advice or investment strategy. The information is not tailored to the investment needs of any specific person and therefore does not involve a consideration of any of the investment objectives, financial situation or needs of any viewer that may receive it. Kindly also note that past performance is not a reliable indicator of future results. Actual results may differ materially from those anticipated in forward-looking or past performance statements. We assume no liability as to the accuracy or completeness of any of the information and/or content provided herein and the Company cannot be held responsible for any omission, mistake nor for any loss or damage including without limitation to any loss of profit which may arise from reliance on any information supplied by Everest Fortune Group.
AUDUSD_ZERO trade ideas

AUD/USD Bulls Capped by Critical Resistance Aussie is trading into a critical resistance range into the start of the week at 6511/50- a region defined by the July close low and the 61.8% retracement of the 2024 decline. Note that the 75% parallel converges on this threshold this week – looking for possible inflection here with the near-term rally vulnerable while below.
A topside breach exposes a potential run towards the upper parallel / September low at 66222 and the 2019 low at 6670. Initial support rests with 52-week moving average and is backed by the February high-week close (HWC) at 6357. A break / close below the low-week close (LWC) / 38.2% retracement of the yearly range at 6290-6300 is needed to mark resumption of the broader downtrend.
-MB


Pinex-Capital Trade IdeaThe chart shows a bullish daily structure with a higher volume range and positive momentum. The first long idea is based on a pullback to the value area high or the 0.5 Fibonacci zone around 0.6498. Should the market test this area and show buyers there, this would be an opportunity for a long entry with a target in the area of the recent high at 0.6538. The stop can be placed slightly below the 0.618 level at 0.6484.
A second long opportunity arises on a breakout above the recent high at 0.6538. If the price breaks above this zone with volume and stabilizes there, a procyclical long can be entered with a target towards 0.6560+ (next psychological level). The stop should be placed just below the breakout level.

Pinex-Capital Trade IdeaThe second chart shows a bullish daily structure with a higher volume range and positive momentum. The first long idea is based on a pullback to the value area high or the 0.5 Fibonacci zone around 0.6498. Should the market test this area and show buyers there, this would be an opportunity for a long entry with a target in the area of the recent high at 0.6538. The stop can be placed slightly below the 0.618 level at 0.6484.
A second long opportunity arises on a breakout above the recent high at 0.6538. If the price breaks above this zone with volume and stabilizes there, a procyclical long can be entered with a target towards 0.6560+ (next psychological level). The stop should be placed just below the breakout level.

Pines-Capital Trade IdeaThe second chart shows a bullish daily structure with a higher volume range and positive momentum. The first long idea is based on a pullback to the value area high or the 0.5 Fibonacci zone around 0.6498. Should the market test this area and show buyers there, this would be an opportunity for a long entry with a target in the area of the recent high at 0.6538. The stop can be placed slightly below the 0.618 level at 0.6484.
A second long opportunity arises on a breakout above the recent high at 0.6538. If the price breaks above this zone with volume and stabilizes there, a procyclical long can be entered with a target towards 0.6560+ (next psychological level). The stop should be placed just below the breakout level.

Pines-Capital Trade IdeaThe chart shows a bullish daily structure with a higher volume range and positive momentum. The first long idea is based on a pullback to the value area high or the 0.5 Fibonacci zone around 0.6498. Should the market test this area and show buyers there, this would be an opportunity for a long entry with a target in the area of the recent high at 0.6538. The stop can be placed slightly below the 0.618 level at 0.6484.
A second long opportunity arises on a breakout above the recent high at 0.6538. If the price breaks above this zone with volume and stabilizes there, a procyclical long can be entered with a target towards 0.6560+ (next psychological level). The stop should be placed just below the breakout level.

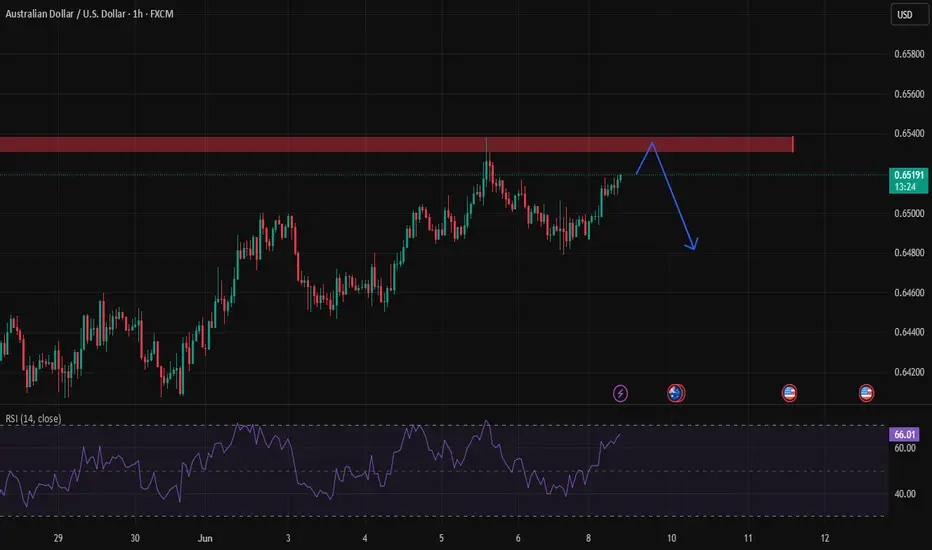
AUD/USD Bearish Setup – Key Rejection🔍 Market Context:
AUD/USD has shown an ascending structure followed by a potential bearish divergence. The recent high around 0.65437 is marked as the Invalidation Level — a break and close above this level would invalidate the current bearish scenario.
📌 Key Levels:
Resistance / Invalidation Zone: 0.65437
Support Target Zone: Near 0.64000
---
📉 Bearish Scenario:
Price is expected to reject the resistance zone and move downward based on the current structure and possible exhaustion of bullish momentum. The red projected path illustrates a potential move lower if price fails to break above the invalidation level.
---
📛 Disclaimer:
This analysis is for educational and informational purposes only. It does not constitute financial advice or a trading recommendation. All trading involves risk. Please conduct your own analysis or consult a financial advisor before making trading decisions.

AUDUSD HTF AccumulationAUDUSD is forming a high time frame accumulation model. If the range high does not get taken out first i will look for a model 2 from extreme demand or another deviation of the low, preferably into the 1D demand, for a model 1 to get a rotation back to the range high.

AUDUSDTechnical Analysis:
Trend Context:
On H4 and Daily, AUD/USD is in a downtrend or corrective phase within a broader bearish structure.
Recent rallies have failed to break key resistance at 0.6550-0.6560, forming a double top/weak continuation.
Key Levels:
Resistance Zone: 0.6550 – 0.6565
Support Zone: 0.6460 – 0.6440
Next Major Support: 0.6400 (if 0.6460 breaks)
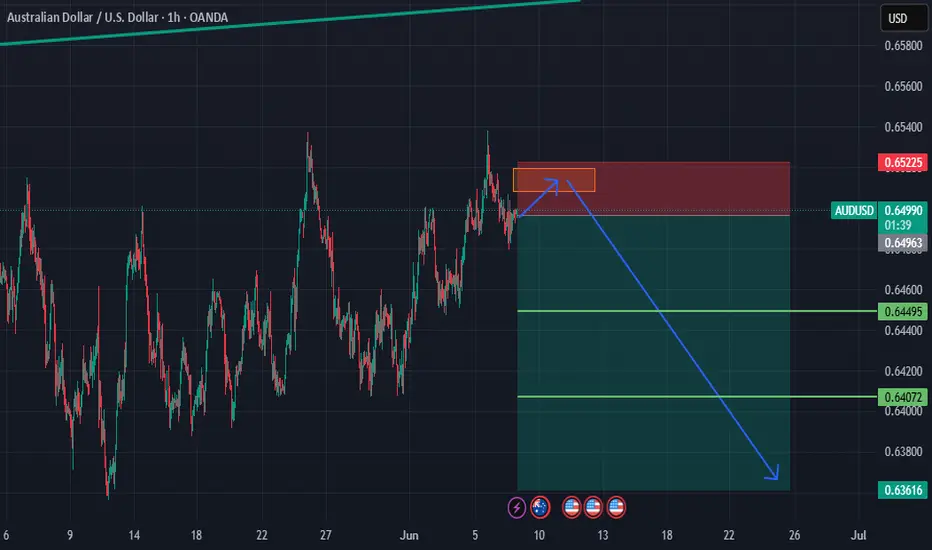
Trade Setup: AUD/USD Short at 0.65256
🔻 Position: Sell AUD/USD
🔹 Entry Price: 0.65256
🎯 Target: 0.64600 (Initial TP)
🛑 Stop-Loss: 0.65580
🔧 Risk:Reward Ratio: ~1:2

AUDUSD BULLISH OR BEARISH DETAILED ANALYSISAUDUSD is currently forming a strong ascending triangle on the 8H chart, with a series of higher lows pressuring a key horizontal resistance zone around 0.65250–0.65300. This is a classic bullish continuation pattern, indicating buyer strength and a potential breakout toward 0.67000 if the structure confirms. The current price action at 0.65285 shows that bulls are testing the upper boundary again, signaling possible breakout acceleration as we move into mid-June volatility.
From a macro standpoint, the Australian dollar is supported by rising commodity demand, particularly in iron ore and copper — both of which are showing strength in global markets. At the same time, the Federal Reserve remains cautious with its rate path, with recent U.S. labor data pointing to a cooling job market. Traders are now pricing in possible rate cuts sooner than expected, weakening the dollar’s bullish grip. This divergence in central bank tone and economic performance favors risk-on currencies like the AUD.
Technically, the ascending triangle is providing solid structure and confluence. Breakout traders may look for a clean candle close above 0.65350, which could open the path to the 0.67000 zone with minimal resistance ahead. A well-placed stop below the 0.64500 zone keeps risk controlled, and the favorable risk-to-reward ratio makes this setup ideal for swing continuation strategies in trending environments.
This pattern has been building over several weeks, showing market accumulation and strong bullish compression. With today's fundamentals aligning with the technical structure, AUDUSD looks ready to launch into a higher bullish leg. Keep eyes on the breakout candle and volume confirmation as we may be entering a powerful momentum phase toward the 0.67 handle.

AUDUSD follow the ascending channel bullish now from key demand 📈 AUD/USD Technical Outlook – 1H Timeframe
The AUD/USD pair continues to trade within a bullish ascending channel, rebounding strongly from the key support zone at 0.64800. Momentum remains positive, signaling potential for further upside.
🎯 Next Technical Target:
1st Resistance: 0.65200
Traders should monitor price action near this level for potential breakout or rejection signals.
🔍 Stay tuned for more real-time updates, insights, and setups.
👉 Like, follow, comment, and join the community for daily market analysis and trading ideas!
— Livia 😜

Aussie H1 | Rising into a swing-high resistanceThe Aussie (AUD/USD) is rising towards a swing-high resistance and could potentially reverse off this level to drop lower.
Sell entry is at 0.6526 which is a swing-high resistance.
Stop loss is at 0.6547 which is a level that sits above the 61.8% Fibonacci projection and a multi-swing-high resistance.
Take profit is at 0.6502 which is an overlap support.
High Risk Investment Warning
Trading Forex/CFDs on margin carries a high level of risk and may not be suitable for all investors. Leverage can work against you.
Stratos Markets Limited (tradu.com ):
CFDs are complex instruments and come with a high risk of losing money rapidly due to leverage. 63% of retail investor accounts lose money when trading CFDs with this provider. You should consider whether you understand how CFDs work and whether you can afford to take the high risk of losing your money.
Stratos Europe Ltd (tradu.com ):
CFDs are complex instruments and come with a high risk of losing money rapidly due to leverage. 63% of retail investor accounts lose money when trading CFDs with this provider. You should consider whether you understand how CFDs work and whether you can afford to take the high risk of losing your money.
Stratos Global LLC (tradu.com ):
Losses can exceed deposits.
Please be advised that the information presented on TradingView is provided to Tradu (‘Company’, ‘we’) by a third-party provider (‘TFA Global Pte Ltd’). Please be reminded that you are solely responsible for the trading decisions on your account. There is a very high degree of risk involved in trading. Any information and/or content is intended entirely for research, educational and informational purposes only and does not constitute investment or consultation advice or investment strategy. The information is not tailored to the investment needs of any specific person and therefore does not involve a consideration of any of the investment objectives, financial situation or needs of any viewer that may receive it. Kindly also note that past performance is not a reliable indicator of future results. Actual results may differ materially from those anticipated in forward-looking or past performance statements. We assume no liability as to the accuracy or completeness of any of the information and/or content provided herein and the Company cannot be held responsible for any omission, mistake nor for any loss or damage including without limitation to any loss of profit which may arise from reliance on any information supplied by TFA Global Pte Ltd.
The speaker(s) is neither an employee, agent nor representative of Tradu and is therefore acting independently. The opinions given are their own, constitute general market commentary, and do not constitute the opinion or advice of Tradu or any form of personal or investment advice. Tradu neither endorses nor guarantees offerings of third-party speakers, nor is Tradu responsible for the content, veracity or opinions of third-party speakers, presenters or participants.

Aussie Weekly overviewHello Traders,
Be more cautious for short trades from 0.65031
************************************************************
The indicated levels are determined based on the most reaction points and the assumption of approximately equal distance between the zones.
Some of these points can also be confirmed by the mathematical intervals of Murray.
You can enter with/without confirmation. IF you want to take confirmation you can use LTF analysis, Spike move confirmation, Trend Strength confirmation and ETC.
SL could be placed below the zone or regarding the LTF swings.
TP is the next zone or the nearest moving S&R, which are median and borders of the drawn channels.
*******************************************************************
Role of different zones:
GREEN: Just long trades allowed on them.
RED: Just Short trades allowed on them.
BLUE: both long and short trades allowed on them.
WHITE: No trades allowed on them! just use them as TP points

audusd sell signal. Don't forget about stop-loss.
Write in the comments all your questions and instruments analysis of which you want to see.
Friends, push the like button, write a comment, and share with your mates - that would be the best THANK YOU.
P.S. I personally will open entry if the price will show it according to my strategy.
Always make your analysis before a trade

AUD Bulls Charge on China CPI & Trade HopesOANDA:AUDUSD is trading near 0.6510, buoyed by China’s better-than-expected May CPI print at -0.1% YoY (vs forecast of -0.4%) and optimism over the renewed U.S.-China trade dialogue, which has improved global risk sentiment.
Despite weak CMCMARKETS:AUDUSD Australian Q1 GDP and a narrower trade surplus, the Aussie remains firm as a proxy for Chinese demand and commodity-linked risk appetite.
From a technical perspective, the pair is moving within an ascending hourly channel and is currently testing key resistance at 0.6517. A confirmed breakout could clear the path toward monthly resistance at 0.6582. However, failure to break higher may see a pullback to 0.6492, or deeper to the critical support at 0.6411. As long as the channel structure remains intact, the bias stays bullish.
Resistance : 0.6517 , 0.6582
Support : 0.6492 , 0.6411

AUD/USD -LONGbreak and retest of 1 hr structure
pull back on minor structure
#1 market structure
# 2 trends
#3 break an retest

audusd for sell *The content on this analysis is subject to change at any time without notice, and is provided for the sole purpose of assisting traders to make independent investment decisions.
Week of 6/8/25: AU AnalysisLast week swept the high of the prior week and immediately got rejected. We are expecting that the low that swept the high is weak on the HTF and will be following 1h internal structure bearish until the low is at least taken out.
Major news:
Core CPI - Wednesday

AUD/USDAs you can see price has accumulated, Manipulated and is now in a distribution faze.
I do not look to enter into this market as i would be breaking my own rules so i am letting this one play out and will look for further opportunities once this move is complete.

Bearish drop?AUD/USD is reacting off the resistance level which is an overlap resistance that aligns with the 38.2% Fibonacci retracement and could drop from this level to our take profit.
Entry: 0.6499
Why we like it:
There is an overlap resistance level that lines up with the 38.2% Fibonacci retracement.
Stop loss: 0.6517
Why we like it:
There is a pullback resistance level that lines up with the 61.8% Fibonacci retracement.
Take profit: 0.6471
Why we like ot:
There is a pullback support level that aligns with the 50% Fibonacci retracement.
Enjoying your TradingView experience? Review us!
Please be advised that the information presented on TradingView is provided to Vantage (‘Vantage Global Limited’, ‘we’) by a third-party provider (‘Everest Fortune Group’). Please be reminded that you are solely responsible for the trading decisions on your account. There is a very high degree of risk involved in trading. Any information and/or content is intended entirely for research, educational and informational purposes only and does not constitute investment or consultation advice or investment strategy. The information is not tailored to the investment needs of any specific person and therefore does not involve a consideration of any of the investment objectives, financial situation or needs of any viewer that may receive it. Kindly also note that past performance is not a reliable indicator of future results. Actual results may differ materially from those anticipated in forward-looking or past performance statements. We assume no liability as to the accuracy or completeness of any of the information and/or content provided herein and the Company cannot be held responsible for any omission, mistake nor for any loss or damage including without limitation to any loss of profit which may arise from reliance on any information supplied by Everest Fortune Group.

Ideas for AUDUSD trades from Jun-8 to Jun-15/2025This is my AUDUSD trading idea for a week from Jun-8 to Jun-15/2025
Timeframe: D
Setup: either BB
Action: We need to wait for the candles accumulated near EMA21
