AUD/USD Trade Zone!Firstly, we are in a news market right now and news is everything to understanding price action.
After a busy international weekend, AUD/USD opened strong to the sell side. We got the first initial push down last week when Iran attacked Israel. Then, this weekend, Trump struck Iran.
With Trump striking Iran, markets opened bearish initially. After the good news of Iran and Israel coming to peace, we are seeing markets start to rebound a bit.
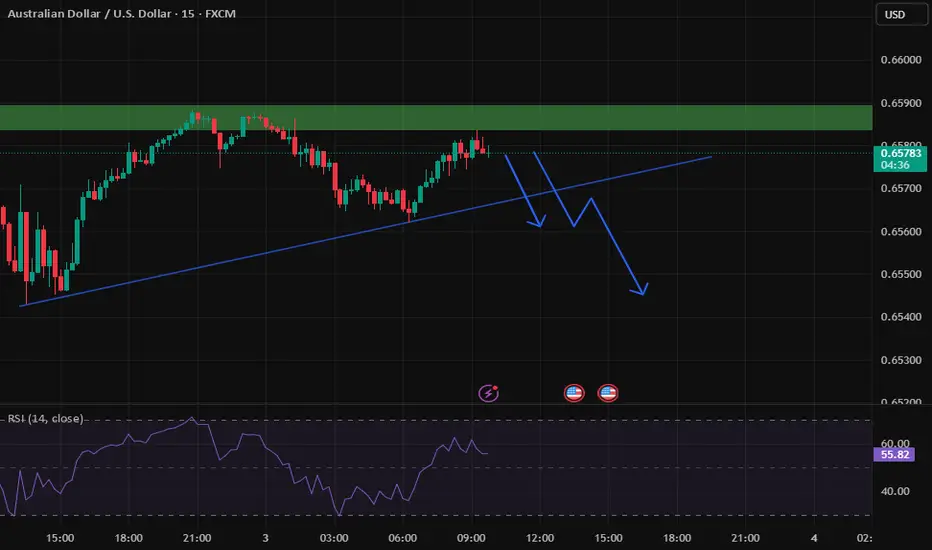
Where we are currently in the markets is a good structural spot to make some moves. The market has been following a downtrend structure following the Lower-Low, Lower-High pattern and we are currently at the next lower high if the market is going to respect its current market structure.
I am preparing for sells in an overbought market, which is unsure of future international tensions. I am either waiting for a structure break where the gold line indicates or for the market to respect the current structure to play to the low side.
I will be back with future updates.
AUDUSD_ZERO trade ideas

Nibbling some Aussie dollarsNever mind if I am late in the game. I think there is still some room for the Aussie dollars to rally.
I have indicated two potential profit targets.
Please DYODD
AUDUSD Buyers In Panic! SELL!
My dear subscribers,
AUDUSD looks like it will make a good move, and here are the details:
The market is trading on 0.6571 pivot level.
Bias - Bearish
My Stop Loss - 0.6603
Technical Indicators: Both Super Trend & Pivot HL indicate a highly probable Bearish continuation.
Target - 0.6511
About Used Indicators:
The average true range (ATR) plays an important role in 'Supertrend' as the indicator uses ATR to calculate its value. The ATR indicator signals the degree of price volatility.
Disclosure: I am part of Trade Nation's Influencer program and receive a monthly fee for using their TradingView charts in my analysis.
———————————
WISH YOU ALL LUCK


Ok we are short Price closed under support so we will wait for pullback to the green lines above 76 fib level and sell back down to the next support level which the 200 fib level orange lines on the bottom However 🤔 if price breaks above resistance the greennlines and closes above wait for pullback and buy it back-up to the next level of resistance
AUD/USD Approaches Key Resistance with Bullish Momentum IntactAUD/USD has extended its steady climb and is now challenging the 61.8% Fibonacci retracement level (0.6558) from the July–October 2023 decline. The pair is trading within a rising channel structure and has cleared both the 50-day (0.6457) and 200-day (0.6422) SMAs, confirming a medium-term bullish shift.
Price action remains constructive, with higher lows and rising support from the channel base suggesting consistent demand. A sustained break above the 0.6558 level could open the door toward the 78.6% Fib retracement at 0.6730, a level that also aligns with prior resistance from September 2023.
Momentum indicators support the advance. The RSI is at 61.77 and rising, but still comfortably below overbought levels, implying room for further upside. The MACD is marginally positive and could accelerate higher if price confirms a breakout above the 61.8% Fib barrier.
Traders will be watching whether the pair can hold above the confluence of the SMAs and the lower trendline of the channel. A failure here could expose downside toward 0.6420–0.6450. Otherwise, the bullish structure remains intact, with scope for a continuation higher into July.
-MW

AUDUSD SHORT FORECAST Q2 W26 D27 Y25AUDUSD SHORT FORECAST Q2 W26 D27 Y25
Professional Risk Managers👋
Welcome back to another FRGNT chart update📈
Diving into some Forex setups using predominantly higher time frame order blocks alongside confirmation breaks of structure.
Let’s see what price action is telling us today!
💡Here are some trade confluences📝
✅Daily order block
✅1H Order block
✅Intraday breaks of structure
✅4H Order block
🔑 Remember, to participate in trading comes always with a degree of risk, therefore as professional risk managers it remains vital that we stick to our risk management plan as well as our trading strategies.
📈The rest, we leave to the balance of probabilities.
💡Fail to plan. Plan to fail.
🏆It has always been that simple.
❤️Good luck with your trading journey, I shall see you at the very top.
🎯Trade consistent, FRGNT X

Quietly Building: A Major Options Position in August AUDEye-catching activity in August AUD options with a strike at 0.67 .
The break-even point for this portfolio sits slightly higher, at 0.674 — and judging by open interest, this is the largest position in play.
Quick reminder:
A break-even level like this could act as a synthetic put building zone by adding short futures to their positions. That means profit from downside moves — with limited risk .
But here’s the catch:
This setup alone doesn’t scream “buy” or suggest strong bullish conviction toward 0.674.
However, it’s definitely worth watching — especially if price starts moving in that direction.
Also keep an eye on option unwinds or roll-overs — they often tell us more about how big players see the future path of the asset.
📈 Bottom line:
Not a clear signal yet — but definitely a pattern forming. Stay tuned.
Follow for more edge-driven breakdowns!

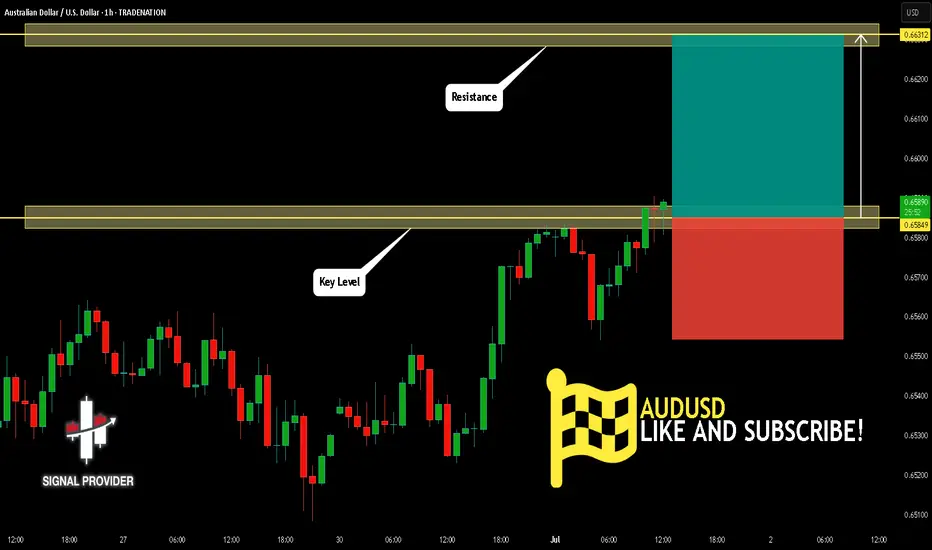
AUDUSD Is Bullish! Buy!
Here is our detailed technical review for AUDUSD.
Time Frame: 1h
Current Trend: Bullish
Sentiment: Oversold (based on 7-period RSI)
Forecast: Bullish
The market is trading around a solid horizontal structure 0.658.
The above observations make me that the market will inevitably achieve 0.663 level.
P.S
We determine oversold/overbought condition with RSI indicator.
When it drops below 30 - the market is considered to be oversold.
When it bounces above 70 - the market is considered to be overbought.
Disclosure: I am part of Trade Nation's Influencer program and receive a monthly fee for using their TradingView charts in my analysis.
Like and subscribe and comment my ideas if you enjoy them!
Bullish momentum to rise?The Aussie (AUD/USD) is reacting off the pivot which acts as an overlap resistance and could rise to the 1st resistance.
Pivot: 0.6457
1st Support: 0.6388
1st Resistance: 0.6546
Risk Warning:
Trading Forex and CFDs carries a high level of risk to your capital and you should only trade with money you can afford to lose. Trading Forex and CFDs may not be suitable for all investors, so please ensure that you fully understand the risks involved and seek independent advice if necessary.
Disclaimer:
The above opinions given constitute general market commentary, and do not constitute the opinion or advice of IC Markets or any form of personal or investment advice.
Any opinions, news, research, analyses, prices, other information, or links to third-party sites contained on this website are provided on an "as-is" basis, are intended only to be informative, is not an advice nor a recommendation, nor research, or a record of our trading prices, or an offer of, or solicitation for a transaction in any financial instrument and thus should not be treated as such. The information provided does not involve any specific investment objectives, financial situation and needs of any specific person who may receive it. Please be aware, that past performance is not a reliable indicator of future performance and/or results. Past Performance or Forward-looking scenarios based upon the reasonable beliefs of the third-party provider are not a guarantee of future performance. Actual results may differ materially from those anticipated in forward-looking or past performance statements. IC Markets makes no representation or warranty and assumes no liability as to the accuracy or completeness of the information provided, nor any loss arising from any investment based on a recommendation, forecast or any information supplied by any third-party.

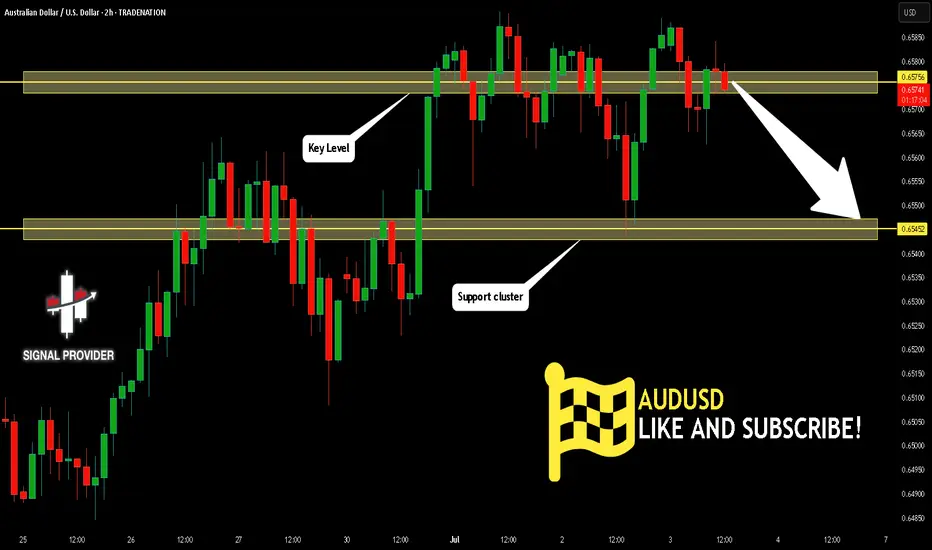
AUDUSD Is Very Bearish! Short!
Please, check our technical outlook for AUDUSD.
Time Frame: 2h
Current Trend: Bearish
Sentiment: Overbought (based on 7-period RSI)
Forecast: Bearish
The price is testing a key resistance 0.657.
Taking into consideration the current market trend & overbought RSI, chances will be high to see a bearish movement to the downside at least to 0.654 level.
P.S
Overbought describes a period of time where there has been a significant and consistent upward move in price over a period of time without much pullback.
Disclosure: I am part of Trade Nation's Influencer program and receive a monthly fee for using their TradingView charts in my analysis.
Like and subscribe and comment my ideas if you enjoy them!
Bullish continuation for the Aussie?The price has bounced off the support level which is a pullback support and could potentially rise from this level to our take profit.
Entry: 0.5537
Why we like it:
There is a pullback support level.
Stop loss: 0.6490
Why we like it:
There is an overlap support level.
Take profit: 0.6623
Why we like it:
There is a resistance level at the 138.2% Fibonacci extension and the 61.8% Fibonacci projection.
Enjoying your TradingView experience? Review us!
Please be advised that the information presented on TradingView is provided to Vantage (‘Vantage Global Limited’, ‘we’) by a third-party provider (‘Everest Fortune Group’). Please be reminded that you are solely responsible for the trading decisions on your account. There is a very high degree of risk involved in trading. Any information and/or content is intended entirely for research, educational and informational purposes only and does not constitute investment or consultation advice or investment strategy. The information is not tailored to the investment needs of any specific person and therefore does not involve a consideration of any of the investment objectives, financial situation or needs of any viewer that may receive it. Kindly also note that past performance is not a reliable indicator of future results. Actual results may differ materially from those anticipated in forward-looking or past performance statements. We assume no liability as to the accuracy or completeness of any of the information and/or content provided herein and the Company cannot be held responsible for any omission, mistake nor for any loss or damage including without limitation to any loss of profit which may arise from reliance on any information supplied by Everest Fortune Group.

AUD/USD Coils Below Critical ResistanceThe June range is preserved heading into the close of the month with a massive outside-weekly reversal taking Aussie back into key resistance on Friday. Note that momentum is approaching the 60-level for the first time this year and a break higher alongside a breach above 6550 could fuel a substantial rally here- watch the weekly close.
Initial support rests with the February high-week close (HWC) at 6357 and is backed closely by 6290/6315- a region defined by the yearly low-week close (LWC) and the 38.2% retracement of the yearly range. Note that the median-line converges on this level over the next few weeks and we’ll reserve this threshold as our bullish invalidation level- a break / weekly close below would threaten downtrend resumption toward the next major technical consideration at 6162/79.
A topside breach / close above this key pivot zone is needed to fuel the next leg of the advance with key resistance seen at the 2019 lows near 6670. Ultimately a break above the upper parallel (blue) would be needed to suggest a more significant trend reversal is underway with subsequent resistance objectives eyed at the 2024 HWC / yearly open near 6795-6810 and 6900.
Bottom line: An outside-weekly reversal has covered the entire monthly range with the Australian Dollar now testing critical resistance for an eighth-consecutive week. From a trading standpoint, losses should be limited to the 52-week moving average IF price is heading higher on this stretch with a close above 6550 needed to fuel the next move.
-MB

AUDUSD InsightHello to all our subscribers,
Please feel free to share your personal opinions in the comments. Don't forget to like and subscribe.
Key Points
- According to the U.S. Department of Labor’s Job Openings and Labor Turnover Survey (JOLTS), job openings in May increased by 374,000 from the previous month to 7.769 million, significantly exceeding market expectations of 7.3 million.
- U.S. President Trump has indicated that he has no intention of further extending the reciprocal tariff exemption set to expire on the 9th, warning that tariffs of 30% to 35% could be imposed on Japan.
- Trump's tax cut proposal has dramatically passed the Senate and is now awaiting passage in the House. President Trump aims to sign the bill into law before July 4th.
- Australia's May CPI rose 2.1% year-on-year, falling short of market expectations. Some analysts now expect the Reserve Bank of Australia (RBA) to cut interest rates in July.
Key Economic Events This Week
+ July 2: U.S. June ADP Non-Farm Employment Change
+ July 3: U.S. June Non-Farm Payrolls, U.S. June Unemployment Rate
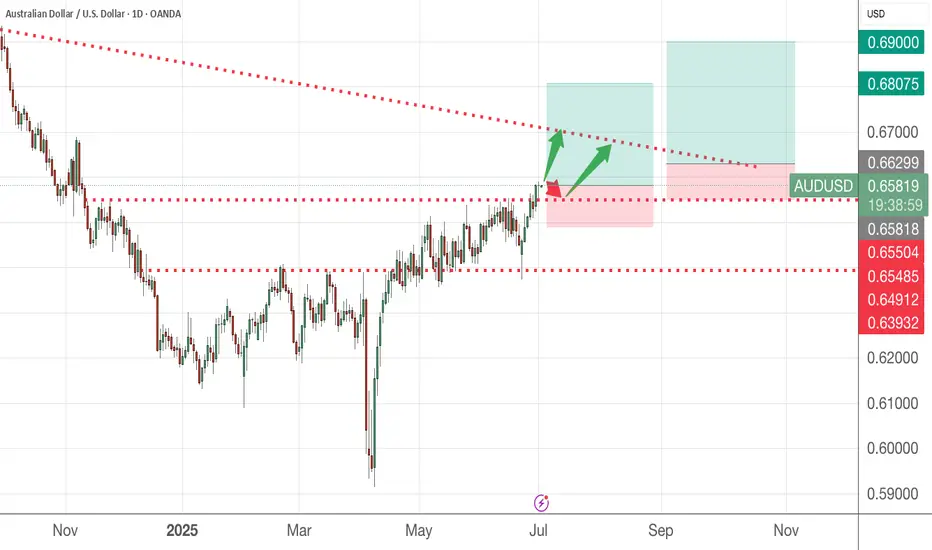
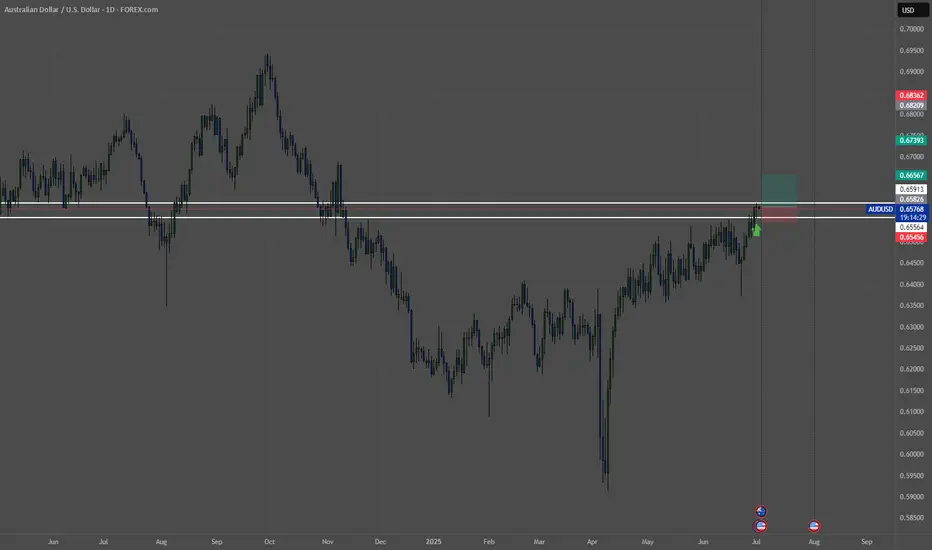
AUDUSD Chart Analysis
The pair has been steadily rising and recently reached the 0.66000 level. In the longer term, a rise toward the 0.69000 level seems likely. However, expectations of a rate cut by the Reserve Bank of Australia have introduced new uncertainty. There is also minor resistance near the 0.67000 level, which could lead to a potential reversal if market conditions align. While maintaining a bullish outlook, we will closely monitor the price action around the 0.67000 level.

AUD/USD Bearish Setup – Rejection from Supply ZoneAUD/USD is showing signs of bearish pressure after getting rejected from the key 0.65420 supply zone, marked by strong historical resistance and a high-volume node. Price tested this area multiple times but failed to break above, forming a potential lower high – a classic signal of institutional distribution.
🔵 Key Levels:
Resistance (Supply Zone): 0.65420
Mid-range support: 0.65040
Demand Zone: 0.64649 – 0.64400
🔻 Bearish Outlook: If price holds below 0.65420, we anticipate a drop first toward 0.65040, and potentially down to 0.64649, where a demand zone is likely to react. The previous bounce from demand suggests smart money accumulation below.
📌 Watch for:
Bearish engulfing or rejection wick candles near 0.65400.
Break below 0.65040 to confirm short continuation.
Confluence with macroeconomic events (FOMC, US data on the 17th–18th).
💬 Are you shorting AUD/USD from the supply zone? Drop your thoughts👇
#AUDUSD #Forex #SmartMoney #SupplyDemand #PriceAction #LuxAlgo #ForexTrading #TradingView #MarketStructure

Potential bullish rise?AUD/USD has bounced off the support level which is a pullback support and could rise from this level to our take profit.
Entry: 0.6406
Why we like it:
There is a pullback support level.
Stop loss: 0.6359
Why we like it:
There is a pullback support level.
Take profit: 0.6512
Why we like it:
There is a pullback resistance level that lines up with the 78.6% Fibonacci retracement.
njoying your TradingView experience? Review us!
Please be advised that the information presented on TradingView is provided to Vantage (‘Vantage Global Limited’, ‘we’) by a third-party provider (‘Everest Fortune Group’). Please be reminded that you are solely responsible for the trading decisions on your account. There is a very high degree of risk involved in trading. Any information and/or content is intended entirely for research, educational and informational purposes only and does not constitute investment or consultation advice or investment strategy. The information is not tailored to the investment needs of any specific person and therefore does not involve a consideration of any of the investment objectives, financial situation or needs of any viewer that may receive it. Kindly also note that past performance is not a reliable indicator of future results. Actual results may differ materially from those anticipated in forward-looking or past performance statements. We assume no liability as to the accuracy or completeness of any of the information and/or content provided herein and the Company cannot be held responsible for any omission, mistake nor for any loss or damage including without limitation to any loss of profit which may arise from reliance on any information supplied by Everest Fortune Group.

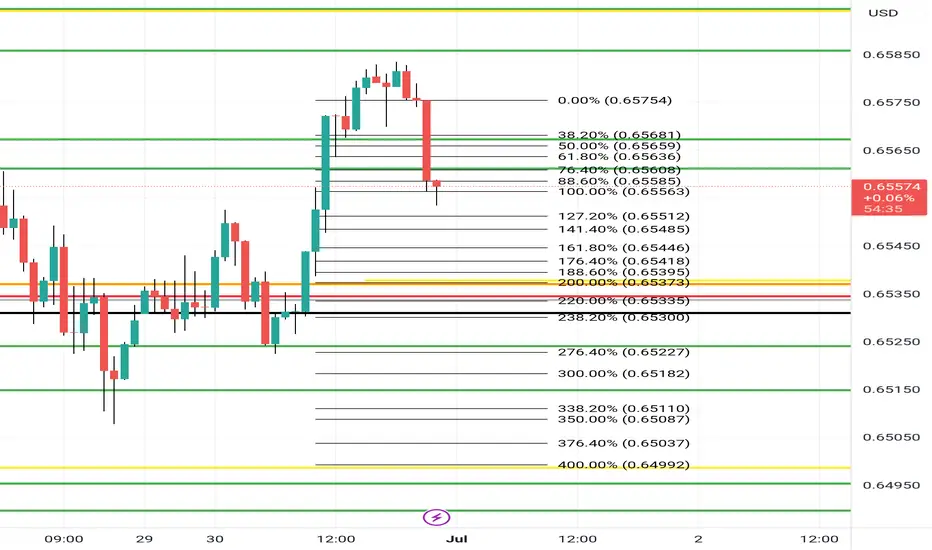
AUDUSD TRADE IDEA AUDUSD seems to be lining up for us, for a trade to the upside.
Parameters have been set and we wait for a pullback to our Fibonacci level and then a continuation to the upside
Let's see what the market does, considering the US holidays tomorrow (4th July)

AUDUSD - Daily - LongDirection: Up-trending
Levels: Bouncing off 0.656
Price action: Pinbar off the level.
US trade deals lift antipodean currencies | FX ResearchMarkets ended a subdued session as attention turned to the upcoming US jobs report, with the dollar retreating after a surprising ADP jobs print far below what was expected. Focus is also on President Trump's fiscal bill, which faces resistance in the House, with Congressman Thomas Massie claiming enough votes to block its passage.
Bond yields stay high, driven by rising European and UK rates after UK Prime Minister Starmer's controversial welfare reform reversal, leaving him and Chancellor Rachel Reeves politically vulnerable. The pound recovered partially but remains under pressure, while dollar-yen fluctuated but ended with a stronger yen.
Elsewhere, Poland unexpectedly cut rates to 5%, and Canada’s manufacturing PMI fell. Trump's new trade deal with Vietnam, which included a 20% tariff on direct exports and 4% on transshipped goods—likely targeting Chinese rerouting—strengthened the Chinese yuan.
All eyes are now on today's non-farm payrolls report. A weak result could boost expectations for a Federal Reserve rate cut. Remember, the US will be closed for the 4th of July, so economic data has been bumped up to Thursday.

Trading the July RBA decision The Reserve Bank of Australia (RBA) will deliver its latest policy decision on Tuesday, 9 July. Markets are heavily positioned for a 25-basis point cut, which would bring the official cash rate down to 3.60%.
Major Australian banks including CBA, Westpac, NAB and ANZ are aligned in expecting a cut this month, with some anticipating further easing in August and November. A confirmed cut paired with dovish guidance could place further downside pressure on the Australian dollar, particularly against the US dollar and Japanese yen.
AUD/USD remains capped below the 0.6580–0.6600 region, with repeated rejections suggesting strong overhead resistance. A break above this zone would be needed to shift momentum higher. Conversely, a confirmed break below 0.6520 could open a move toward the 0.6450 area. Meanwhile, AUD/JPY has rebounded firmly off its May lows and is now testing resistance near 95.30. This area has repeatedly capped upside since mid-June, making it a key level to watch into the RBA decision.

Australia's CPI slows, raising rate cut expectationsThe Australian dollar is showing limited movement on Wednesday. In the European session, AUD/USD is trading at 0.6495, up 0.08% on the day.
Australia's inflation rate headed lower in May. Headline CPI rose 2.1%, after gains of 2.4% in the previous three months. This was below the market estimate of 2.3%. Monthly, CPI eased to 0.4%, driven by lower petrol and housing costs.
The key core CPI indicator, annual trimmed mean inflation, also dropped sharply, to 2.4% from 2.8%, its lowest level since Nov. 2021.
The soft inflation report has boosted the case for the Reserve Bank of Australia to lower rates at the July meeting. The markets have priced in a 90% probability of a quarter-point cut, up from 81% prior to the inflation release. The markets have priced in three more rate cuts this year, following rate cuts in February and May.
The markets are counting on the RBA to be dovish in the second half of 2025. With inflation not only within the RBA's target of 2-3% but also falling, the markets expect that the RBA will be keen to lower rates in order to preserve economic growth.
Federal Reserve Chair Powell testified before a House Committee on Tuesday and had a cautious message for lawmakers. Powell said that the Fed was committed to keeping inflation contained and that the Fed planned to maintain rates until the impact of tariffs on inflation was more clear and reiterated that inflation still remained above the Fed's 2% target.
Powell has faced blistering criticism from President Trump for not lowering rates. In his testimony, Powell said that Trump's attacks were "having no effects" on Fed policy.
AUD/USD pushed above resistance at 1.3726 and is testing resistance at 1.3727. Above, there is resistance at 1.3750
1.3713 and 1.3702 are the next support levels

AUDUSD I Monthly CLS I Model 1 I TR - LiquidityHey, Market Warriors, here is another outlook on this instrument
If you’ve been following me, you already know every setup you see is built around a CLS Footprint, a Key Level, Liquidity and a specific execution model.
If you haven't followed me yet, start now.
My trading system is completely mechanical — designed to remove emotions, opinions, and impulsive decisions. No messy diagonal lines. No random drawings. Just clarity, structure, and execution.
🧩 What is CLS?
CLS is real smart money — the combined power of major investment banks and central banks moving over 6.5 trillion dollars a day. Understanding their operations is key to markets.
✅ Understanding the behavior of CLS allows you to position yourself with the giants during the market manipulations — leading to buying lows and selling highs - cleaner entries, clearer exits, and consistent profits.
📍 Model 1
is right after the manipulation of the CLS candle when CIOD occurs, and we are targeting 50% of the CLS range. H4 CLS ranges supported by HTF go straight to the opposing range.
"Adapt what is useful, reject what is useless, and add what is specifically your own."
— David Perk aka Dave FX Hunter ⚔️
👍 Hit like if you find this analysis helpful, and don't hesitate to comment with your opinions, charts or any questions.
