AUDUSD I Monday CLS Range I KL - OB I Model 2Hey Traders!!
Feel free to share your thoughts, charts, and questions in the comments below—I'm about fostering constructive, positive discussions!
🧩 What is CLS?
CLS represents the "smart money" across all markets. It brings together the capital from the largest investment and central banks, boasting a daily volume of over 6.5 trillion.
✅By understanding how CLS operates—its specific modes and timings—you gain a powerful edge with more precise entries and well-defined targets.
🛡️Follow me and take a closer look at Models 1 and 2.
These models are key to unlocking the market's potential and can guide you toward smarter trading decisions.
📍Remember, no strategy offers a 100%-win rate—trading is a journey of constant learning and improvement. While our approaches often yield strong profits, occasional setbacks are part of the process. Embrace every experience as an opportunity to refine your skills and grow.
Wishing you continued success on your trading journey. May this educational post inspire you to become an even better trader!
“Adapt what is useful, reject what is useless, and add what is specifically your own.”
David Perk ⚔
AUDUSD_ZERO trade ideas

There is no reason not to be bullish here!!!This is a good zone. I timed the market so you dont have to.
Enjoy this wonderful swing. There is no other liquidity in the downside so we go only up

AUDUSD Technical AnalysisFenzoFx—AUD/USD broke below the critical support at $0.626, heading toward the 78.6% Fibonacci level. The bearish trend remains intact while the price stays below the $0.6329 resistance.

DeGRAM | AUDUSD growth in the channelAUDUSD is in an ascending channel between the trend lines.
The price is moving from the lower boundary of the channel.
The chart formed a harmonic pattern and held the 62% retracement level.
We expect the growth to continue in the channel.
-------------------
Share your opinion in the comments and support the idea with like. Thanks for your support!

Check the trend A trend change is expected to form within the current support area and we will see the start of an uptrend. If the price breaks through the support area, a continuation of the downtrend is likely.

AUDUSD Analysis: Reversal Predictions Based on Trading MathDear Trader,
Please find attached my analysis of $Subject, which uses mathematical calculations to identify potential reversal times and price levels.
The analysis details projected south and north price targets (horizontal lines on the chart), along with estimated time frames for possible reversals (vertical lines on the chart, accurate to within +/- 1-2 candles). To increase the probability of these analysis, I recommend monitoring the 5-minute and 15-minute charts for the following key reversal candlestick patterns:
Doji’s
Hammer/Inverted Hammer
Double/Triple Bottom/Top
Shooting Star
Morning Star
Hanging Man
I welcome your feedback on this analysis, as it will inform and enhance my future research.
Regards,
Shunya Trade
Vertical Line time
31st March 04:30 PM
31st March 06:15 PM 07:30 PM
1st Apr 01:30 AM
1st Apr 04:30 AM 06:15 AM
1st Apr 10:30 AM
1st Apr 12:15 PM 01:30 PM
2nd Apr 01:30 AM
2nd Apr 04:30 AM 06:15 AM
2nd Apr 07:30 AM
2nd Apr 10:30 PM
3rd Apr 01:30 AM
⚠️ Disclaimer:
This post is educational content and does not constitute investment advice, financial advice, or trading recommendations. The views expressed here are based on technical analysis and are shared solely for informational purposes. The stock market is subject to risks, including capital loss, and readers should exercise due diligence before investing. We do not take responsibility for decisions made based on this content. Consult a certified financial advisor for personalized guidance.

BUY AUDUSD, you wont regret it!GBPUSD has already left, you can continue adding positions to it but AUDUSD hasn't moved much yet that's why I'm picking it.
I'm makin the stops really small due to the AUD been weak now, but dont worry, it wont be hit.
My TPs are the purple line
Follow me as my trades are market order and not limit orders. You will get notification once I post if you follow so you will enter the trade on time.

Week of 3/30/25: AUDUSD Weekly AnalysisWeekly analysis this week, price has been congesting and tightening the last 2 weeks, expecting hopefully a good move this week to breakout of consolidation.
Starting the week with a bearish bias.
Major News: NFP Friday
Thanks for stopping by, have a great trading week!

AudUsd Trade IdeaAU has been in an overall range between 64000 and 61363. Price ended up respecting 64000 once more before getting into a bearish range after the structure flip. I'm personally looking for price to break from the range to confirm our overall bearish move back down to 61363.

AUDUSD Potential SellsFX:AUDUSD is definitely interesting rn. I can see AU selling to the 0.6200 area based of H4/Daily head & shoulders pattern. If price breaks daily support/head & shoulders neckline, then that'll give me more confirmation to look for sells.

AUDUSD POSSIBLE BUY When price came to our POI on the M30 it wasn't respected instead we got a sweep of liquidity of that leg, nonetheless the demand zone on the M30 was seen on the 1H which makes it invalidated. After the sweep we got a push up, well price has been ranging for awhile. On the Hourly we're seeing a clear price action so in summary since we've seen a BOS on the hourly and liquidity below before POI, my expectation is if price respects our POI I'll be looking for long.
AUDUSD 1HPrice initially moved up as expected but retraced later in the week.
Given upcoming news, a breakout and confirmation beyond the 27-pip range will determine the trading direction. For now, staying neutral is preferable, but I remain cautiously bullish in line with the previous analysis.

AUD/USD Forex Pair Trading in Diamond PatternA diamond pattern has been spotted in the AUDUSD forex pair, with the spot price currently trading near the support level of the pattern.

AUDUSD Buy @ 0.62354AUDUSD still has a strong Bearish push, Key level is @ 0.62354... it's a good buy opportunity for me when price hits my zone..

Is This the Calm Before the Storm on AUD/USD?The AUD/USD pair is currently consolidating within a sideways range, indicating indecision in the market. Price is fluctuating between key horizontal support near 0.6150 and resistance around 0.6450.
A rising trendline is providing strong dynamic support, keeping the pair from breaking lower, while a descending resistance line continues to limit upside momentum. As long as the pair remains within this range, no clear trend is confirmed.
A breakout above resistance could signal a bullish shift, while a breakdown below the trendline may open the door for further downside.
If you find our analysis helpful, don’t forget to like and follow us.
THANK YOU
DYOR, NFA

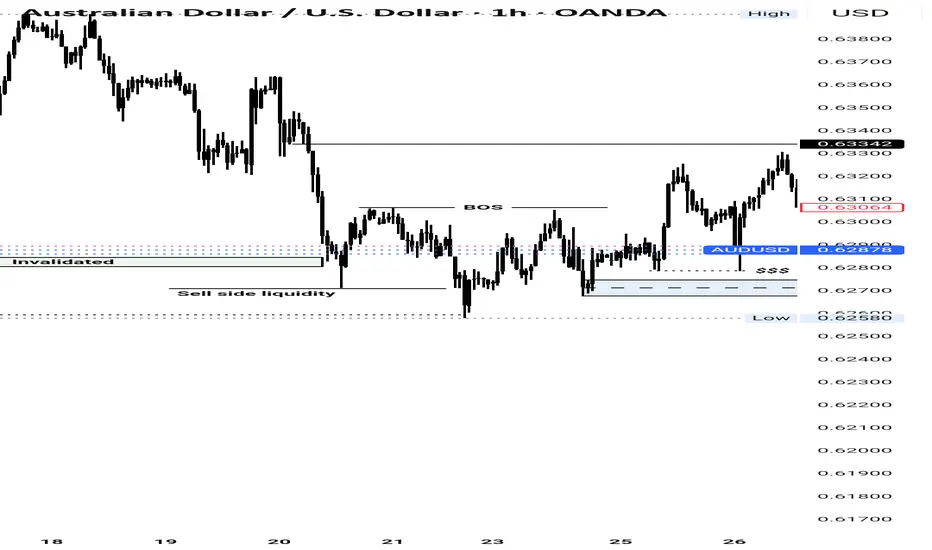
AUD/USD 1H – Testing Demand Zone for a Potential Reversal?The pair is currently retesting a strong demand zone, with multiple rejections seen in this area. A Break of Structure (BoS) indicates bullish potential, but price needs to confirm a reversal before a strong upside move.
📊 Key Observations:
✔ Break of Structure (BoS): Bullish intent was confirmed earlier.
✔ Swing Structure Support (SSS): Holding for now, but a deeper test of demand is possible.
✔ Demand Zone Reaction: If price holds above 0.6270–0.6255, a bullish reversal is likely.
🔎 Trade Idea: Looking for bullish confirmations within the demand zone. A clean rejection could offer long opportunities toward recent highs.
