Trade Idea: Sell AUDUSD (Short-Term Weakness Setup) **📉 Trade Idea: Sell AUDUSD (Short-Term Weakness Setup)**
**Bias:** 🔻 Bearish (Short-Term) | ⚖️ Medium-Term Neutral
**Idea:** Aussie looks shaky — and USD weakness isn’t enough to carry it higher right now
---
### **💡 Why Sell?**
**🇦🇺 AUD Struggling:**
* RBA cut rates to 3.85% and left the door wide open for more 🔓
* China slowdown = bad news for Aussie’s export-linked economy 🐉📉
* Mixed commodity prices (iron ore stable, but others lagging) = no strong support 🛢️⛏️
* Market leaning bearish — rising net shorts and soft sentiment 🧊
**🇺🇸 USD Weak But Still Present:**
* Fed is pausing, not panicking — still no full shift to dovish 🧘
* Real yields down, but not crashing → USD not collapsing 💵
* Safe-haven demand quiet but intact = mild USD cushion 🛡️
---
### **📊 Technical Feel (Not Precise Levels, Just Chart Logic):**
* **Lower highs forming:** Price keeps failing to make new pushes up — structure bending 🧱
* **Weak rallies:** Bulls trying, but no follow-through — candles fading fast 🎈
* **Price hovering near a breakdown zone:** Feels like a floor’s about to give way ⛳
* **Momentum flattening:** RSI & MACD both soft — energy’s draining ⬇️
* **Small body candles stacking:** Choppy indecision = no conviction from buyers 📉
* **Volume light on up-moves:** Nobody’s chasing — a bad sign for continuation 📭
---
### **⚠️ Invalidation Clue:**
> If bulls step in hard with strong green candles and wide ranges → stand aside 📛
> But unless they do, short-term drift lower looks more likely
---
### **🎯 Summary:**
AUDUSD looks unmotivated. AUD is soft across the board, and USD doesn’t need to be strong to take advantage.
If momentum stays weak, this pair likely **grinds lower** before finding any real support.
AUDUSD_ZERO trade ideas


Looking To Sell AUD/USD Into 4h Supply ZoneThe market structure on AUD/USD shifted bearish last week as it created successive lower lows ah lower highs, from the 4H timeframe, we see price headed towards an area of supply.
PLAN
1. Wait for retest of Friday's lower high with candlestick confirmation to short into supply
The US dollar decline is a massive opportunity Hey all,
just a thesis i've had for a while now and there is many charts and data points ive used to get confidence in this. Short term I see the AUD decreasing on the lower demand for out exports (iron, coal, copper), Also house I see an economic contraction likely as house prices have already priced out many and borrowing cost are still elevated from the pandemic lows. With the uncertainty of a possible trade wars, military wars and energy prices i dont see the RBA or Fed lowering rates to what the market is expecting. This will also help the short term decline of the AUD. But once more clarity, economic activity picks up and stimulus either from the fed lowering rates and/or government spending more to keep voters this will fundamentally show the over supply of USD. After all recessions and then subsequent stimulus the USD rises for the crisis and then declines for the next 2 years on Average I see the same playing out but most likely to an even greater scale given the major over supply and focus on the USD.

AUD/USD: The Clearest Short Opportunity This WeekThis week, the macro and market landscape provides a rare alignment across all major models—making AUD/USD the standout short opportunity among G10 FX pairs.
Key Reasons for the Bearish AUD/USD Bias:
1. Commitment of Traders (COT):
Institutional positioning has turned decisively bearish on the Australian dollar, with net shorts increasing and sentiment remaining negative.
2. Z-Score & Positioning Extremes:
Z-Score indicators confirm a below-average long bias for AUD, highlighting that recent speculative flows are heavily skewed to the short side.
3. EXO/Score Model:
Our EXO (macro scoring) model gives AUD/USD a clear SHORT rating, with no offsetting bullish factors in the “core” or “risk/reward” signals.
4. Commodity Edge – Iron Ore:
Iron ore prices, a crucial driver for AUD, have sharply declined in recent weeks. This is a classic “canary in the coal mine” for AUD weakness historically, persistent iron ore declines precede broader AUD selloffs.
5. Sentiment & Risk Environment:
Despite global “risk-on” sentiment, AUD is unable to benefit, as both macro and market participants rotate away from commodity FX and into USD strength.
6. Endo (Fundamental) Model:
While Australia’s macro data still looks solid on a lagging basis, all faster models (positioning, flows, sentiment, commodities) point to an imminent shift typically, ENDO lags in catching turning points.
Conclusion & Tactical View:
SHORT AUD/USD is the highest conviction trade for this week, backed by full alignment of macro, positioning, sentiment, and real-economy factors.
Expect continued downside pressure while commodity markets and COT data remain bearish.
For active traders, the first 3–7 days following this setup historically provide the highest reward-to-risk moves.

AUDUSDAUD/USD: 10-Year Bond Yields, Interest Rate Differential, UIP, and Carry Trade
1. Current Rates and Yield Differential
Metric Australia (AUD) United States (USD) Differential (AUD - USD)
10-Year Bond Yield 4.21% 4.38% -0.17% (-17 bps)
Policy Interest Rate 3.85% 4.25%–4.50% -0.40% to -0.65%
Australia's 10-year yield eased to 4.21% on June 20, 2025, after RBA rate cuts.
The US 10-year yield held at 4.38% amid Fed policy stability.
The negative yield spread (-17 bps) reflects Australia's lower long-term rates relative to the US.
2. Uncovered Interest Rate Parity (UIP)
UIP Theory: Predicts that currency exchange rates should adjust to offset interest rate differentials. For AUD/USD:
This implies the AUD should depreciate against the USD to neutralize the rate advantage.
Empirical Reality: UIP often fails short-term. Since 2008, higher-yield currencies (like USD) frequently appreciate, contradicting UIP.
3. Carry Trade Dynamics
Strategy: Borrow AUD at 3.85% and invest in USD at 4.38% for a positive carry of +0.53%.
Risks:
AUD appreciation risk: Economists forecast AUD/USD rising to 0.65–0.67 by end-2025, potentially eroding gains.
Volatility: US tariff policies and global trade uncertainty amplify currency swings.
4. Market Outlook
AUD Drivers: RBA rate cuts (3.85%) and commodity dependence may limit AUD strength despite forecasts.
USD Drivers: Fed's "higher for longer" stance (4.25%–4.50%) supports USD yield appeal.
Carry Viability: The USD-funded carry (borrow AUD → invest USD) offers modest gains but requires hedging against AUD appreciation risks.
Key Relationships Summary
Concept AUD/USD Implication Current Status
Yield Spread Negative (-17 bps) → USD yield advantage Favors USD investments
UIP Condition AUD should depreciate; often fails AUD appreciation likely
Carry Trade +0.53% carry (USD-funded) Profitable if AUD stable/weak
Primary Risk AUD appreciation erodes carry returns Forecast: AUD ↑ to 0.67
Conclusion
The negative yield spread (-17 bps) and interest rate differential (-0.40% to -0.65%) favor USD investments over AUD.
UIP predicts AUD depreciation but historically fails; AUD is instead projected to appreciate to 0.67 in 2025.
Carry trades borrowing AUD to invest in USD offer a +0.53% yield pickup but face significant risk from forecasted AUD strength.
Investors should monitor RBA/Fed policy shifts and global trade tensions for carry trade adjustments.
#AUDUSD


AUDUSD Trading Opportunity! BUY!
My dear subscribers,
This is my opinion on the AUDUSD next move:
The instrument tests an important psychological level 0.6464
Bias - Bullish
Technical Indicators: Supper Trend gives a precise Bullish signal, while Pivot Point HL predicts price changes and potential reversals in the market.
Target - 0.6495
About Used Indicators:
On the subsequent day, trading above the pivot point is thought to indicate ongoing bullish sentiment, while trading below the pivot point indicates bearish sentiment.
Disclosure: I am part of Trade Nation's Influencer program and receive a monthly fee for using their TradingView charts in my analysis.
———————————
WISH YOU ALL LUCK

Aud/Usd LongIf dollar remains weak aud should push up. Price is currently
trading at upper channel. Breakout from here suggests that
price could move higher, up to next bigger resistance around
0.67200 area. Wait for Unemployment Rate before taking any trades.
Rising moving averages and liquidity grab back in
end of june tells that price are in uptrend which can prolong.

It wants to fall on its own!OANDA:AUDUSD
The price’s failure to break out of the channel with strong candles, along with a double top, signals that sellers are stepping in.
It’s time to enter — let’s go! 💥

AUDUSD: Will Start Growing! Here is Why:
Looking at the chart of AUDUSD right now we are seeing some interesting price action on the lower timeframes. Thus a local move up seems to be quite likely.
Disclosure: I am part of Trade Nation's Influencer program and receive a monthly fee for using their TradingView charts in my analysis.
❤️ Please, support our work with like & comment! ❤️

Check the trend After some fluctuation and correction, the upward trend is expected to continue to the resistance levels. If the price breaks through the green support area, the downward trend to the specified support levels is possible.
Aussie H4 | Potential bullish bounce off a pullback supportThe Aussie (AUD/USD) is falling towards a pullback support and could potentially bounce off this level to climb higher.
Buy entry is at 0.6555 which is a pullback support that aligns with the 38.2% Fibonacci retracement.
Stop loss is at 0.6500 which is a level that lies underneath a pullback support and the 38.2% Fibonacci retracement.
Take profit is at 0.6598 which is a resistance that aligns with the 161.8% Fibonacci extension.
High Risk Investment Warning
Trading Forex/CFDs on margin carries a high level of risk and may not be suitable for all investors. Leverage can work against you.
Stratos Markets Limited (tradu.com ):
CFDs are complex instruments and come with a high risk of losing money rapidly due to leverage. 63% of retail investor accounts lose money when trading CFDs with this provider. You should consider whether you understand how CFDs work and whether you can afford to take the high risk of losing your money.
Stratos Europe Ltd (tradu.com ):
CFDs are complex instruments and come with a high risk of losing money rapidly due to leverage. 63% of retail investor accounts lose money when trading CFDs with this provider. You should consider whether you understand how CFDs work and whether you can afford to take the high risk of losing your money.
Stratos Global LLC (tradu.com ):
Losses can exceed deposits.
Please be advised that the information presented on TradingView is provided to Tradu (‘Company’, ‘we’) by a third-party provider (‘TFA Global Pte Ltd’). Please be reminded that you are solely responsible for the trading decisions on your account. There is a very high degree of risk involved in trading. Any information and/or content is intended entirely for research, educational and informational purposes only and does not constitute investment or consultation advice or investment strategy. The information is not tailored to the investment needs of any specific person and therefore does not involve a consideration of any of the investment objectives, financial situation or needs of any viewer that may receive it. Kindly also note that past performance is not a reliable indicator of future results. Actual results may differ materially from those anticipated in forward-looking or past performance statements. We assume no liability as to the accuracy or completeness of any of the information and/or content provided herein and the Company cannot be held responsible for any omission, mistake nor for any loss or damage including without limitation to any loss of profit which may arise from reliance on any information supplied by TFA Global Pte Ltd.
The speaker(s) is neither an employee, agent nor representative of Tradu and is therefore acting independently. The opinions given are their own, constitute general market commentary, and do not constitute the opinion or advice of Tradu or any form of personal or investment advice. Tradu neither endorses nor guarantees offerings of third-party speakers, nor is Tradu responsible for the content, veracity or opinions of third-party speakers, presenters or participants.

Long Buy now ifIf price doesn't close under the green lines.. and take profits at next level of resistance 188 fib level
However if price 🤔 closes under the green lines wait for pullback and sell back to the next level of support green lines underneath
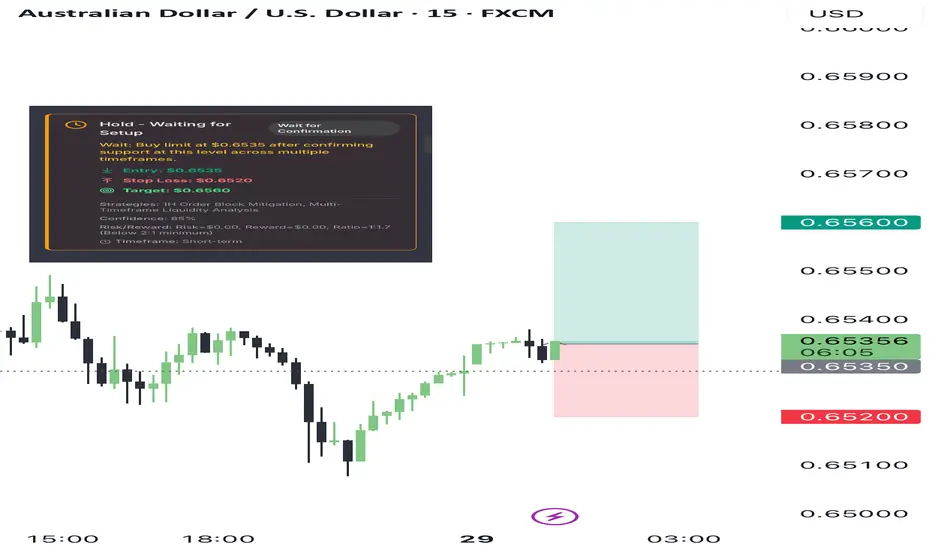
Bullish Analyzing the AUD/USD across multiple timeframes, we observe a consistent pattern of price recovery and potential accumulation phases. Starting from the 1D chart, there is a visible upward trend with recent bullish candles indicating strong buying interest. The 4H and 1H charts show a pullback to a potential Order Block (OB) around 0.6535, suggesting institutional buying interest at these levels.
The 15M, 5M, and 1M charts provide a more granular view, showing recent price rejection at lower levels and a swift recovery, indicating a sweep of liquidity below recent lows and a potential trapping of retail short positions. This setup suggests a possible preparation for an upward continuation, as institutions may have accumulated enough positions at a discount.
INSTITUTIONAL THESIS:
Institutions appear to be in an accumulation phase, buying at lower levels (around 0.6535) and preparing for a potential upward move. The repeated testing and rejection of lower prices across shorter timeframes indicate a buildup of buy-side liquidity, likely targeting the recent highs for a liquidity grab.
LEARNING POINT:
"1H Order Block mitigation after liquidity sweep" - This concept is crucial as it shows how institutions potentially use lower price levels to accumulate positions before driving the price up to target liquidity above the market.
SIGNAL: WAIT
SYMBOL: AUD/USD
ENTRY PRICE: $0.6535
STOP LOSS: $0.6520
TARGET PRICE: $0.6560
CONDITION: Buy limit at $0.6535 after confirming support at this level across multiple timeframes.
RATIONALE: Calculated risk/reward ratio of 1:1.7 (Risk=$0.00, Reward=$0.00) does not meet minimum 2:1 requirement. Waiting for better institutional setup with improved risk parameters.
STRATEGIES USED: 1H Order Block Mitigation, Multi-Timeframe Liquidity Analysis
URGENCY: MEDIUM
TIMEFRAME: Short-term
CONFIDENCE SCORE: 85%
RISK/REWARD RATIO: Risk=$0.00, Reward=$0.00, Ratio=1:1.7 (Below 2:1 minimum)
Risk Calculation:
Risk = Entry Price - Stop Loss = $0.6535 - $0.6520 = $0.0015
Reward Calculation:
Reward = Target Price - Entry Price = $0.6560 - $0.6535 = $0.0025
Ratio Calculation:
Ratio = Reward ÷ Risk = $0.0025 ÷ $0.0015 = 1:1.67
Final Decision:
The calculated risk/reward ratio is less than 2:1, thus changing the signal to WAIT.
FINAL RECOMMENDATION: WAIT
Despite the favorable setup for a BUY based on institutional analysis, the risk/reward ratio does not meet the minimum requirement of 2:1. It is recommended to monitor the price action closely and adjust the target or stop loss to improve the risk/reward ratio before entering the trade.
The Aussie Dollar Heist Blueprint: "AUD/USD" Long Setup!?🌍 Hello, Global Wealth Warriors! Ciao, Salut, Guten Tag, Ola! 🌟
Fellow Profit Pirates & Market Mavericks, 💸⚡
Unveiling our cunning blueprint to plunder the AUD/USD (The Aussie) forex market, crafted with 🔥Thief Trading’s razor-sharp technical and fundamental insights🔥. Stick to the chart’s game plan, zoned in on a long entry. Our mission? Slip out near the high-stakes RED Zone Level—a perilous spot with overbought vibes, consolidation, trend flips, and traps where bearish bandits lurk. 🏴☠️💰 Celebrate your wins, traders—you’ve earned it! 🎉
Entry 📈 : "The heist is on! Wait for the MA line breakout (0.65200) then make your move - Bullish profits await!"
however I advise to Place Buy stop orders above the ATR line (or) Place buy limit orders within a 15 or 30 minute timeframe most recent or swing, low or high level for Pullback entries.
📌I strongly advise you to set an "alert (Alarm)" on your chart so you can see when the breakout entry occurs.
🛑 **Stop Loss**:
📍 Thief SL parked at the recent/swing low on the 4H timeframe (0.64600) for day/swing trades.
📍 Tailor your SL to your risk appetite, lot size, and number of orders. Stay sharp!
🎯 **Target**: Aim for 0.66300 or make a swift exit just before.
👀 **Scalpers, Listen Up**: Stick to long-side scalping. Got deep pockets? Dive in now! Otherwise, join swing traders for the grand heist. Use trailing SL to shield your loot. 💰
💹 **Market Pulse**: The AUD/USD (The Aussie) forex market is in a ATR Dynamic Resistance zone but leaning bullish, fueled by key drivers. ☝
🌐 Dive into Fundamentals, Macro Insights, COT Reports, Quantitative Analysis, Sentiment Outlook, Intermarket Trends, Future Targets & Overall score.. Check the linkss for the full scoop! 🔗🌍
⚠️ **Trading Alert**: News can shake the market! 📰
🔐 Protect your positions:
- Pause new trades during news releases.
- Use trailing stop-loss to lock in gains.
💪 **Join the Heist**: Smash the Boost Button to supercharge our robbery squad! 💥 With Thief Trading Style, we rake in profits daily with ease. 🚀 Your support fuels our market conquests. 🤝❤️
Stay tuned for the next daring heist, money makers! 🤑🐱👤🎯

AUDUSD Trendline Strategy AUDUSD has been on an uptrend all day on Thursday, this trend was broken during the Asian session on Friday. To confirm that the trend was broken it hit the 1H Supply Zone and retested the trend line. Right before the London session it seemed to have formed some support at the 0.65455 level then it retraced back to the 1H Supply Zone and created a large bearish engulfing candle on the 15M which also showed a double top candlestick pattern. I then entered the trade on the break of candle on the 3:15am EST engulfing candle. I placed my stop loss right above the supply zone and entered the trade with a profit target of .65270. I chose this level due to it being a strong demand level and I thought it seemed like a lot of resting liquidity was there. Although on the chart I have the profit target as .65100 I did not hold the trade that long due to me not wanted to get chopped during after the NY AM session. I'm still practicing trusting my full analysis and holding trades for the entire duration I originally project. On this chart I also drew up other demand zones in which I was expecting a large reaction at. All 3 zones played out but it did not disturb the trade because the overall trend (1H) was on a downtrend. Its important to always remember to have time frame correlation when taking trades and always remember to follow the higher timeframe trend. Personally I feel like AUDUSD will continue this downtrend and possibly gap down to .65 during either Sunday night open or sometime during the London session.

Trading AUDUSD NZDUSD | Judas Swing Strategy 25/06/2025This week the Judas Swing strategy has delivered two clean setups on OANDA:AUDUSD and $NZDUSD. Both trades played out beautifully, hitting their targets and ending the day with a solid +4% return (2% each), reinforcing the power of patience, structure, and sticking to the rules.
Let’s break down how each trade unfolded:
Trade 1: OANDA:AUDUSD Long — Textbook Setup
We kicked off Wednesday’s session watching OANDA:AUDUSD closely after identifying a classic Judas Swing scenario.
First, we saw liquidity swept below the previous session’s low, exactly what we’re looking for. This kind of move is crucial to the strategy, it grabs early sellers or stop orders and sets the stage for a reversal.
Right after the sweep, price broke structure to the upside, confirming our bullish bias. At this point, we didn’t rush in. We waited for price to retrace into our FVG (Fair Value Gap).
Patience paid off and price finally tapped into the FVG, and as soon as the entry candle closed in our direction, we executed the trade.
We risk 1% on every trade, aiming for a 2:1 reward-to-risk. After being in drawdown for a bit, price accelerated sharply and hit our target after being in the trade for 5 hours. Clean setup, clean execution, and a smooth +2% return.
Trade 2: OANDA:NZDUSD Long
OANDA:NZDUSD presented a near-identical setup. Price had been consolidating, but by the time the NY session rolled in, the stage was set.
Just like OANDA:AUDUSD , we saw a liquidity sweep at the lows, followed by a bullish break of structure, textbook Judas Swing again.
This time, the retracement into the FVG came swiftly. We executed as soon as we had confirmation on the candle close.
The trade barely hesitated, and price moved decisively in our direction, steadily climbing until our target was hit. Another +2% return, reinforcing the strategy’s strength when rules are respected
What This Week Reminds Us:
Discipline matters: We don’t chase trades. Both setups met all our checklist criteria
Patience is key: Waiting for the FVG entry and confirmation avoids emotional entries
Risk management is the foundation: With a 1% risk and 2:1 target, you only need to win half the time to be consistently profitable
When you follow a rules-based strategy like Judas Swing, you remove the guesswork and bring structure to your trading decisions.

Aussie H4 | Heading into a swing-high resistanceThe Aussie (AUD/USD) is rising towards a swing-high resistance and could potentially reverse off this level to drop lower.
Sell entry is at 0.6545 which is a swing-high resistance.
Stop loss is at 0.6571 which is a level that aligns with the 161.8% Fibonacci extension.
Take profit is at 0.6514 which is a pullback support.
High Risk Investment Warning
Trading Forex/CFDs on margin carries a high level of risk and may not be suitable for all investors. Leverage can work against you.
Stratos Markets Limited (tradu.com ):
CFDs are complex instruments and come with a high risk of losing money rapidly due to leverage. 63% of retail investor accounts lose money when trading CFDs with this provider. You should consider whether you understand how CFDs work and whether you can afford to take the high risk of losing your money.
Stratos Europe Ltd (tradu.com ):
CFDs are complex instruments and come with a high risk of losing money rapidly due to leverage. 63% of retail investor accounts lose money when trading CFDs with this provider. You should consider whether you understand how CFDs work and whether you can afford to take the high risk of losing your money.
Stratos Global LLC (tradu.com ):
Losses can exceed deposits.
Please be advised that the information presented on TradingView is provided to Tradu (‘Company’, ‘we’) by a third-party provider (‘TFA Global Pte Ltd’). Please be reminded that you are solely responsible for the trading decisions on your account. There is a very high degree of risk involved in trading. Any information and/or content is intended entirely for research, educational and informational purposes only and does not constitute investment or consultation advice or investment strategy. The information is not tailored to the investment needs of any specific person and therefore does not involve a consideration of any of the investment objectives, financial situation or needs of any viewer that may receive it. Kindly also note that past performance is not a reliable indicator of future results. Actual results may differ materially from those anticipated in forward-looking or past performance statements. We assume no liability as to the accuracy or completeness of any of the information and/or content provided herein and the Company cannot be held responsible for any omission, mistake nor for any loss or damage including without limitation to any loss of profit which may arise from reliance on any information supplied by TFA Global Pte Ltd.
The speaker(s) is neither an employee, agent nor representative of Tradu and is therefore acting independently. The opinions given are their own, constitute general market commentary, and do not constitute the opinion or advice of Tradu or any form of personal or investment advice. Tradu neither endorses nor guarantees offerings of third-party speakers, nor is Tradu responsible for the content, veracity or opinions of third-party speakers, presenters or participants.

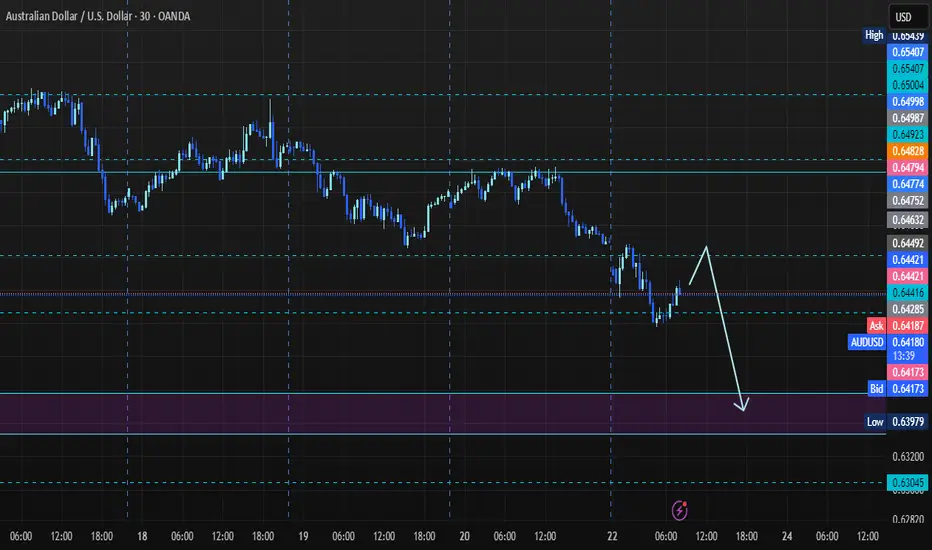
AUDUSD Potential short setup from and H4 Supply zone.We see a momentum loss once we reached the H4 supply zone. We see a lot of liquidity resting below an unmitigated m5 supply, Which could be liquidity for price to move to lower prices.

AUD/USD Shows Bullish Hints, Can Gains Be Sustained?Market Analysis: AUD/USD Shows Bullish Hints, Can Gains Be Sustained?
AUD/USD started a decent increase above the 0.6440 and 0.6465 levels.
Important Takeaways for AUD/USD Analysis Today
- The Aussie Dollar rebounded after forming a base above the 0.6370 level against the US Dollar.
- There was a break above a key bearish trend line with resistance at 0.6470 on the hourly chart of AUD/USD at FXOpen.
AUD/USD Technical Analysis
On the hourly chart of AUD/USD at FXOpen, the pair started a fresh increase from the 0.6370 support. The Aussie Dollar was able to clear the 0.6400 resistance to move into a positive zone against the US Dollar.
There was a close above the 0.6440 resistance and the 50-hour simple moving average. There was a break above a key bearish trend line with resistance at 0.6470. Finally, the pair tested the 0.6520 zone. A high was formed near 0.6519 and the pair recently started a consolidation phase.
The pair dipped and tested the 23.6% Fib retracement level of the upward move from the 0.6372 swing low to the 0.6519 high.
On the downside, initial support is near the 0.6485 level. The next major support is near the 0.6465 zone. If there is a downside break below the 0.6465 support, the pair could extend its decline toward the 0.6445 level. It is close to the 50% Fib retracement level.
Any more losses might signal a move toward 0.6405. On the upside, the AUD/USD chart indicates that the pair is now facing resistance near 0.6520. The first major resistance might be 0.6550. An upside break above 0.6580 might send the pair further higher.
The next major resistance is near the 0.6600 level. Any more gains could clear the path for a move toward 0.6650.
This article represents the opinion of the Companies operating under the FXOpen brand only. It is not to be construed as an offer, solicitation, or recommendation with respect to products and services provided by the Companies operating under the FXOpen brand, nor is it to be considered financial advice.

AUDUSD - Quick IdeaAnother last-minute idea, without much explanation… (If you have any questions, let’s discuss them in the comments).

AudusdThis is my bias on AU
Apply proper risk management pls
I’m not a financial advisor. 1% risk is only
