AUD/USD 2H | MAKE OR BREAK (Key Edge)🟡 AUD/USD 2H Analysis – June 19, 2025
Bias: Neutral → Reactive (Awaiting Breakout Direction)
Timeframe: 2H
🔍 Market Overview:
AUD/USD is approaching a make-or-break level at the confluence of an ascending trendline and a minor horizontal support around 0.6460–0.6470. This comes after price was rejected from the 2025 high (0.6555) — a significant technical ceiling, labeled as a Possible Reversal Point.
✳️ Technical Structure:
🔵 Upper wedge resistance rejected price twice (0.6555)
🔵 Support trendline has been respected since late May
🟠 Current zone (0.6460) = last line of bullish defense
🔻 Breakdown risk is rising due to lower highs & compression
🔼 Bullish Playbook (Bounce Scenario):
Trigger: Bullish reaction from 0.6460 with strong momentum candle or engulfing
Entry: 0.6465–0.6475
Stop: Below 0.6440
Target 1: 0.6515
Target 2: 0.6555 (2025 High / Upper Wedge Edge)
R/R: ~2.0+
🔽 Bearish Playbook (Breakdown Scenario):
Trigger: 2H close below 0.6455 + retest rejection
Entry: 0.6450–0.6445 on retest
Stop: Above 0.6480
Target 1: 0.6400 (demand zone)
Target 2: 0.6300
R/R: ~2.5+
The next 4–8 candles could define the near-term structure. Respect the edge — react, don’t predict.
Zoom in:
Please Manage Your Risk...
#AUDUSD #MJTRADING #TRADINGVIEW #Chart #Analysis #Forex #Forexsignal #FXSignal
AUDUSD_ZERO trade ideas

AUD/USD finally ready to take off?Following the collapse in oil prices and the rally in all risk assets, the AUD/USD created a hammer candle on the daily time frame yesterday as it held key support and the 200-day average in the shaded blue area on the chart. We have seen some further upside so far today, suggesting that the AUD/USD may finally be ready to lift off from the congestion zone it has been stuck inside for several weeks now. Immediate upside target is the liquidity resting above 0.6552. Break that then 0.6600 handle will come into focus next. Bias will turn bearish if we close below the shaded blue area in the coming days.
By Fawad Razaqzada, market analyst with FOREX.com

AUDUSD SHORT FORECAST Q2 W26 D24 Y25AUDUSD SHORT FORECAST Q2 W26 D24 Y25
Professional Risk Managers👋
Welcome back to another FRGNT chart update📈
Diving into some Forex setups using predominantly higher time frame order blocks alongside confirmation breaks of structure.
Let’s see what price action is telling us today!
💡Here are some trade confluences📝
✅Daily order block
✅1H Order block
✅Intraday breaks of structure
✅4H Order block
🔑 Remember, to participate in trading comes always with a degree of risk, therefore as professional risk managers it remains vital that we stick to our risk management plan as well as our trading strategies.
📈The rest, we leave to the balance of probabilities.
💡Fail to plan. Plan to fail.
🏆It has always been that simple.
❤️Good luck with your trading journey, I shall see you at the very top.
🎯Trade consistent, FRGNT X

EU,AU,Oil Trading TalksThanks for tuning in guys coming with a lot of free sauce that might help you in the coming weeks to have success in this market

AudUsd Trade IdeaAU is currently bearish on higher time frames with smaller time frames still respecting a Lower High. If price can give the pullback to retest the LH then we could expect price to continue with bearish structures where a 1:3rr could come into play. We could even expect price to tap back into the previous low or even hit the level I have marked below. We'll see what happens.

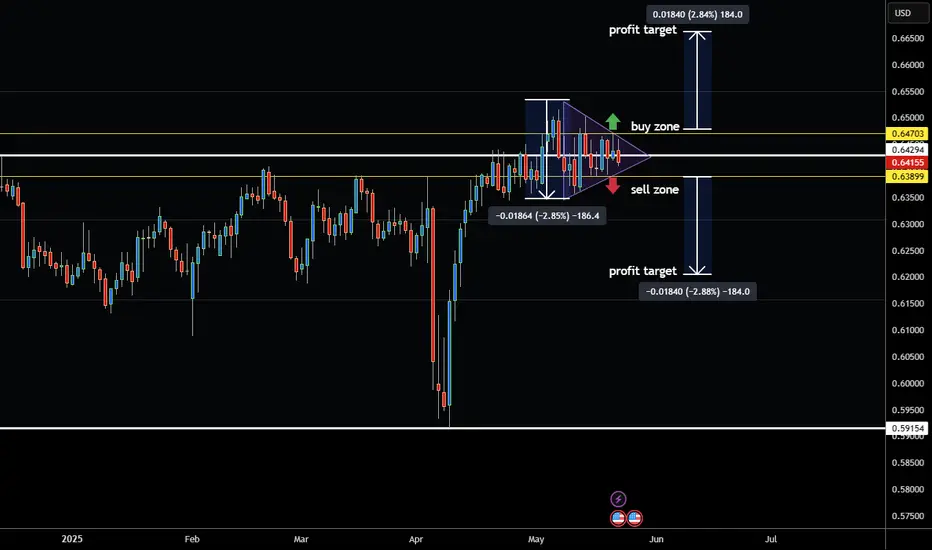
Australian Dollar Consolidation Which Way From Here?Hey traders so today we are going to look at the Austrailian Dollar which is now in chart pattern called a Symetrical Triangle.
So how do we know which way to trade the market right now?
We don't so why guess when instead we can wait for the market to confirm which way it wants to go.
These are normally known as a consolidation patterns, and normally they can break out in the direction of the prevailing trend which appears to be bullish. However they can also break against the trend so the best way to trade it is watch which side it breaks then place an order to enter on the side that market breaks out of. The the other side can then become your stop loss because most likely the market won't go to the other side.
For profit target you can measure the distance of the triangle from top to bottom so in this example 183 pips or ticks.
Always use Risk Management! (just in case your wrong in your analysis)
Hope This Helps Your Trading
Clifford
AUDUSD SETUPWe will enter the given setup .
Watch for market shift on LTF for confirmation entry .
Please follow to support me !
Very Great Short!Hello All. As I told you before( in very Higher TF analysis) market would collapse soon. Now it is time to go to a lower time frame and catch the market with 30 R:R ratio. and I wanna tell you after ending the war between Israel and Iran (and Victory of Iran for sure), Market will be accelerate falling. be happy and have a great time(wink)

AUD/USD SELLERS WILL DOMINATE THE MARKET|SHORT
Hello, Friends!
AUD/USD pair is trading in a local uptrend which we know by looking at the previous 1W candle which is green. On the 1D timeframe the pair is going up too. The pair is overbought because the price is close to the upper band of the BB indicator. So we are looking to sell the pair with the upper BB line acting as resistance. The next target is 0.636 area.
Disclosure: I am part of Trade Nation's Influencer program and receive a monthly fee for using their TradingView charts in my analysis.
✅LIKE AND COMMENT MY IDEAS✅

AUDUSD H4 AnalysisAUDUSD Showing a Bearish Flag. If it breaks this zone above, Most probably can fly up to 0.65018 and higher to 0.65379. If no, Can rally between 0.64068 or even lower to 0.63878. Trading Analysis from 23-06-25 to 27-06-25. Take your risk under control and wait for market to break support or resistance on smaller time frame. Best of luck everyone and happy trading.🤗


AUDUSD Potential Long - Dependent on PA Market openAUD/USD Long Setup – 15M Chart Analysis
Looking at a potential long on AUD/USD after price tapped into demand and swept liquidity. The area aligns with a fair value gap and previous order block, suggesting interest from larger players.
Two Entry Options:
1. Aggressive: Buy limit at the order block (riskier, no confirmation).
2. Conservative: Wait for break of structure, then retest into FVG with bullish price action for confirmation.
Targets:
Target 1: 0.6470
Target 2: 0.6480
Target 3: 0.6490
Extended Target: 0.6530 (only if 0.6490 is breached and price holds above)
Important Notes:
This setup is forecast-based and depends on how price opens and reacts.
Entry should follow a clear confirmation, especially after a liquidity sweep.
Ideal confirmation: Break of structure followed by a retest with bullish PA on lower timeframes (M5/M1).
Invalidation: A clean break and close below 0.6430 would invalidate this idea.
Stay disciplined. Trade the plan, not the prediction.

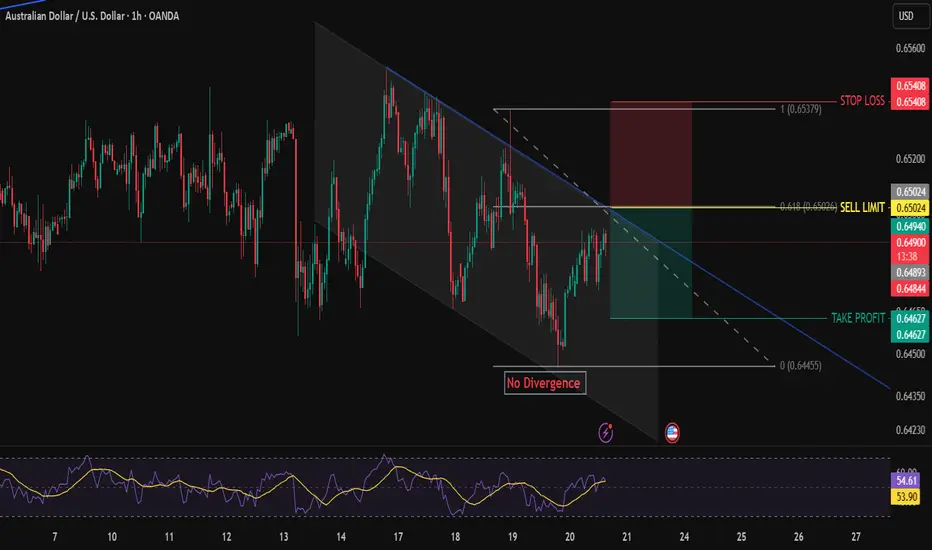
AUDUSD BEARISH SETUP AUDUSD price is moving in down trend.
At rsi no divergence no any reversal pattern.
I will take entry at fib level 0.618 , also here is the bearish trend line.
Sell limit order with SL is previous LH.
Manage your trade accordingly.
Long trade
🟢 Trade Journal Entry – Buyside Trade
📍 Pair: AUDUSD
📅 Date: Tuesday, June 17, 2025
🕒 Time: 3:00 PM (NY Session PM)
⏱ Time Frame: 1 Hour
📈 Direction: Buyside
📊 Trade Breakdown:
Entry Price 0.64738
Profit Level 0.65380 (+0.99%)
Stop Loss 0.64639 (−0.15%)
Risk-Reward
Ratio 6.48 : 1
🧠 Context / Trade Notes:
1HR TF Execution:
Entry aligned with bullish OB on the 1hr chart following a clean mitigation and rejection candle.
Stacked Confluences:
Liquidity sweep, OB retest, and session timing aligned for a high-conviction buyside setup.

AUDUSD | BearishAUDUSD is in bearish trend and following the continuation pattern with bearish flag formation.A new trade can be taken once it breaks its second lower low level.

AU-longas of now structure has broken to the upside and given us a equal high. we should wait for more data before we enter for a buy .

AUDUSD – Intraday/Swing LongSetup: Intraday entry with swing target. Watching for long opportunity on AUDUSD
Bias: Bullish – based on structure and support zone from higher TF.
This exact setup was tested over 300+ trades across the last 2.5 years. It showed:
– ~42% win rate
- Profit Factor 2.9
– Average R:R = 4:1
– Profitability proven on major FX pair AUDUSD
- Losing Streak 5
- Winning Streak 4
Execution: Limit order active until 0.64950 – will cancel if price reaches that level.
⚠️ Disclaimer ⚠️
This is not financial advice or an investment opportunity. I’m sharing my own approach based on long-term data and personal strategy development.
If you want to trade like this – start with proper backtesting and understand your strategy's edge. Almost any strategy can be profitable – the key is in understanding the data and how to manage risk.
💡 For more trading ideas and insights, feel free to follow me here on TradingView!

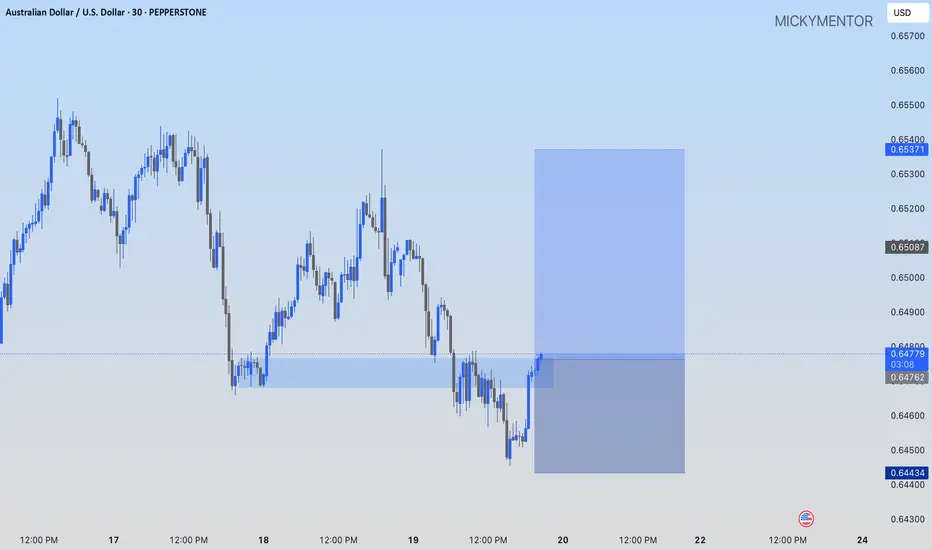
AUDUSD: AN OPPORTUNITY TO GO LONGPEPPERSTONE:AUDUSD I'm buying at the current market price to the 0.65371 price level
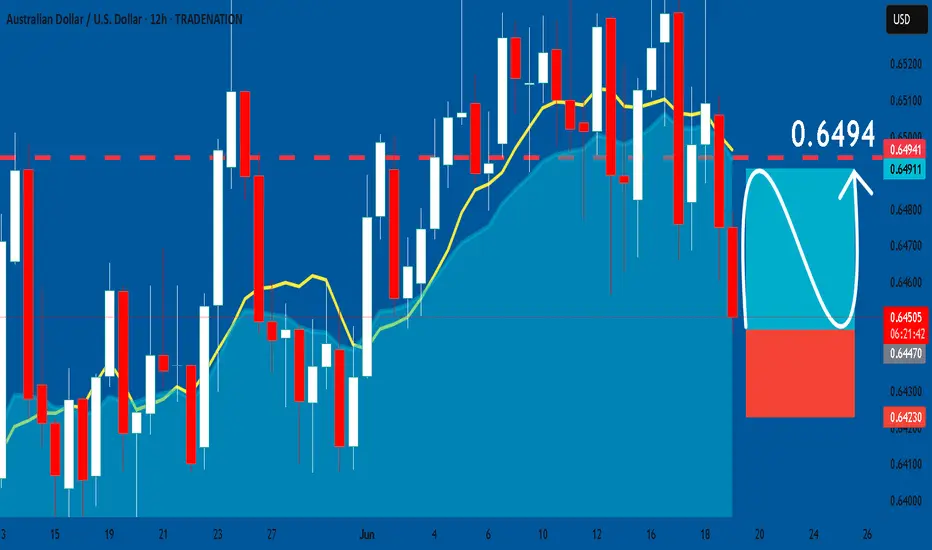
AUDUSD: Long Trade with Entry/SL/TP
AUDUSD
- Classic bullish pattern
- Our team expects retracement
SUGGESTED TRADE:
Swing Trade
Buy AUDUSD
Entry - 0.6447
Stop - 0.6423
Take - 0.6494
Our Risk - 1%
Start protection of your profits from lower levels
Disclosure: I am part of Trade Nation's Influencer program and receive a monthly fee for using their TradingView charts in my analysis.
❤️ Please, support our work with like & comment! ❤️
AUDUSD Will Go Down! Short!
Take a look at our analysis for AUDUSD.
Time Frame: 4h
Current Trend: Bearish
Sentiment: Overbought (based on 7-period RSI)
Forecast: Bearish
The market is testing a major horizontal structure 0.646.
Taking into consideration the structure & trend analysis, I believe that the market will reach 0.643 level soon.
P.S
The term oversold refers to a condition where an asset has traded lower in price and has the potential for a price bounce.
Overbought refers to market scenarios where the instrument is traded considerably higher than its fair value. Overvaluation is caused by market sentiments when there is positive news.
Disclosure: I am part of Trade Nation's Influencer program and receive a monthly fee for using their TradingView charts in my analysis.
Like and subscribe and comment my ideas if you enjoy them!

AUDUSD Selling Trading IdeaHello Traders
In This Chart AUDUSD HOURLY Forex Forecast By FOREX PLANET
today AUDUSD analysis 👆
🟢This Chart includes_ (AUDUSD market update)
🟢What is The Next Opportunity on AUDUSD Market
🟢how to Enter to the Valid Entry With Assurance Profit
This CHART is For Trader's that Want to Improve Their Technical Analysis Skills and Their Trading By Understanding How To Analyze The Market Using Multiple Timeframes and Understanding The Bigger Picture on the Chart

Audusd bearish setupaccording to my analysis audusd breaks the major support level. now its start the bearish trend by making LH and LL. Fundamentallay aud numbers are not impressive as employment data is not good.
