AUDZAR trade ideas
AUD/ZAR: Long-Term Bullish Trend with Key Consolidation LevelsKey Observations:
Support and Resistance Levels:
All-Time Low: Around 5.5000
Highlighted Support Zones:
Around 8.7722 - 9.0948 (Red shaded zone) - This has been tested
Around 11.0000 (Recent support zone marked as HL)
Highlighted Resistance Zones:
Around 12.5000 (Green shaded zone, near HH and All-Time High) - This has been tested
All-Time High and major level at around 12.6800
Ascending Trend Line : Connecting higher lows (HL) from 2018 onwards.
Higher Highs (HH) and Higher Lows (HL):
Higher Highs (HH) : Indicate a bullish trend in the long term, showing that the price is making new highs over time.
Higher Lows (HL) : Indicate continued bullish sentiment as lows are higher than previous lows, supporting the trendline.
Current Price Action:
Current Price: Around 12.1581, showing a slight positive movement (+0.0229 or +0.19%).
Price Consolidation: The price is consolidating between the support level of 11.0000 and the resistance level of 12.5000.
Ascending Trend Line Support: The price is currently supported by the ascending trend line, suggesting that the long-term bullish trend is still intact.
Potential Scenarios:
Bullish Scenario:
If the price breaks above the resistance zone around 12.5000 and sustains above it, it could aim for the next resistance level near the all-time high of 13.0000-13.5000.
Continued higher highs and higher lows would confirm the bullish trend.
Bearish Scenario:
If the price fails to hold the ascending trend line support and breaks below the recent support around 11.0000, it might test lower support levels around 8.5000.
A break below the ascending trend line could signal a reversal or a more extended correction phase.
Sideways Movement:
The price might continue to consolidate between 11.0000 and 12.5000, forming a range-bound movement until a clear breakout direction is established.
AUDZAR BUYI am seeing it go all the way up from the technical side but fundamentals always have the last word . The first reason why I see a buy is the fact price reached a previously tested support and gives us a third touch confirmation as you can see with the rectangle.
The second reason I buy id the fact I seer the price has tested the bullish channel's support .
I am crazy about technical analysis , but for me to enter a trade I will always wait for the fundamental confirmation . So as third confirmation , on the Australia Company Gross Operating Profits QoQ news release we have an actual reading of 7.1 % and is 4.1% more than the forcast being 3.0% , I am sure it will move the price up.
I do not use technical indicators because they can be lagging behind the prices sometimes . I hate entering late .
If you have a certain setup with indincators that helps you and you are willing to share , feel free to let me know. Thank you !
AUDZAR ForecastAUDZAR H4 -Down
.
Khiwe
At this profile page, the shared analysis, ideas and also, the strategy of a chart belong to Khiwe with some being influenced. The technical set-ups are speculative, they are not guaranteed for accuracy or in completeness in the form of any content; -it is not to advice on financial markets. Please apply your own analysis and confirm it with price action.
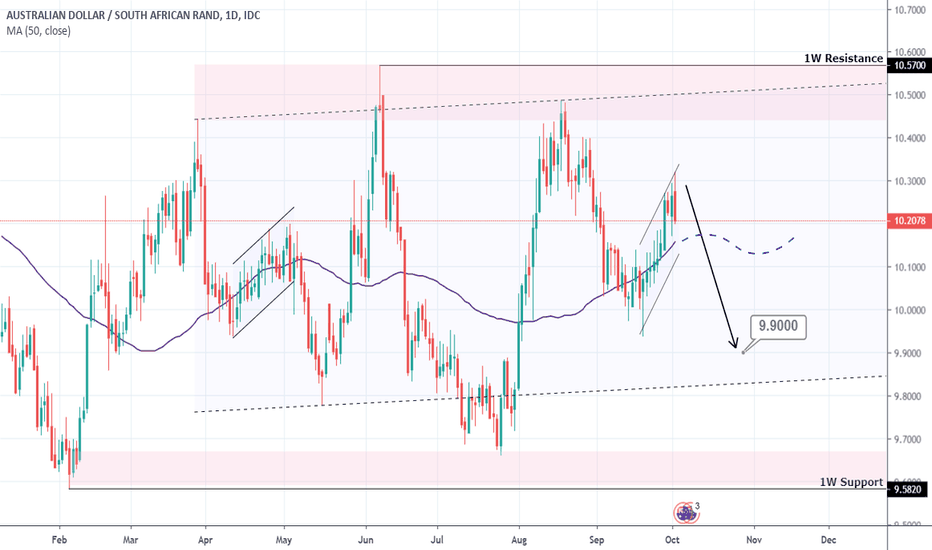
Short for this pair, cant trade it because Im on Ouanda, o wellRespecting 50ema line, down trend. Supports become resistance. Its going downnnn
Long term bullish trendSouth African Rand is entering a relative strength period against the Australian Dollar that unleash 2 trading Ideas.
First Idea: buy for 10-20% profit with similar stop-loss.
Second Idea: buy for long term (at least 1 year) and benefit from both positive interest differential and positive trend for at least 30% estimated gain with 20% stop-loss.


