Travala Moves Above EMA55 With A Bullish RSI (PP: 650% Easy)This chart I shared recently so it is basically the same but it looks great cannot be missed, ok? Ok! Let's together trade.
My dear friend, reader, follower, supporter, dear Cryptocurrency news reporter, traders, truth seeker and wow!!! How are you feeling in this wonderful day?
Not many people lo
Related coins

Travala: Classic Simple Signals & 625% Profits Potential Here is a list of classic, simple (bullish) signals:
Higher lows.
Break above EMA55 daily.
Bullish RSI (Above 50).
Marketwide bullish recovery.
Strong Bitcoin (Above 80K).
» These signals are pointing toward a bullish wave of 625% in the short- to mid-term. Within 1-3 months.
Did yo

Critical Levels for AVABTC: Don't Miss These Signals - Traval...◳◱ On the BINANCE:AVABTC chart, the Trend Reversal pattern suggests indications that the trend may be gaining or losing strength. Traders might observe resistance around 0.0000091 | 0.00000998 | 0.00001223 and support near 0.00000685 | 0.00000548 | 0.00000323. Entering trades at 0.00002291 could

Trading Signal: AVABTC Pair Movement PredictionDear Traders,
We have identified a promising trading opportunity for the AVABTC currency pair. Based on our analysis utilizing the EASY Quantum Ai strategy, we recommend a Buy position.
Enter Price: 6.31E-06
Take Profit: 6.45E-06
Stop Loss: 6.15E-06
Justification for Prediction:

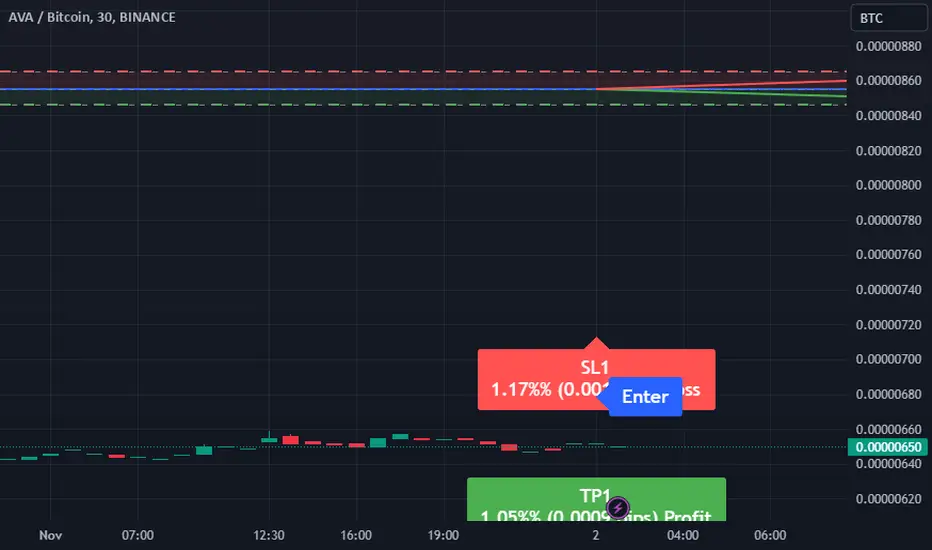
AVABTC Trading Signal: Sell OpportunityDear Traders,
Our analysis, conducted using the EASY Quantum Ai strategy, indicates a selling opportunity for the AVABTC pair. Below, we present the details of this trade setup:
- Direction: Sell
- Enter Price: 8.55E-06
- Take Profit: 8.46E-06
- Stop Loss: 8.65E-06
Analysis Justification:
Our
AVA BTC - TravalaWelcome Travala to the cycle lows.
Accumulation advised here.
First target is 0.00002244 - flip this and 0.00003432 is next
Easy x2 at minimum.
RSI showing bullish divergence on high time frame.
Looks even better on the USD pair.
Pray next macro bubble creates fresh highs...

Travala (AVA) Next targetsAVA vs Bitcoin : Same thing here, AVA is trading at a resistance line with Bitcoin,
the price it looks even better with the USD pair.
The fundamentals behind this coin, it travelling.
Well we have a full season ahead of us in this regard.

Travala Grew 4,743% In 2019-20 | Cryptocurrency Goes MainstreamThe 4,743% bullish wave by Travala between 2019 and 2022 lasted a nice 356 days.
The bull-run phase alone lasted about 6 months.
Imagine how such action would look and feel like today, with Bitcoin currently at 50,000+?
➖ If AVABTC produces a relatively weak wave, it would grow around 250%.
This t

✳️ Travala | Potential Bottom CatchThis looks like a pair that hit bottom and is getting ready to move up. AVABTC hit its lowest price in more than 3 years, 3 years and 3 months to be exact.
The RSI is oversold and slowly starting to recover.
If this doesn't recover, the risk is ultra-low, the potential is huge.
Good catch.
Namas

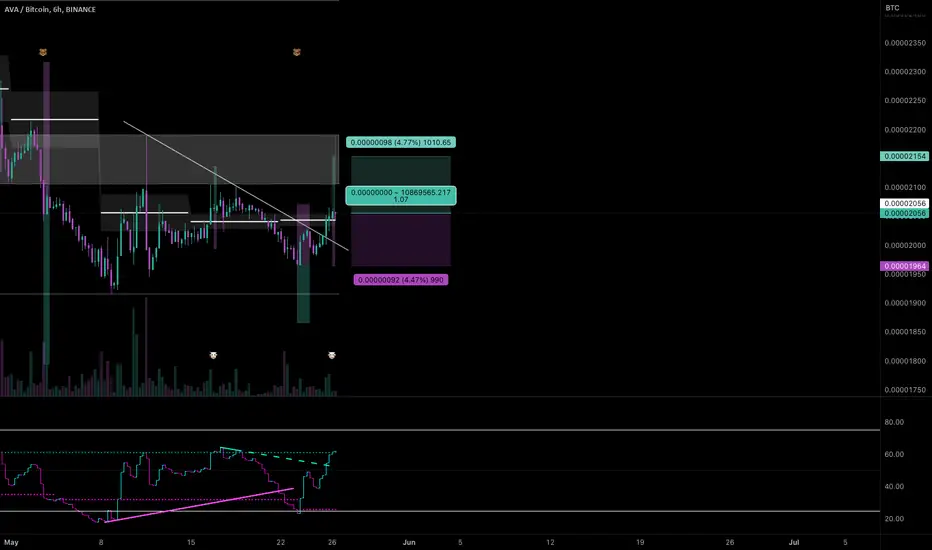
#AVA/BTC - Long - Potential 4.7%Direction: Long
Market: Spot
Risk: 0.25% - 1%
#BTC_AVA
Exchange: BINANCE
Timeframe: 360
TP1: 0.00002154
Entry: 0.00002056
STOP: 0.00001964
Entry Conditions:
| Trendbreak
| CDV trend & resistance break
See all ideas
Summarizing what the indicators are suggesting.
Oscillators
Neutral
SellBuy
Strong sellStrong buy
Strong sellSellNeutralBuyStrong buy
Oscillators
Neutral
SellBuy
Strong sellStrong buy
Strong sellSellNeutralBuyStrong buy
Summary
Neutral
SellBuy
Strong sellStrong buy
Strong sellSellNeutralBuyStrong buy
Summary
Neutral
SellBuy
Strong sellStrong buy
Strong sellSellNeutralBuyStrong buy
Summary
Neutral
SellBuy
Strong sellStrong buy
Strong sellSellNeutralBuyStrong buy
Moving Averages
Neutral
SellBuy
Strong sellStrong buy
Strong sellSellNeutralBuyStrong buy
Moving Averages
Neutral
SellBuy
Strong sellStrong buy
Strong sellSellNeutralBuyStrong buy
Displays a symbol's price movements over previous years to identify recurring trends.