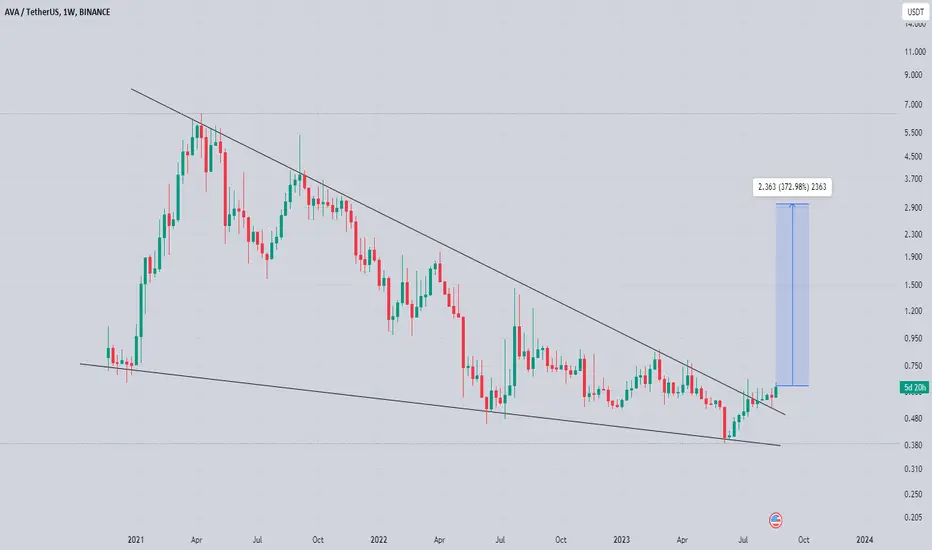
Ava Looking Ready For Solid Recovery Seems Like Ava Has already Bottomed Out And Getting ready for Massive recovery Falling Wedge Breakout Has already confirmed In Weekly Tf Retesting In Process In Case Of Successful Retest Expecting 340 to 360% bullish Rally In Midterm
AVAUSDT.P trade ideas
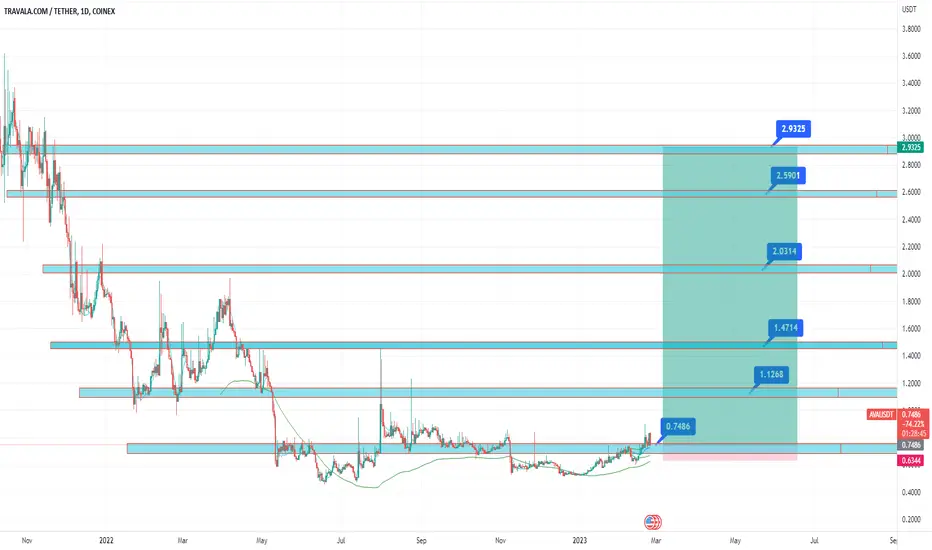
Travala.com (AVA) - oversoldOn the above 1-day chart price action has corrected over 80% since last April. Now is an excellent moment to take a long position. Why?
1) The ‘incredible buy’ signal. Also prints on 6-day chart (below) following the previous sell signal.
2) Trend reversal. Price action AND RSI are now printing higher highs / higher lows. Excellent.
Is it possible price action falls further? For sure.
Is it probable? No.
Timeframe: 2-4 months
Projected return: 6 to 10x
Portfolio exposure < 6%
Good luck!
Ww
6-day buy signal

Ava crashing structure almost completed Hi all!
1 this is not financial advise! Do your own research ;) I am just having fun…
On the 1 hour chart I find out that the crashing structure is almost done,
The price should go now to nr 6 that should not go higher than nr 4 in wave 5, after that we should revisit one more time the low (7) what should be around wave 5 or slightly under before we make are way up again.
Greetings,
Please leave a comment…

Matic Trend LineMATIC has been on a downtrend and is consolidating for a big move. If MATIC breaks the triangle trend and hit in the ICHI cloud we can expect a huge up swing.

AVAUSDAVAUSD
Thoughts
After a long fall, buyers were able to buy back the main supply of the coin and pull the price into a sideways trend.
Over time, volatility began to fall, thereby finally making it clear that the Descending Triangle pattern is forming.
At the moment, the price was able to adjust with the global resistance of the triangle.
For altcoins, breaking through global trends often occurs on the second attempt, while for BTC on the first.
AVA already had one attempt to break through, after which the price was rolled back with a long squeeze. After local accumulation, we again see an impulse, which, with a high degree of probability, will break through the resistance.
☑️ Global breakout targets are indicated on the chart by blue lines: $1.047 - $1.361 - $1.788
But remember that everything can change at any time, you need to be flexible and monitor the market. Happy trading.
If you like the idea, don't forget to subscribe and rate like👍

$AVAthis little bubba gonna get sent so hard ... below 650 invalidation target moon
flip 200 ema and go to blue line above

AVA/USDT - Travala.com: Resistance_Breakout_Confirmation◳◱ A Resistance Breakout and Confirmation has been detected on the $AVA / $USDT chart. The price has broken above a key resistance level and has been confirmed by a strong candle, indicating a potential bullish trend. The next resistance key levels are located at 0.627 | 0.657 | 0.716, and the major support zones can be found at 0.568 | 0.539 | 0.48. Consider entering a trade at the current price zone of 0.613 and targeting higher levels.
◰◲ General info :
▣ Name: Travala.com
▣ Rank: 457
▣ Exchanges: Binance, Kucoin, Gateio, Poloniex, Mexc
▣ Category/Sector: Payments - Payment Platforms
▣ Overview: None
◰◲ Technical Metrics :
▣ Mrkt Price: 0.613 ₮
▣ 24HVol: 615,191.251 ₮
▣ 24H Chng: 1.322%
▣ 7-Days Chng: -0.76%
▣ 1-Month Chng: -8.88%
▣ 3-Months Chng: 13.61%
◲◰ Pivot Points - Levels :
◥ Resistance: 0.627 | 0.657 | 0.716
◢ Support: 0.568 | 0.539 | 0.48
◱◳ Indicators recommendation :
▣ Oscillators: BUY
▣ Moving Averages: STRONG_BUY
◰◲ Technical Indicators Summary : STRONG_BUY
◲◰ Sharpe Ratios :
▣ Last 30D: -1.32
▣ Last 90D: 1.02
▣ Last 1-Y: -0.41
▣ Last 3-Y: 0.95
◲◰ Volatility :
▣ Last 30D: 0.66
▣ Last 90D: 0.79
▣ Last 1-Y: 1.14
▣ Last 3-Y: 1.35
◳◰ Market Sentiment Index :
▣ News sentiment score is N/A
▣ Twitter sentiment score is 0.75 - Bullish
▣ Reddit sentiment score is 0.76 - V. Bullish
▣ In-depth AVAUSDT technical analysis on Tradingview TA page
▣ What do you think of this analysis? Share your insights and let's discuss in the comments below. Your like, follow and support would be greatly appreciated!
◲ Disclaimer
Please note that the information and publications provided are for informational purposes only and should not be construed as financial, investment, trading, or any other type of advice or recommendation. We encourage you to conduct your own research and consult with a qualified professional before making any financial decisions. The use of the information provided is solely at your own risk.
▣ Welcome to the home of charting big: TradingView
Benefit from a ton of financial analysis features, instruments and data. Have a look around, and if you do choose to go with an upgraded plan, you'll get up to $30.
Discover it here - affiliate link -

✴️ Travala Long-Term High Lows ($1.4 Next Target or 125%)Travala (AVAUSDT) has been printing higher lows since June 2022 which is long-term (more than 6 months).
This is accompanied by bullish indicators and a strong bullish market all across.
The market has been bullish for a while but people are only starting to notice now because the action is becoming strong.
This is good... More people join the market, the stronger the pairs get which leads to better results.
While we will experience massive growth, this is not the climax, we are only halfway through and some time is left for fireworks.
Easy target 70% to 125%... There can be more.
Namaste.

Ava On Verge Of Massive Breakout Seems Like getting ready for Massive breakout
Forming Symmetrical Triangle
Approaching Towards Major trendline Incase Of Ava Cleared Both resistance Then Expecting Massive Recovery In coming Weeks
Incase Of Successful Breakout expecting 2.70$

AB=CD BEARISH PATTERN AVA USDTDear Tradingview family, Methodology:
As a professional and experienced forex, crypto and stocks trader, I will be using a rigorous methodology that involves analyzing the price action and key levels and using a combination of indicators, harmonic chart patterns and chart patterns. I will be looking for potential trendlines , support & resistance levels where the price action may reverse and using our indicators to confirm the validity of our analysis. Based on my analysis, I will then determine the optimal entry and exit points for our trade, as well as the appropriate stop loss level to manage risk.
Conclusion:
Based on our analysis, I believe that there is a potential trading opportunity for a SHORT trade.
Risk Assessment:
Conservative Traders risk 0.5% to 1.5%, moderator traders risk 1.6% to 3.5% and aggressive traders risk 3.6% to 5% of their account per trade.
Please use Position size calculator to calculate your risk per trade.

AVAUSDT volume increasing with high potential to reach 290 hidden
inverse head and shoulders seen apotential target of 2.25 is confirmed trade is active in march explode
AVA patternsThis chart is for check and learning purpose only. I don't give any kind of advice to anyone, cause i am in the learning phase. Just checking how it goes.

AVA BIG CHARTAVA
Just broke through a downtrend since April 2021
The maximum target in this bullish wave is $1.6
Be flexible by booking profits at every strong target or selling area.


AVA/USDT | Pretty Solid Consolidation..!!
#AVA Forming Descending Channel in the Weekly timeframe Chart.
Looks Bullish here & Seems like Ready for Massive Breakout..
Bulls need to Close the Weekly Candle Above 0.6$ to Confirm the Breakout.
In Case of Upside Breakout, Expecting 3-4x Bullish Rally in the Midterm..
Please like the idea for Support & Subscribe for More ideas like this and share your ideas and charts in Comments Section..!!
Thanks for Your Love & Support..!!

AVAUSDT Expecting a bull move as ORDER Block availabilityAVAUSDT Expecting a bull move as ORDER Block availability, i am expecting up move avabnb

AVA token price prediction (Crypto)AVA token price prediction , I am expecting a range before getting strength in this token depending on BTC Move avabtc

long avaCheck this currency yourself. Maybe it will be pumped, the purchase range is characteristic. The sales range is also characteristic.

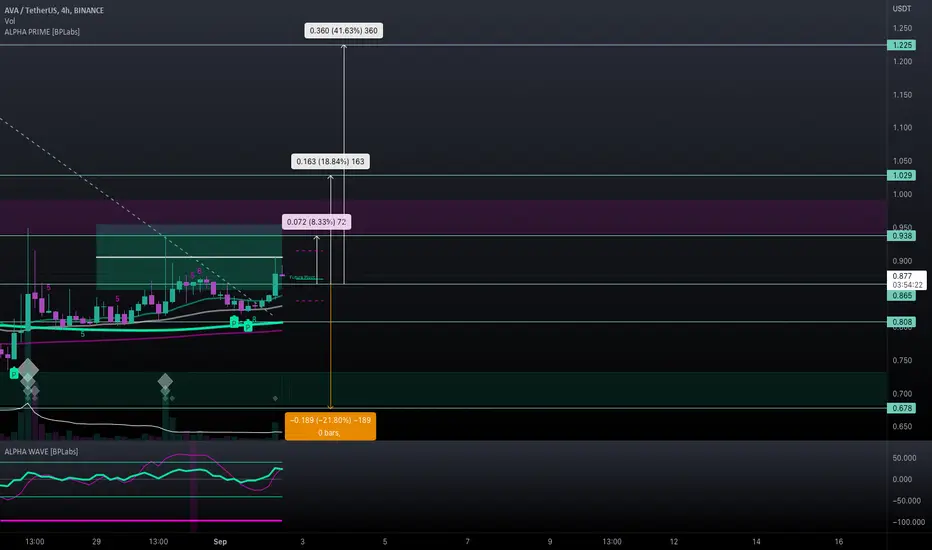
#AVA/USDT - Long - Potential 41.63%AVA has broken out following Binance listing it as a borrowable asset on cross margin and isolated margin.
Long term trendline has been broken, employ a breakeven SL and lock in profits as chances of being rejected at resistance could be increased by the RSI creeping oversold.
#AVA/USDT - Long - Potential 41.63%
Exchanges: KuCoin, Binance
Signal Type: Regular (Long)
Entry Zone:
0.881
Take-Profit Targets:
1) 0.938 - 33.333%
2) 1.029 - 33.333%
3) 1.225 - 33.333%
Stop Targets:
1) 0.678 - 100.0%
Trailing Configuration:
Entry: Percentage (0.0%)
Take-Profit: Percentage (1.0%)
Stop: Breakeven -
Trigger: Target (1)
Travala.com (AVA) formed bullish Gartley for upto 102% pumpHi dear friends, hope you are well, and welcome to the new update on Travala.com (AVA) token with US Dollar pair.
Recently, we had a nice trade of AVA:
Now on On a 4-hr time frame, AVA has formed a bullish Gartley pattern:
Note: Above idea is for educational purpose only. It is advised to diversify and strictly follow the stop loss, and don't get stuck with trade

AVAUSDT(Travala) Daily tf Range Updated till 31-07-22AVAUSDT(Travala) Daily timeframe range. this alt packed with decent volume which is cool and the chart offers lots of data. the more data a price action offers the more options for trading setups. recently for btc price action many alt got their breathing room. even through volatile days of btc it held its lows by a very longer period which clear about its quality. i can see reasonable swing and scalp setups on its range space from both sides.

AVAUSDT 6H TA: Can Pump Again?Due to the chart, after reaching the support range, pump 80% avausdt, candle has reached the resistance area again, if the range is broken, it will be pumped again and otherwise it will be corrected, suggesting that Enter if the resistance is successfully broken.
Its not Buy or Sell SIGNAL
DYOR
BY : Mohamad Teriz - @AtonicShark

AVA USDT LONGAVA/USDT right now has a great risk reward.
buy below 0.65$
stop it if daily closes below 0.585
Sell 75% at 0.77
Sell 25% at 1.05
