AVAXBTC trade ideas


$AVAX Dip if confirmationIf uptrend is back from BTC and ETH and big candle on Avax I might buy the dip

AVAX breakoutAVAX has broken the trendline and after retest made it above ~80000-80500 resistance. Next resistance at ~93300 and after that we may target even 120000.
Very good bullish chart. Worth holding for higher targets.

#AVAX Avalanche long trade possibility#AVAX #BTC pair and #USDT pair looking strong. If BTC move sideways and don't mess up then we might see a breakout and upward move from AVAX. Worth watching this.

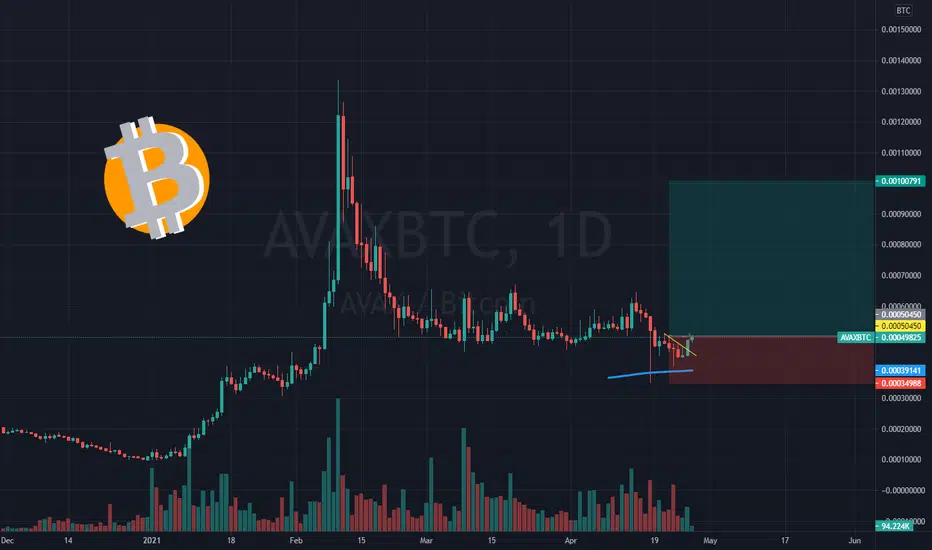
Can AVAXBTC cause an Avalanche with 90% gains?Many large caps have pumped while this Avalanche AVAX remained asleep. This $4.5B market cap has been consolidating since Mar 2021 and remained flirting with the 50D & 100D EMA that became closely paralleled.
My entry level is marked in blue and the almost 90% gains target marked in green. The only thing remaining is the Avalanche to move.
What do you think? And what is your exit target for this gem?

AVAXBTC - Long - Potential 18.09%AVAXBTC - Long - Potential 18.09%
Exchanges: Binance
Signal Type: Regular (Long)
Entry Zone:
0.00070597 - 0.00072689
Take-Profit Targets:
1) 0.00077075
2) 0.00085764
Stop Targets:
1) 0.00066255
Trailing Configuration:
Entry: Percentage (0.0%)


congrats for braking out the accumulation zone Surprising...
Since we are above the strong support, AVAX may be profitable :)

$AVAX Kinda like this one.. $AVAX
Kinda like this one..
Crossing/flipping into support ~60k sats level (potential breakout on the /USD pair)
UCTS 1D Buy signalling the entry 2 days ago..
If its able to get some traction (volume), then aiming toward ~75k sats+
#AVAX


looks so ready for a move higher On April 29th i posted the $AVAR buy setup... the 1st Take Profit got reached.
Now the chart looks set for a move higher.. Great entry after close above the Support/resistance

AVAXBTC - 40% Upside & Critical Levels MappedThe patterns make the bullish case for themselves.
Our idea can only get invalidated if BTC Dominance closes above 50 or we face a big correction. Remember that the current levels, 57k, correspond to the top band of our parallel channel, therefore, it would not be surprising to see a more severe pullback. If BTC closes above 58k, re-evaluate your entry with the Dominance chart and BTC on-chain signals. If BTC falls to 56k, don't worry, there is an important support there and we would prefer to see some sideways action in that region for our favorite alt's to rally. However, if BTC closes below 55k, remember that there is a possibility for us to visit the 21W MA, which "could" correspond to a 45k. For the latest scenario, there aren't many on-chain signals to back it up.
This is not financial advice. Use risk management.

Crypto|AVAX/BTC|LongLong AVAX/BTC
Activation of the transaction only when the blue zone is fixed/broken.
The author recommends the use of anchoring fixed the blue zone, this variation is less risky.
If there is increased volatility in the market and the price is held for more than 2-3 minutes behind the activation zone after the breakdown, then the activation of the idea occurs at the prices behind the activation zone.
The idea is to work out the resistance level .
* Possible closing of a trade before reaching the take/stop zone. The author can close the deal for subjective reasons, this does not completely cancel the idea and is not a call to the same action, you can continue working out the idea according to your data, but without the support of the author.
+ Maybe right now we will go even lower, then it's okay, the idea is not activated and simply canceled.
+ ! - zone highlighted by the ellipse is a zone of increased resistance, in this area there is a possible reversal for a correction, please take this factor into account in this transaction.
The "forecast" tool is used for more noticeable display of % (for the place of the usual % scale) of the price change, I do not put the date and time of the transaction, only %.
Blue zones - activation zones.
Green zones - take zones.
Red zone - stop zone.
Working out the stop when the price returns to the level after activation + fixing in the red zone.
Orange arrow - the direction of take.
The red arrow - the direction of the stop.
SUM PNL: This parameter displays the total % of all closed ideas of the "new" format (according to the author) for this sector at the time of publication of the idea. The calculation is very "clumsy" just the sum of the profits of all the ideas, based on this indicator, you can more accurately assess the risks when working with my ideas of this sector. I present you the construction of the idea, you can use it yourself as you like based on your subjective view and risks, the calculation of the PNL indicator is carried out only on transactions that the author closed on TV in manual mode or by take.
P.S Please use RM (risk management) and MM (money management) if you decide to use my ideas, there will always be unprofitable ideas, this will definitely happen, the goal of the system is that there will be more profitable ideas at a distance.

Break then Buy I am looking for a S/R flip to get long and target a potential 80% move higher against Bitcoin.

AVAXBTC - Long - Potential 17.30%AVAXBTC - Long - Potential 17.30%
Exchanges: Binance
Signal Type: Regular (Long)
Entry Zone:
0.00049583 - 0.00051438
Take-Profit Targets:
1) 0.00053884
2) 0.00060372
Stop Targets:
1) 0.00047094
Trailing Configuration:
Entry: Percentage (0.0%)

AVAX/BTC 🧹Hey hey my friends 👋
I had a subscriber request - AVAX/BTC pair looks really solid here would be a good mid term hold 🦾

AVAX/BTC Bullish PostureThis one seems to have formed a base around this level, if we break and consolidate above the trendline, bullish continuation is expected

AVAXBTC breaking down trendWith the long period of consolidation and down trend that we have been in, it appears AVAX has decided to break the trend.
I would like to see it test this down trend before moving higher as this would be a perfect entry position.
First target for me would be 4.669 fib level if you want to be aggressive.
If you are conservative and feeling antsy to take money off the table, I'd look at the following selling procedure:
TP 1 = 1.618 Fib level - Sell 20%
TP 2 = 2.618 Fib Level - Sell 20%
TP 3 = 4.669 Fib level - Sell 30%
TP 4 = 8.77 Fib level - Sell 15% to 30%
I always recommend leaving some % remaining in the token if you believe this token is not a scam. I typically leave 10%-15% of my initial position in the token as I typically am happy leaving a little bit of the profits on the table because these small % can equal large values when alt season really ramps up.


Crypto|AVAX/BTC|LongLong AVAX/BTC
Activation of the transaction only when the blue zone is fixed/broken.
The author recommends the use of anchoring fixed the blue zone, this variation is less risky.
If there is increased volatility in the market and the price is held for more than 2-3 minutes behind the activation zone after the breakdown, then the activation of the idea occurs at the prices behind the activation zone.
The idea is to work out the resistance level .
* Possible closing of a trade before reaching the take/stop zone. The author can close the deal for subjective reasons, this does not completely cancel the idea and is not a call to the same action, you can continue working out the idea according to your data, but without the support of the author.
+ Maybe right now we will go even lower, then it's okay, the idea is not activated and simply canceled.
+ ! - zone highlighted by the ellipse is a zone of increased resistance, in this area there is a possible reversal for a correction, please take this factor into account in this transaction.
The "forecast" tool is used for more noticeable display of % (for the place of the usual % scale) of the price change, I do not put the date and time of the transaction, only %.
Blue zones - activation zones.
Green zones - take zones.
The red zone - stop zone.
Working out the stop when the price returns to the level after activation + fixing in the red zone.
Orange arrow - the direction of take.
Black arrow - neutral scenario without activating the trade.
The red arrow - the direction of the stop.
SUM PNL: This parameter displays the total % of all closed ideas of the "new" format (according to the author) for this sector at the time of publication of the idea. The calculation is very "clumsy" just the sum of the profits of all the ideas, based on this indicator, you can more accurately assess the risks when working with my ideas of this sector. I present you the construction of the idea, you can use it yourself as you like based on your subjective view and risks, the calculation of the PNL indicator is carried out only on transactions that the author closed on TV in manual mode or by take.
P.S Please use RM (risk management) and MM (money management) if you decide to use my ideas, there will always be unprofitable ideas, this will definitely happen, the goal of the system is that there will be more profitable ideas at a distance.
