AVAX $300+ This Bull RunBuckle up ladies and gentlemen, we are at the part of the cycle where we are nearing the end of the consolidation period and are getting ready to catapult, BTC at any moment will break 62k and when 70k is broken the true alt season run will occur. Avax is putting out a lot of amazing things and doing on chain collabs for example the California DMV is building their titles on AVAX which is actually insane making real life utility. $300 is a good base target but we can easily push 4-500$
AVAXUSD.P trade ideas

Avalanche: Recovery!AVAX recovered last week and rallied within our turquoise Target Zone (between $17.48 and $29.30). We now expect the price to be carried out of the Zone by the turquoise wave 3 and above the resistance at $41.78. However, we still have to keep our alternative scenario (40% likely) in mind. This option calls for a lower low of the turquoise wave alt.2 below the range.

Avax 20.50 is key Risk of 50% correction stillNot financial advice
20.50 is key to have on 3 day closes here or we still run the risk of another 50% downside from here.
Falling wedge pattern.
So you have a few options.
Buy on breakout of falling wedge and cluster around 24-27 range.
2. Buy now and play long game 1 yr plus to see once we recover to retest these local highs.
Option 3
Wait and watch and buy the breakout at higher prices.
I've highlighted 10-14 as target zone if we lose 20.50 range on 3 day closes.
No support under 20 in all reality

Avanalance (AVAX) Short Term Analysis🔷 Near-term resistance @ $22.13
🔷 Major resistance between $24.50 - $26.50 (contains the 50% Fib retrace, Kijun-Sen, and bottom of the Cloud).
🔷 Above $31 = moon for #Avalanche

AVAX - finally going to make a big move??AVAX - finally going to make a big move??
This ones interesting
1. usually it moves out of phase a bit, after the other popular L1's from last cycle. so its good for rotation if one of the others moves hard first.
2. remember that lawyer vid from last cycle; these guys strike me as massive cheeseball scammy mofos ;; but then in crypto who isn't ??
I've decided to play JOE, and its my only AVAX chain play.
Also the chart is not as clear cut as some of the other big ones; eth, btc, sol etc
Looks like there is a chance we are bearish here... but im pretty confident this cycle is not done so early. but always remain vigilant and able to move like water. that is what will save your portfolio.
\
gl

Avax Bear -50%It is about reading the price pattern and the result of the indicators
I will only share with you what the result of the analysis shows.
This could be wrong. MD

AVAX - Diamond bottom on the 4hAVAX is forming a diamond bottom on the 4h and a bull flag can also be considered.
Breakout from 26.30 and moving above the 200 EMA at 28 will solidify this

AVAX/USDT - Long Idea
Dear Traders,
this is the idea i would like to post with you , I can see the potential buying opportunity in this crypto pair but consider this as a long term investment not as a day trading, the more you hold the more you get and prefer buying that in SPOT market so the risk will be less.
THIS IS ONLY MY ANALYSIS "TRADE AT YOUR OWN RISK"

AVAX's run may take a breather⬨ I'm anticipating it consolidating between $31 and $33
⬨ The Composite Index and Detrended Price Oscillator are both at their respective historical resistance levels

AVAX- morning star candle patternAVAX- morning star candle pattern
-Reversal signals.
-Inversed HnS forming pattern at the bottom.
-Key level support.
-Demand zone support.

AVAX - Legendary W Breakout about to happen?Hello guys,
Avax looks like it might have finally formed one of its legendary W Patterns that always pave the wave for an insane breakout.
Not given but possible we have the bottom in and trend up without really pulling back from here.
AM long lOl
Cheers, Mo;

AVAX 2024- Fast Update.
- Everything in Graphic.
- Buy Breakout 50$++. ( always wait Weekly candle on Monday to have confirmation ).
or
- Buy Retracement : 18$ ish ( 25% invest ).
- Buy Bottom : 10$ ish ( 75% invest ).
- TP1 : 150$ ish( old ATH )
- TP2 : before 380 to 500$ ish ( Just don't be greedy ).
Play S4fe
Happy Tr4Ding !

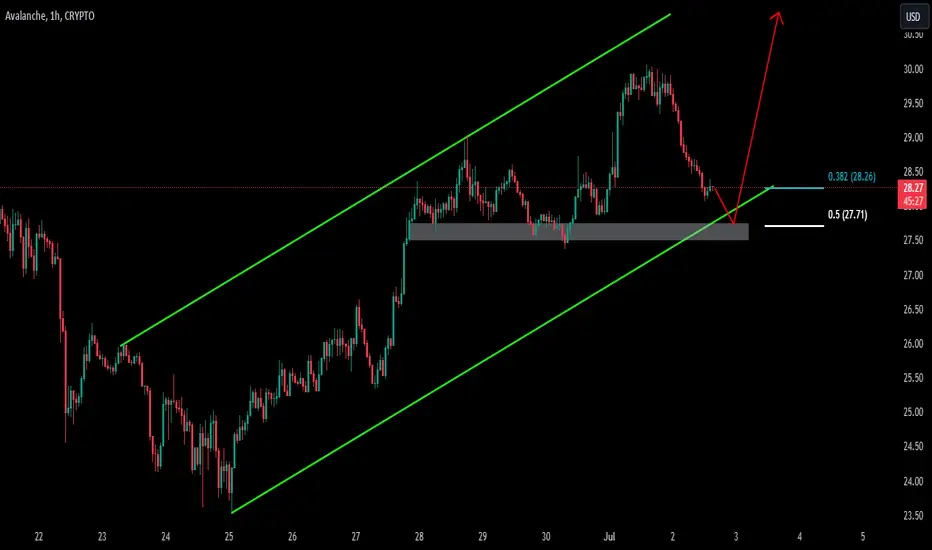
AVAXUSDTAVAXUSDT is in strong bullish trend.
As the market is consistently printing new HHs and HLs.
currently the market is retracing a bit after last HH, which is also the 50% Fib retracement level and local support as well. if the market successfully sustain this buying confluence the next leg up could go for new HH.
What you guys think of this idea?
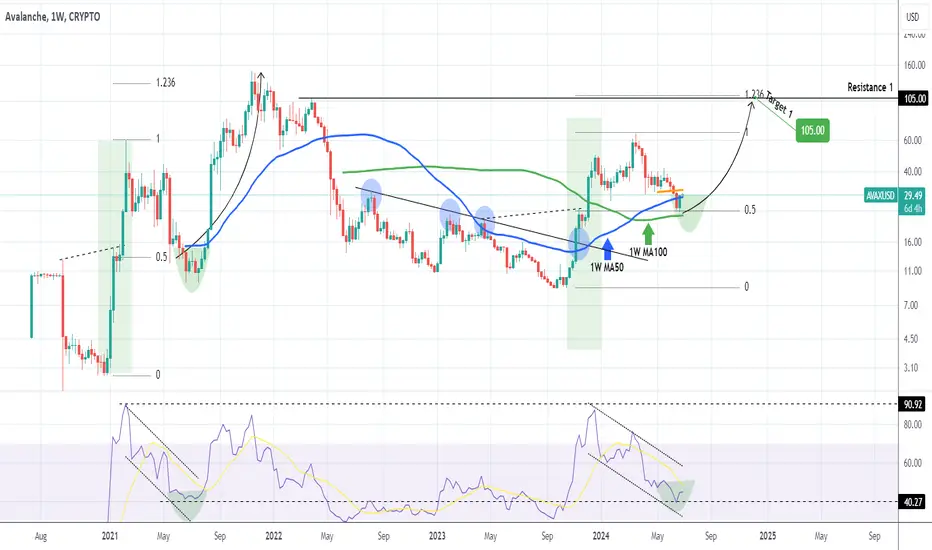
AVAXUSD Bottom formation in process. Target $105.007 months ago we published the following analysis (December 14 2023, see chart below), expecting Avalanche (AVAXUSD), to correct back to the 1.0 Fibonacci level after a potential $55.00 hit:
As you can see the price action didn't fail to deliver our projection, in fact it followed very tightly the February - July 2021 pre-rally pattern of the previous Bull Cycle. Right now it has found Support on the 1W MA100 (green trend-line), while the 1W RSI is on the exact Support level it was on the June 21 2021 bottom.
Even though a marginal decline is possible to satisfy the past condition of slightly breaking below the 0.5 Fib, the current levels are good enough to buy again for the long-term.
As in November 2021, our Target is again the 1.236 Fibonacci extension, which is currently just above the $105.00 Resistance.
-------------------------------------------------------------------------------
** Please LIKE 👍, FOLLOW ✅, SHARE 🙌 and COMMENT ✍ if you enjoy this idea! Also share your ideas and charts in the comments section below! This is best way to keep it relevant, support us, keep the content here free and allow the idea to reach as many people as possible. **
-------------------------------------------------------------------------------
💸💸💸💸💸💸
👇 👇 👇 👇 👇 👇
AVALANCHE/AVAXUSDT REDISTRIBUTEWe might think were super bullish, as a trader Im following my own ideology on charts not on hyping or whatever other people say about a coin. they dont even know what they are doing.
Im expecting higher price on CRYPTOCAP:AVAX @55-60$ per coin.
Not shorting unless we have confirmation, other people automatically trade without knowing it.
how come you know the trade is valid if price or current momentum has no confirmation.
Trade at your own risk.
Im not here to make a execution of your own trade, own it or trade it.
Leverage thing is a dangerous on your account.
Not biasing the short but selling my spot at that current level.

the same thingAvax is going to return around 40$ it's the same situation of 2 month ago
And now it's time to buy this crypto

#AVAXUSD: On the way to 66.00, Buy Swing! Dear Traders,
Hope you are doing great, we have an excellent buying opportunity in form of AVAXUSD which is crypto pair with high potential, we can see price filling the imb zone and reversing from that area. Our main aim here is to wait for price to breakthrough the solid bearish trendline, and then enter when price does confirmation.
Team Setupsfx_

Reverse Avalanche...So after spending a bit of time going over charts recently I'm becoming more confident in my alt season view and have started making forecasts for what I believe will be the most obvious beneficiaries.

AVAXUSD Critical ThreatsSome fitted curved lines that could become relevant in the developments of this market. It looks gloomy with the potential resistance of the green, purple and blue, and while rebounds from these levels can happen, they can also provide opportunities if broken and retested.
Perhaps the blue one is actually more stronger than the other two, so an incursion for it can happen. Not much support curved lines for this one, but the red could be strong enough to keep it in check.
Looking at the potential rebounds at these curved line or break and retests. Open to most of possible scenarios as long as the price action looks relevant to these lines. Some arrows with possible developments highlighted in the snapshot.

Avalanche: Take a dive!AVAX continued to head toward our turquoise Target Zone (between $29.30 and $17.48). We expect a dive into this range before the low of the turquoise wave 2 is placed. Subsequently, the coin should turn around and rally above the resistance at $49.95. Should this level be broken earlier (33% likely), we will have to locate AVAX in the turquoise wave alt.3.


$AVAX - Ready to make the avalanche 3X RunCRYPTOCAP:AVAX looks primed and well-supported at this point. Likely a runner after this for the next 2 month period. A great spot buy that can convert to leverage if market follows.

AVAX update we are noticing bullish pattern is underway and per our previous analysis as below we are following long positions toward 49.18
this update is follow up the below analysis
