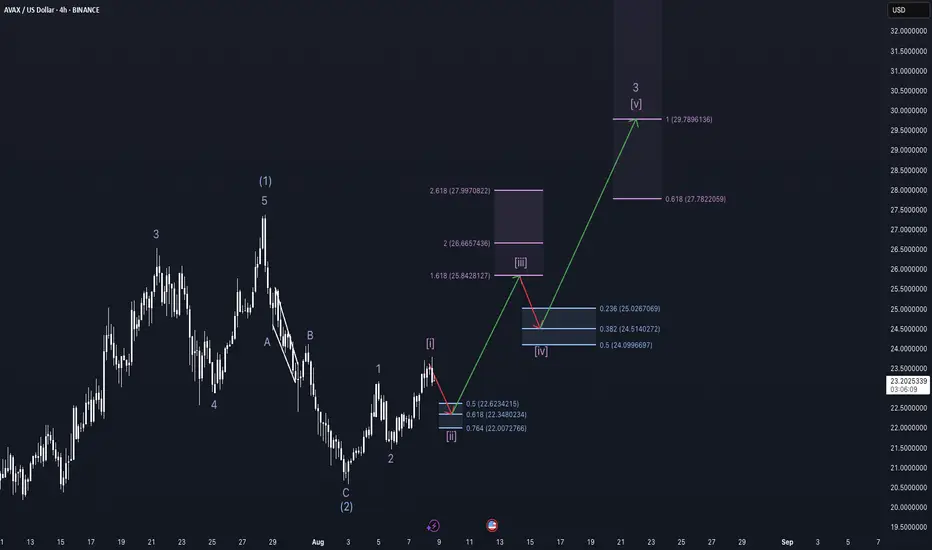
back to $30 - AVAX weekly update August 8 - 14thAvalanche (AVAX) is currently unfolding a highly impulsive Elliott Wave structure across multiple timeframes. According to the updated wave count, the market is in the early stages of Primary Wave 3, which contains Intermediate Wave 3, Minor Wave 3, and we are now completing Minute Wave , a shallow pullback expected to bottom between $22.00–$22.62 (0.618–0.764 retracement zone).
Once Wave is complete, AVAX is expected to launch into Wave , with Fibonacci extensions pointing toward the $25.8–$28.0 region. This would be followed by a brief Wave correction and a final push into Wave of 3, with projected targets around $29.8–$33.0. The fact that all these third waves across different degrees align at the same time sets the stage for a powerful and potentially explosive rally.
From a sentiment and positioning standpoint, the environment supports this bullish scenario. Funding rates are positive, and open interest is rising, indicating growing market participation on the long side. However, the liquidity heatmap still shows significant liquidity resting below current price, which opens the door for a brief liquidity sweep — especially if retail traders become overly aggressive during early stages of the move.
This setup also aligns with macroeconomic expectations. The market is increasingly front-running a potential rate cut at the upcoming September FOMC meeting, with the CME FedWatch Tool currently pricing in a 89.4% probability. This is injecting optimism into risk markets — including crypto — and may explain the emerging wave of retail positioning.
That said, if leverage builds up too fast, a classic "sell-the-news" scenario or long liquidation event could briefly disrupt the trend. But structurally, AVAX appears to be well-positioned, especially as institutional footprints in the form of order blocks near Wave (2) lows suggest smart money already entered — with retail now providing the momentum fuel.
As long as the current support zone holds, AVAX could be on track for a multi-leg breakout that extends well into the $30+ region — driven by technical structure, liquidity positioning, and macroeconomic catalysts converging at once.
AVAXUSD trade ideas
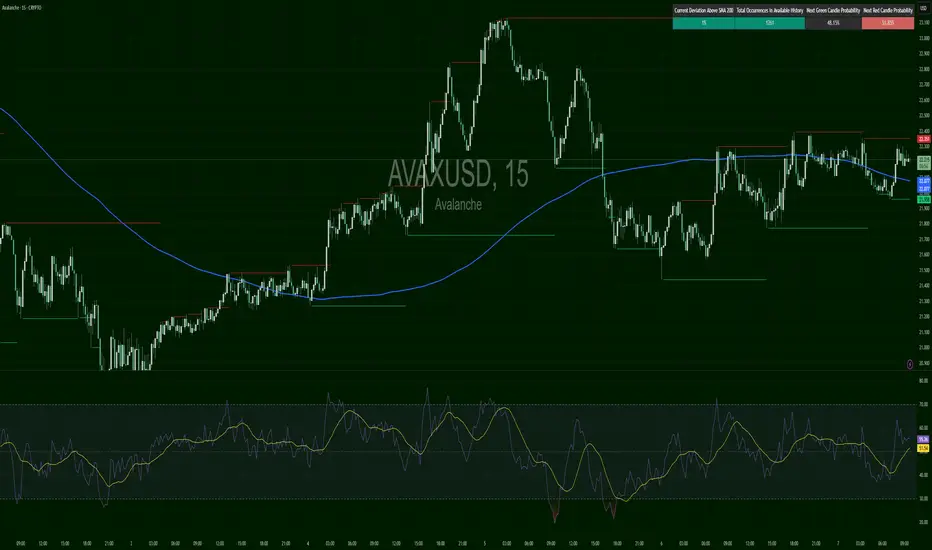
AVAX/USD – Coiled at the BarrierAvalanche made an attempt above the 200 SMA near $22.10, but failed to punch through the key $22.35–$22.40 resistance. Price is now coiling beneath resistance, with RSI drifting just above 50, suggesting indecision. Until bulls crack that level and hold above, it’s a stall zone with fakeouts likely.
🔴 SHORT bias below $22.35 — this area is acting as a supply ceiling.
🟢 Flip $22.40+, and buyers may accelerate toward $22.80.
📊 Keywords: #AVAXUSD #RangeTest #RSINeutral #SMAClash #BreakoutTrap #BearFade #LiquidityZone
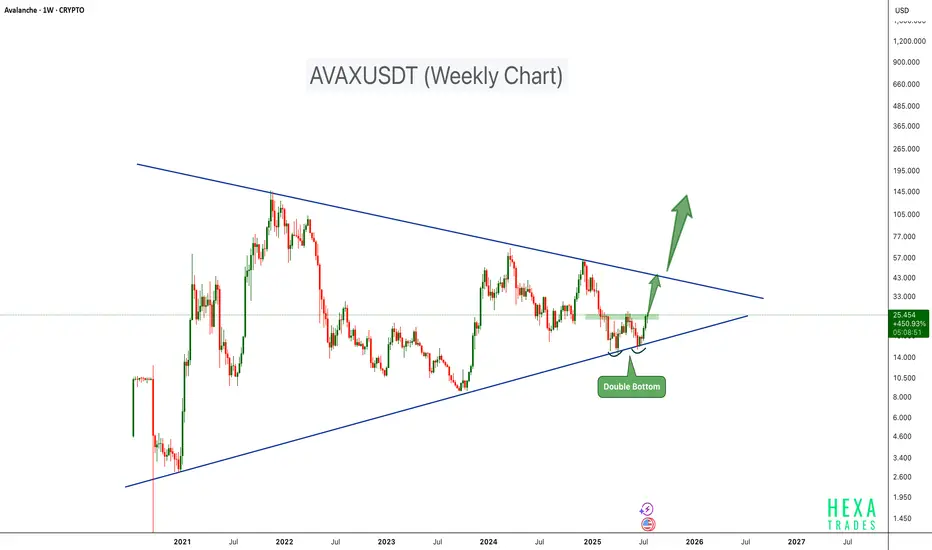
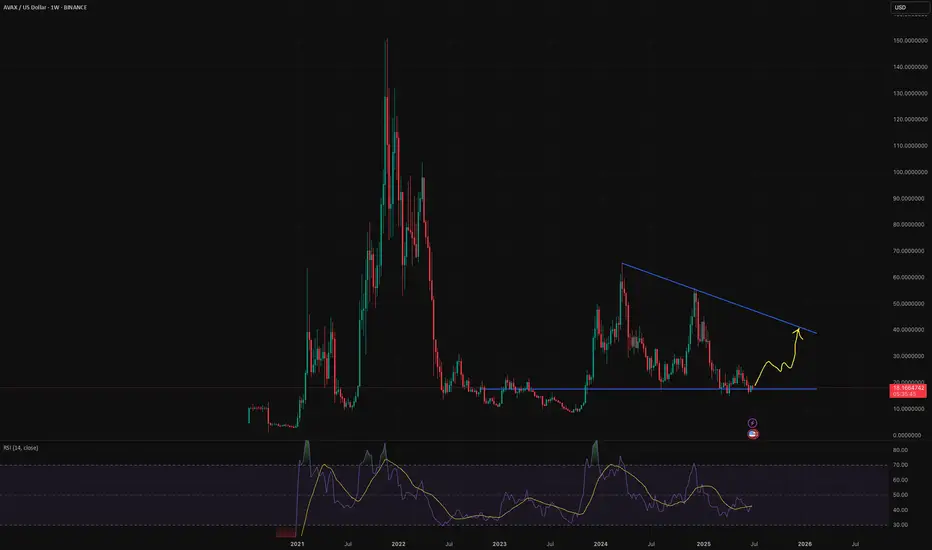
AVAX Bull Run Loading!AVAX is showing signs of a strong bullish setup on the weekly chart, forming a double bottom pattern right at the lower support trendline of a long-term symmetrical triangle. This technical formation often indicates a potential trend reversal when confirmed with breakout and volume support.
Key Points:
-Double Bottom Support around $12–$14 with bullish momentum.
-Symmetrical Triangle structure compressing price for breakout.
-Breakout Zone near $27, a close above this level may trigger strong upside.
-Upside Target: Short-term Target- $45; Long Term Target - $125
Invalidation: A Break below $15 support could negate the setup.
Cheers
Hexa
CRYPTOCAP:AVAX BINANCE:AVAXUSDT
AVAX | USDHello!
This is my outlook for AVAX.
Weekly or monthly candle closures above the red price levels could lead us to higher levels.
I hope it can reach the $109 level by the end of the year.
I expect the market to enter a deep correction phase starting from the $54–58 range and ending around the $28–32 levels.
I believe this correction phase might occur around September or October.

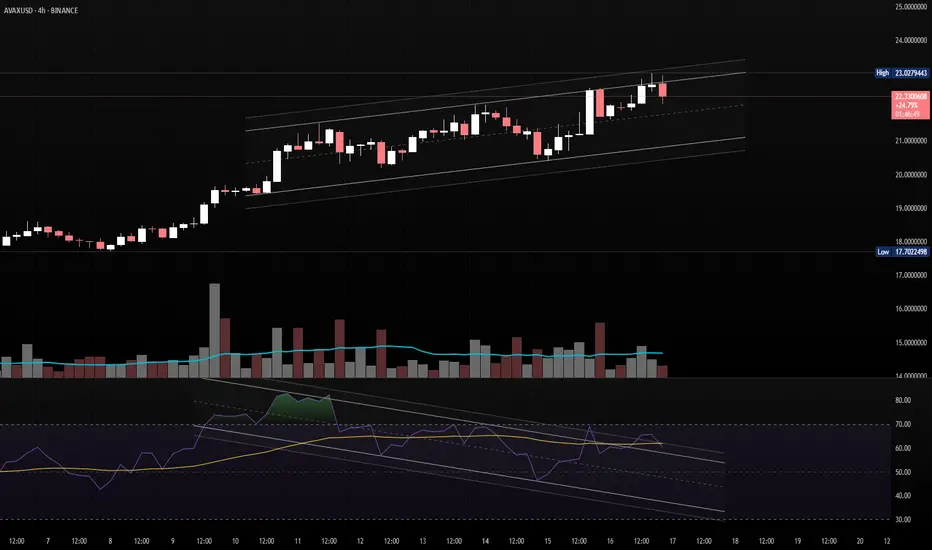
AVAXUSD - Possible Correction from Channel ResistanceStructure: Ascending Channel
Indicators: RSI Overbought, Bearish Divergence Forming
📌 Confirmation:
Look for:
A strong bearish candle or
RSI breaking below 60
Volume divergence
Bias: Short-term bearish correction, bullish structure intact as long as price holds the channel.
An 8.8:1 risk-to-reward trade setup for AVAX.A small pullback is likely at this point. This setup offers an 8.8:1 risk-to-reward ratio with a target of 50.
Entry at 20.8,
Stop loss at 17.50
Target at 50.

AVAX Just Broke Out — Now Comes the Real TestAvalanche ripped through key resistance around $20.50, tapping into fresh highs before pulling back. Price is now hovering just above the breakout zone, which has now flipped into potential support. This is the classic retest scenario — either bulls hold the line and reload for a move toward $25–$27, or we fall back into the range.
Stoch RSI is mid-range, giving room for either direction. But the structure is clean: breakout → retest → decision. If $20 holds, it’s game on. If it fails, look toward $18.00 again.
The chart’s telling a story — now we see how it ends.

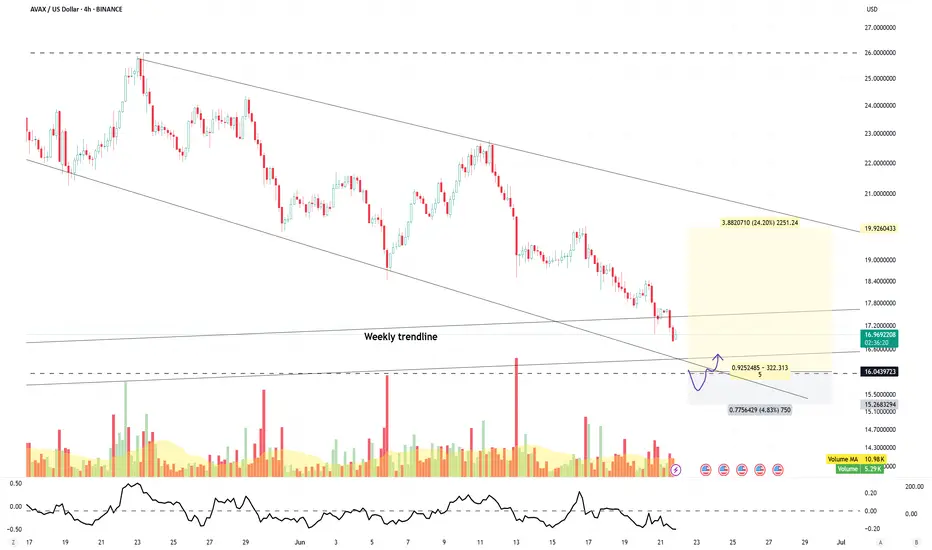
AVAX wait for entryAVAX has been consolidating within the $15–$26 range for the past four months.
Price is currently revisiting the range lows, which also align with the weekly trendline—creating a strong confluence zone.
A bounce is anticipated from this area.
Wait for a confirmed long setup as outlined in the chart.
Disclaimer:
This analysis is based on my personnal views and is not a financial advice. Risk is under your control.
AVAXUSD – Explosive Start, Flag in PlayAVAX rallied from $18.20 into $19.65 in a straight-line surge, clearing prior lower highs. Now coiling just under $19.70, which is a key resistance. A breakout targets $20+. Immediate support is $19.30 — below that risks deeper pullback.


$AVAX will go to at least $40 this year-Almost oversold
-Positive RSI divergence
-at significant multi-year support
-retail sentiment: dead
-undervalued relative to Bitcoin
-in a continued crypto bull market (which I expect in 2025), AVAX will rise too, my first PT is $40 (hitting the descending resistance) with the potential to go much higher
AVAXUSD – Rally Fizzled, Eyes LowerAVAX broke out impulsively to $18.60 but failed to sustain above $18.00 and quickly unwound. Price has now rounded off into a lower range near $17.30. A small recovery bounce is underway, but it lacks strong volume. The key level is $17.75 — reclaim that, and we could see a move back to $18.00. Until then, rallies are likely to be faded.

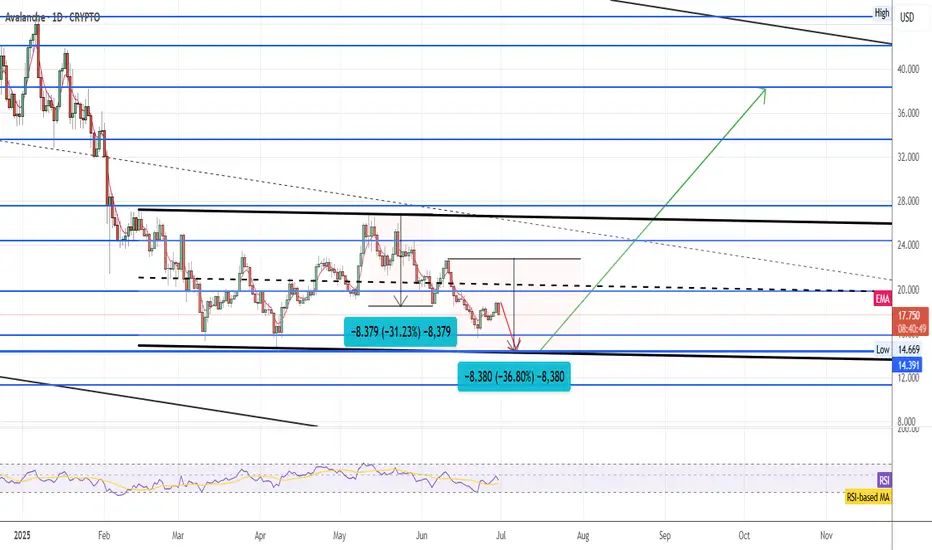
Avalanche UpdateAvalanche could be still bearish: in case of BTC to retracement 95k area Avalanche could retrace to 14,39$ area then a bullish move could start to target 38$ in october.
Watch the break on the 4 hour for AVAXThe AVAX 4 hour shows RSI is still coming down, but there is a chance it will revert prior to coming down for another double bottom or retest. Waiting for a confirmation by breaking the down trend would be good, but a break of the downtrend followed by a retest would be better for entry. If you want to be more aggressive and you do have confidence that AVAX will break the trend, you could place an entry below the current price for a 3 to 1 or 4 to 1 risk reward ratio.
This is simple analysis based on trends, simple support and resistance leves, confirming with RSI and MACD.

AVAXUSD – From Grind Down to Lift OffAvalanche finally snapped out of its tight chop after breaking through $16.20 resistance. Price had been grinding lower for hours until a sudden pivot created a V-shape recovery, pushing through lower highs and flipping intraday structure bullish. AVAX is now testing the $16.85–$17 zone – a minor supply area. If bulls hold $16.40 on the next dip, expect continuation toward $17.20+.

AVAX - Any Daily Chart Opinions?📉 Trend Overview
- AVAX has been in a clear downtrend since mid-May,
- steadily declining from ~$27 to the current ~$18.
- Multiple lower highs and lower lows are evident, confirming bearish market structure.
🔍 Price Action
- Price is currently testing a key support zone around $17.50–$18,
- near previous consolidation zones (seen in April and February).
- Candle body sizes are shrinking, indicating momentum loss from sellers.
📊 Volume
- Volume is declining slightly, even during the downtrend, which may suggest selling exhaustion.
- No major bullish spike yet — so no confirmation of accumulation.
🧮 WaveTrend Oscillator (WT_CROSS)
WT Oscillator is:
- In deep oversold territory (below -50).
- Close to printing a green dot or crossing up, signaling a potential bullish reversal.
- The crossover isn’t completed yet — but worth watching in the next few days.
⚠️ Key Levels
- Immediate Support: ~$17.80 to $14.60 (historic demand zone).
- Resistance to Watch: ~$20.50 (first test zone), then ~$22.60.
✅ Bullish Signs
- Oversold oscillator with near crossover = possible bounce setup.
- Strong historical support zone — price may stabilize here if buyers step in.
- Heikin Ashi candles showing small-bodied red candles = possible trend weakening.
🚨 Bearish Risks
- No bullish divergence or confirmation yet — WT signal not fully formed.
- If support around ~$17.50 fails, next stop could be $14.50–$15.00 area.
- Still in macro downtrend — any bounce could just be a lower high retracement.
📌 Conclusion
AVAX is showing early signs of bottoming out, but not confirmed yet.
If you're a short-term trader, watch for:
- WT bullish crossover
- Bullish candle confirmation (e.g. engulfing or hammer)
- Volume spike on green days
For investors: cautiously accumulate only if price respects this support and macro sentiment improves.
--
Disclosures:
This analysis is for informational purposes only and is not financial advice. It does not constitute a recommendation to buy, sell, or trade any securities, cryptocurrencies, or stocks. Trading involves significant risk, and you should consult with a qualified financial advisor before making any investment decisions. Past performance is not indicative of future results.

AVAXUSD – Grinding Down, Rebound DeniedAvalanche has continued its downward trajectory, posting consistent lower highs and lower lows. After a brief attempt to recover during the late session of June 17, price failed to hold above $18.80 and resumed the bearish grind. The decline is steady rather than sharp, indicating controlled selling pressure rather than panic. If $18.30 fails to hold, watch for retests near $18 or even lower. For bulls, a clear reclaim above $18.75 is needed to invalidate this short-term downtrend.

Avalanche big falling wedgeAvalanche is moving in a long term falling wedge, a possible scenario is a big drop to (4.2$ , 5$) area to test wedge lower trendline and then a big rise , my final tp is 90$

Avalanche Slides into Bearish Drift After Double TopAvalanche (AVAX) initially rallied strongly but formed a double top near $22.80 before entering a persistent downtrend. The pair is now trending below $21.10 with lower highs and lower lows, suggesting weakening momentum and a bearish breakout risk.

REVISED AVAXUSD UPSIDE PATTERN POTENTIAL Hey people,
After re-looking at #AVAXUSD and with some more market information this seems like the most likely playout for the crypto. watch to break the low and then begin its climb upwards

AVAX: Low in Sight?AVAX continued its expected decline into the magenta Target Zone between $24.42 and $13.31, before reversing course over the weekend with a modest bounce. While it's possible that this marked the low of the wave ii correction, we're not ruling out the potential for another dip within the zone. For now, the setup remains open-ended. Once orange wave ii has been confirmed as complete, we expect a strong rally to follow in wave iii, likely driving the price beyond resistance at $49.95.
📈 Over 190 precise analyses, clear entry points, and defined Target Zones - that's what we do.

Log scale fibonacci levels for Avalanche (AVAX)fibonacci levels on log scale describe levels of confluence indicating market tops and bottoms, as well as other market price characteristics (support/resistance levels)

Long Trade Analysis – AVAX/USD (30M Chart)!📈
✅ Setup Overview
Chart: Avalanche (AVAX) / USD, 30-minute timeframe (Coinbase)
Pattern: Descending trendline breakout
Trade Type: Long (Buy)
📌 Key Levels
Entry: ~$20.77 (at trendline breakout + above yellow zone)
Stop Loss: ~$20.34 (recent low/support zone)
Target 1: ~$21.23 (first resistance zone)
Target 2: ~$21.91 (major green resistance)
📊 Trade Justification
Trendline breakout confirmed with candle close above resistance
Bounce from a strong support zone at ~$20.34
High reward-to-risk ratio (2:1+), targeting resistance levels
📢 Suggested Caption for Sharing:
✅ AVAX/USD Long Setup (30M)
Trendline breakout with strong support holding!
🔹 Entry: 20.77 | SL: 20.34 | TP1: 21.23 | TP2: 21.91
Let’s ride the momentum!
#AVAX #CryptoTrading #LongSetup #Breakout #TradingView
