AVAXUSD trade ideas

avalanche 2022heres my avalanche chart for the next couple of hours---possibly 10-16 hours---going to leave it an see how things play out..

Head and shoulders on AVAX. Retest $21/22 then $13/14? LowerNot a lot of reason for AVAX to go anywhere else right now.
RSI on the daily still above 30.
Stops at $23.75


AVAX USD SELLIf the price cannot cross the specified resistance, we can enter the short position after the pullback
This is a prediction, please check for yourself

AVAX Short- 4hr death cross
- Inverted Cup and Handy
- Head and Shoulders forming in the cup
- 4 Hr Bearish Divergence
- 4 Hr and 1 Hr Stochs are Overbought
- 15 Min needs to reset and BTC Dump

AVAXUSD (4H) Bearish breakoutHi Traders
AVAXUSD (4H Timeframe)
The market is in a downtrend and we are waiting for an entry signal to go SHORT below the 21.30 support level. Only the upward break of 23.55 would cancel the bearish scenario.
Trade details
Entry: 21.30
Stop loss: 23.55
Take profit 1: 19.95
Take profit 2: 17.72
Score: 5
Strategy: Bearish breakout

avax scalp long | tp $26closed all shorts this morning. will look to reopen post bounce.
going to be away from my desk all day, so this is the only chart i'll be posting. I like avax for the bounce here.
strong bounce off eth pair support and held overnight vs usd while everything else dumped.
if we get even the slightest bit of recovery here, avax should be high beta.

AVAX, local double bottom support.The following content is machine translation:
In the 4-hour chart, yesterday the white market stopped falling and rebounded, and the night plate dived back to the front support, forming a local double-bottom rebound.
The indicator macd and the RSI indicator rebounded.
Summary: Double-bottom rebound plus indicators rise in the bearish range, rebound is treated, short-term bullish, fall below the double-bottom support bearish.

short it all to zero | $avax to $22exited all longs with this pump. was mainly in eth as wee moved avax long profits to eth a few days ago.
don't think avax takes out the high. was the final momentum pump we were looking for.
next two weeks or so expecting all downside action.
just about everything should be a safe short from here.

Avalanche: The Very Hungry Caterpillar 🐛You know the children’s book The Very Hungry Caterpillar by Eric Carle? Just like the story’s protagonist, Avalanche is crawling around with wriggly movements and is repeatedly gnawing at the turquoise zone between $25.29 and $39.63. If the altcoin wants to further our primary scenario, though, it should pupate soon and emerge as a beautiful butterfly, flapping away above the resistance at $103.64. However, there is also a chance that Avalanche could lose its footing and drop below the resistance at $9.25, which would then elicit a strong downwards spiral.


AVAXjust beautiful! I wonder how high the market is going to move this week, this will be my first bull run ever! I'm blessed to be here!

AVAX TREND UNDER THREAT?AVAX 1D: Bearish flag brewing as illustrated between the white regression lines. Also note the declining volume against rising price as shown along the bottom of the chart. Strong price architecture is built on a solid volume foundation. That foundation looks to be waning.
A downside breach of the 24.17 level, which is (-2 ) standard deviations off the linear mean, would potentially put the recent upward trend under threat.
The RSI has touched the overbought level at the top end of its range on the 1 day time frame and begun trending downward. Trips over 70 on larger timeframes such as the 1 day chart are significant indications of a rally potentially coming to its end. Stay nimble out there.

Buy AVAX now for a 26% gain!Currently, Avalanche can process an incredible 4,500 transactions per second, while Ethereum can only process between 15 and 30 per second. This vast difference highlights Avalanche as the superior platform in terms of scalability and transaction periods.

AVAX/USDT UPDATE SORRYW Formation available.
I've seen it as a double peak before but I was wrong
Insights shown here are for follow-up purposes only.
Not Acceptable as ANY Investment Advice


$avax target remains $28-30should have stuck with this game plan as avax bounce right at our w4 completion zone.
still targeting $28-30 minimum.
only area i'm concerned about is the ? white box. rejection there would signal another wave down and likely the end of this bull run.
until then, long your longs.
avax vs eth for additional context. think avax outperforms again:

$avax longplaying this level by level. currently holding above wave 1, which is what we'd like to see for a wave 4, with wave 5 coming up.
marked this green box last week as potential support.
looks to be holding.
wave 5 should put us around $28.

AVAXUSD breakout, could this be the start of a new move higher?Hi, welcome to Monday's update. Today's focus is on AVAXUSD after last weekend's solid two days of buying that broke above resistance
Are we seeing a new higher extension on AVAXUSD? That is the question we're asking in today's video update. Weekend trade has set up the first sign with a break above 25.30 resistance. What we would like to see now is for the move to continue higher and test the next resistance levels seen at 27.50, 31 and 36.
In a perfect world, we would see price continue to push higher a bit more before we see a new pullback. We are looking for the pullback to find support at the previous breakout point and turn the previous resistance level into new support.
A new HL created around the previous level of resistance followed up by a new HH would be a good sign and could signal a buy into the new move. From that point, we would like to see buyers break 31 and 36 resistance to signal that a new short-medium-term trend higher is underway.
A new lower move closing below 25 would be a worry and could tell us that buyer momentum might not be as strong as thought.
Good trading, and enjoy the rest of your Monday.

Avalanche teasing an inverse head and shoulder breakoutWaiting to see where the current candle closes. Seeing priceaction flip the 1day 50ma (in orange) to support would make me more confident of the breakout. If breakout confirms target should be around $28.

Potential Forecast...As with the overall view that markets are potentially in a large bull trap I think it's possible we see something like this unfold.
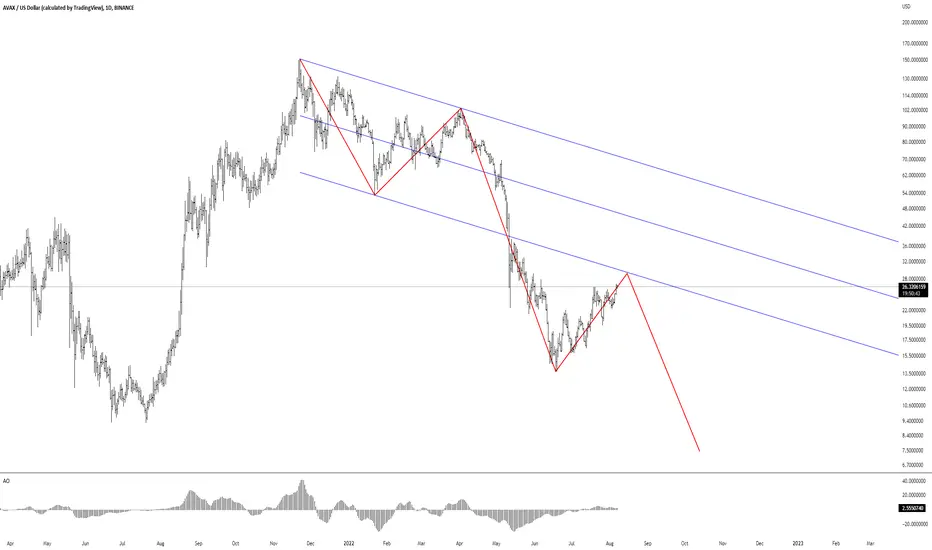
AVAXVery simple ... Very clear
Another downtrend has begun.
This is my personal opinion. Please do not trade based on my analysis and data.
