AVAXUSD trade ideas

AVAX/USDTInsights shown here are for follow-up purposes only.
Not Acceptable as ANY Investment Advice

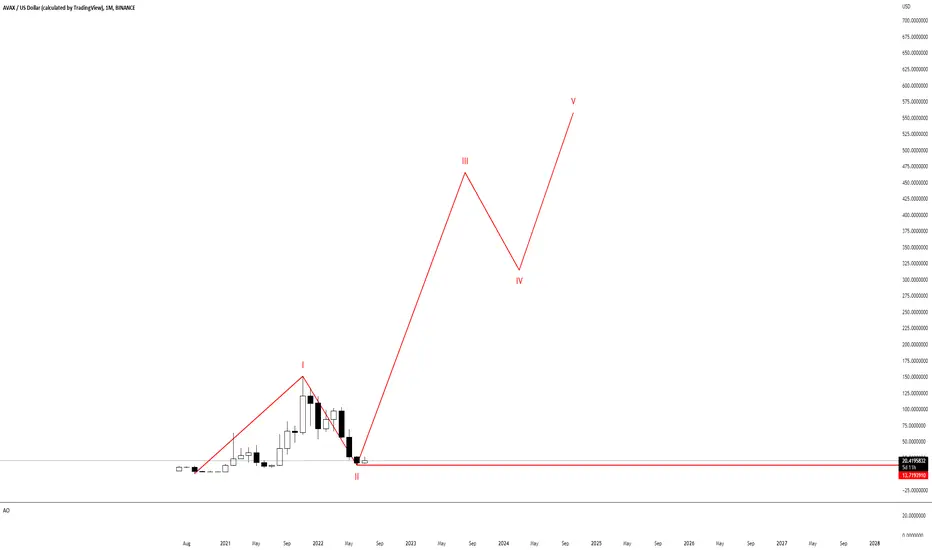
AVAX FIB PREDICTIONSUsing fib channels to chart Avax. Also included most likely bottom predictions and top of next cycle predictions. Created the fib channels around 6/15/2022.

AVAXUSDDouble Top Reversal Pattern Reversal along with Fib. Harmonic Bearish and Support Resistance.

$avax | long | target $28-30like bitcoin, no real divs to work with. but retesting rsi eq on the daily. don't think we've hit the real swing top.
retraced to standard wave 4 zone.

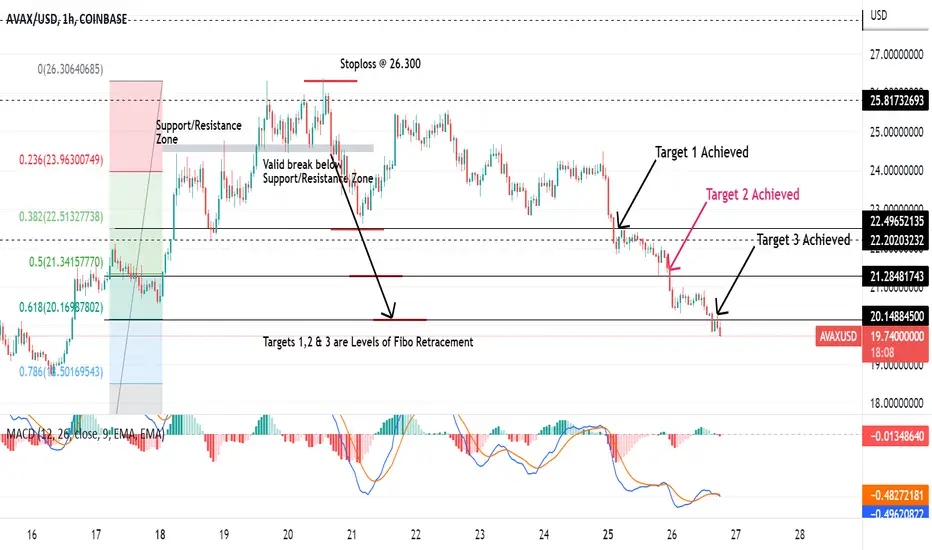
26-07-2022 _ Update Short Term Bearish Idea _ AVAXUSDT H1That’s the 3rd follow-up on Short Term Bearish Idea _ AVAXUSDT H1 originally shared on 20-07-2022 with 1st and 2nd follow-ups on 25-7-2022 and 26-07-2022 respectively.
Target 1 ….. Achieved on 25-07-2022
Target 2 ….. Achieved on 26-07-2022
Target 3 ….. Achieved on 26-07-2022
Potential Last Buy Op.Many are still very fearful of the macro outlook on markets and it's well warranted - however if our lows hold we may see some moves in the future that really shock people.
AVAXUSDAVAXUSD is at a resistance level. A sell trade is taken with confirmation with two level of TP.

26-07-2022 _ Update Short Term Bearish Idea _ AVAXUSDT H1That’s the 2nd follow-up on Short Term Bearish Idea _ AVAXUSDT H1 originally shared on 20-07-2022 with 1st follow-up on 25-07-2022.
Target 1 ….. Achieved on 25-07-2022
Target 2 ….. Achieved on 26-07-2022
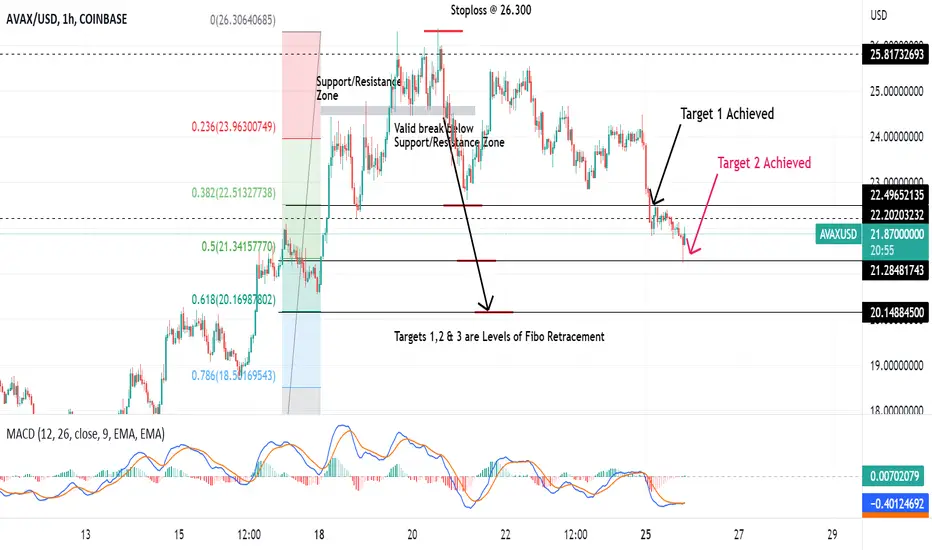
25-07-2022 _ Update Short Term Bearish Idea _ AVAXUSDT H1That’s a follow-up on Short Term Bearish Idea _ AVAXUSDT H1 originally shared on 20-07-2022.
Target 1 ….. Achieved on 25-07-2022

$avax | twenty american greenbacksranged under the high and ultimately rejecting. expecting a slightly extended wC to bring us down to $20, where we're looking for w5.

$avax still short. currently failing our retest zone similar to eth. btc didn't even make it up to it's retest zone, which makes me think this could bleed a little further than wave a did in comparison.
invalidation above the high. still want $20.

$avax thank you this opportunitythank you for this opportunity to add to our avax short at this resistance. ecb rate hike lol like anyone cares about the euro.
nuke this back down to $20 with haste.

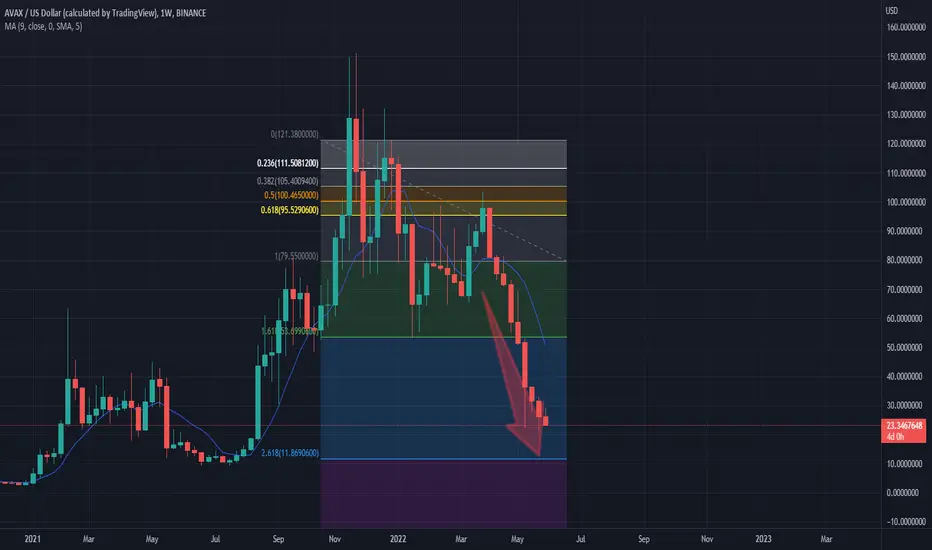
AVAX, support near 22.The following content is machine translation:
In the 4-hour chart, it is currently near the 22 support, 22 is the support in May, the rebound in June turned into resistance, and it broke through in July, and it has now fallen back to the vicinity of the 22 support.
The indicator macd is a callback trend, the speed line is still above the zero axis, and there is a possibility of a rebound. The RSI indicator topped off near the overbought zone and returned to the neutral 50.
To sum up, the current 4-hour chart has begun to rebound, and the short-term is bullish. If it falls below 22, it will see around 16.

avax short to $20similar idea to the eth short. wave 3 looks complete, with valid bear divs on rsi.
looking for ~20% pull back to $20 or so before a big push up to $28-30.

20-07-2022 _ Short Term Bearish Idea _ AVAXUSDT H11- Bearish Divergence.
2- Valid break below the Support/Resistance Zone awaited.
If happened, targets are 38.2, 50 and 61.8% of the Fibo. Retracement.
Protection @ 26.300

AVAXUSD ❕ bearish divergenceAVAX is under a strong zone with high liquidity.
Price and RSI have formed a bearish divergence on the 4H Timeframe.
The asset is in an overbought zone on the BB indicator (4H TF)
TD Sequential has formed a reversal signal down (1H TF)
Price moved out of the overbought zone RSI (1H TF)
I expect the continuation of the correction after fixing under the support level.

AVAX Rejected by 200MA We are getting rejected at 200MA. If the buying pressure continues we might confirm above it and tag the 200EMA line (the thinner line).


$avax shortposted this on twitter probably about an hour ago. been building an red coin short since last night and into this morning.
likely going to get a retest. will add more there.
could drop further than marked, but will take some off the short around that zone.


AVAXUSD Re-testing the 1D MA50. Breakout and rejection scenariosAvalanche (AVAXUSD) is recovering from the recent rejection on the 1D MA50 (blue trend-line) last week. That would be the third attempt that close to the MA50 in 3 weeks and with the 1D LMACD on a strong rise, it appears it could be the decisive one to break it.
In fact the same LMACD sequence was last spotted in July 2021, a year ago, when the price eventually broke above the 1D MA50 and initiated an extremely strong rally. Now with the general crypto market attempting to find a bottom on this Bear Cycle, such a rally would be difficult to re-create yet but the Fibonacci retracement levels within this long-term Channel Up can help us set some short/ medium-term targets leading eventually to the 1D MA200 (orange trend-line).
On the downside, if the price gets rejected again and breaks below the Higher Lows trend-line (Fib 0.0), it can go for a Bearish extreme near the -0.236 Fib, similar to the Bullish extreme at 1.236 Fib that shaped the top of the market on November 22 2021.
--------------------------------------------------------------------------------------------------------
** Please support this idea with your likes and comments, it is the best way to keep it relevant and support me. **
--------------------------------------------------------------------------------------------------------
