Still Accumulating These are the times fortunes are made and yes there can always be more downside - however to people with a longer time horizon accumulating in this current climate is a great opportunity - I have been buying all the way down and I'm having flashbacks to 2018 when ETH was in the $100~ area and nobody wanted to buy it, Fast forward years ahead and look how that played out. I believe alt layer ones are extremely under valued and will follow similar paths to what ETH has done specifically Solana and Avalanche.
AVAXUSD trade ideas

AVAXUSD (4H) Bearish BreakoutHi Traders
AVAXUSD (4H Timeframe)
The market is in a downtrend and we are waiting for an entry signal to go SHORT below the 21.3 support level. Only the upward break of 29.1 would cancel the bearish scenario.
Trade details
Entry: 21.30
Stop loss: 29.10
Take profit 1: 16.40
Take profit 2: 11.40
Score: 7
Strategy: Bearish Breakout

AVAX 4H Long ideaPlease see chart - 4 hour bullish order block identified. Wait for retest and then long. This is a slightly risky trade given the general bearish market but a number of higher highs and higher lows have formed and this trade has good risk to reward.

Break OF Previous Resistance and Back Test on AVAXAvax had finally broken its downsloping resistance line and followed through with a back test which could lead to the next area of interest being $28.50 as long as $25.25 holds as support.


AVAX LongA long entry based on a 1H bullish order block. I marked out the bullish 1H order block and when price returned near it, I drilled into the 5M chart. Price was ranging but then formed an impulse higher high. I identified the bullish 5M order block from which this move originated. I waited for a retest and entered when price hit the top range of the 5M orderblock.
My stop loss was just below the 1H order block.
My take profit was just under a potential 1H bearish order block.

AVAX JUST BUMPED THE LINEAR REGRESSION MIDPOINTLooks like a rejection of the trend.... looks like a head and shoulders forming.... maybe the next dip??

AVAX Hit Bottom!I ran this trade last night with my vip room. still running and AVAX is looking good on the daily as well. moved the stop to the green dotted line.

AVAXUSD ❕ downward channelGenerally MAs on 30m Timeframe - Bearish sentiment.
AVAX is moving in downward channel.
I expect that the price will retest an upper boundary of the current downward channel and reach a lower boundary after fixing in channel.

AVAX LONGAvax Bounced of the 21$ resistance.
Expecting a retest of the Support. If we stay above it after the retest and break above the downtrend line,will be a good buy signal.
MACD is in positive momentum and RSI looks positive too and close to oversold.
Our First Target will be below the Major resistance of 51$ and the Second at 38.2% FIB retracement near 70$.

AvalancheAvalanche has a chance to recover!
The steady demand for the Avalanche coin allowed a short-term trend to form and come close to the resistance level of $30 per coin. $30 resistance is a key area for continued growth, where a lot of pent-up investor demand can be concentrated, which will increase momentum. Steady growing demand from the $30 support level is able to form a medium-term trend with the aim of testing the $40 levels and the subsequent $60 levels, which is the key level and the point of intersection of the trend line of the long-term descending channel within which the coin is located after updating its high level of $145 per coin.

AVAX 1H BUYAVAX 1H support is at ~$26
Enter 50% at the current price
and try to set some buy orders near the support zone
If AVAX holds above the trendline,
the Take-Profit target would be 5%, 10%, and 15% from your entry
Cheers

Avalanche - Short Term Swing Trading Idea - 29 May 2022FTX:AVAXUSD for a few days dropped over 35% and on bigger time frames start forming good price action upwards. In the next 3-4 days I expect gains of over 30% and hit a strong resistance level of over $31 per coin.
What is the supported thesis technically for the expected scenario on Avalanche?
- Price-action will be a strong signal in the next couple of hours
- By Elliot waves - there are 5 waves impulse and expecting classic A-B-C correction
- The RSI indicator will hit a bit lower before curving up
If you have any questions related to this trading idea I will be happy to provide you with answers. FTX:AVAXUSD

AVAX, the rebound is relatively smooth.The following are machine translations:
On the daily chart, it fell to around 22.3 on May 12, stopped falling and rebounded, and then fell in shock. After falling below the short-term rising trend line, it accelerated and fell back to the previous low. It fell to around 22.5, stopped falling and rebounded. Yesterday’s rebound was positive and negative. Continue to rebound today, which is currently in a stable state, and it is expected that the short-term rebound will continue in the future.
The indicator macd is the bottom background state, the energy column is running above the zero axis, and the bearish power is gradually weakening. The RSI indicator rebounded below the oversold area of 30, which is also a bottom divergence state, and began to turn upward and rushed above 30, showing a short-term bullish trend.
In operation, if there is a step back, you can look for a low point and do more, and the maximum drop is below the 20 stop loss, and the short-term target is near 30.
AVAX BUY POSITION GOOD R:R Risk:Reward Are worth to buy it
Go long and pray for LFG not sell their AVAX !

AVAX MANAGINGING TRIPLE TAP Details are mentioned in the chart . ENTER AT YELLOW LINE , STOP AT RED LINE , BAG UNLOADING AT GREEN LINES ESPECIALLY AT H1 SUPPLY .

AVAXUSD D2: 350% gains THE BEST LEVEL TO BUY/HOLD(SL/TP)(NEW)Why get subbed to me on Tradingview?
-TOP author on TradingView
-2000+ ideas published
-15+ years experience in markets
-Professional chart break downs
-Supply/Demand Zones
-TD9 counts / combo review
-Key S/R levels
-No junk on my charts
-Frequent updates
-Covering FX/crypto/US stocks
-before/after analysis
-24/7 uptime so constant updates
🎁Please hit the like button and
🎁Leave a comment to support our team!
AVAXUSD D2: 350% gains THE BEST LEVEL TO BUY/HOLD(SL/TP)(NEW)
IMPORTANT NOTE: speculative setup. do your own
due dill. use STOP LOSS. don't overleverage.
🔸 Summary and potential trade setup
::: AVAXUSD D2/candle chart review
::: HIGHER RISK SETUP USE TIGHT STOP LOSS
::: further losses short-term
::: expect BEARS to target 10/11 USD
::: however strong bounce after correction
::: setup still valid as of today
::: chart is LOG SCALE
::: get ready to BUY LOW later near 10/11USD
::: BUY LOW near 10/11 USD using tight SL
::: currently correction in progress / no upside
::: dump until after FED (16th June)
::: for now stay out / wait for better entry price
::: up to 350% gains possible later
::: short-term pullback/correction
::: is possible / likely
::: however chart looks good for BOUNCE
::: SPECULATIVE SETUP
::: do your own due dill
::: and use proper risk management
::: TP bulls is +350% gains
::: details: see chart
::: FINAL TP is +350%
::: recommended strategy: BUY/HOLD 10/11 USD
::: TP BULLS +350% gains final exit 45 USD
::: SWING TRADE: BUY/HOLD IT
::: bull run not over yet
::: good luck traders!
::: BUY/HOLD and get paid. period.
🔸 Supply/Demand Zones
::: N/A
::: N/A
🔸 Other noteworthy technicals/fundies
::: TD9 /Combo update: N/A
::: Sentiment mid-term: BULLS/STRONG BOUNCE
::: Sentiment short-term: CORRECTION/10USD
RISK DISCLAIMER:
Trading Crypto, Futures , Forex, CFDs and Stocks involves a risk of loss.
Please consider carefully if such trading is appropriate for you.
Past performance is not indicative of future results.
Always limit your leverage and use tight stop loss.

The Future Looks Great...Been buying all the way down like a boss because it's obvious what is coming - Be greedy, A Lao Tzu quote once said ''new beginnings are often disguised as painful endings'' - Fortune favours the bold.

Avalanche (AVAX) at critical volume lackAvalanche (AVAX) at critical volume lack... despite the buy signal on MACD AVAX should turn around soon not to get into this lack of volume.
A bullish divergence on RSI and a confirmed break above $29 is what every fan of this Crypto wants to see.
What do you think?
Drop me a nice comment if you'd like me to analyze any other cryptocurrency.
*not financial advice
do your own research before investing

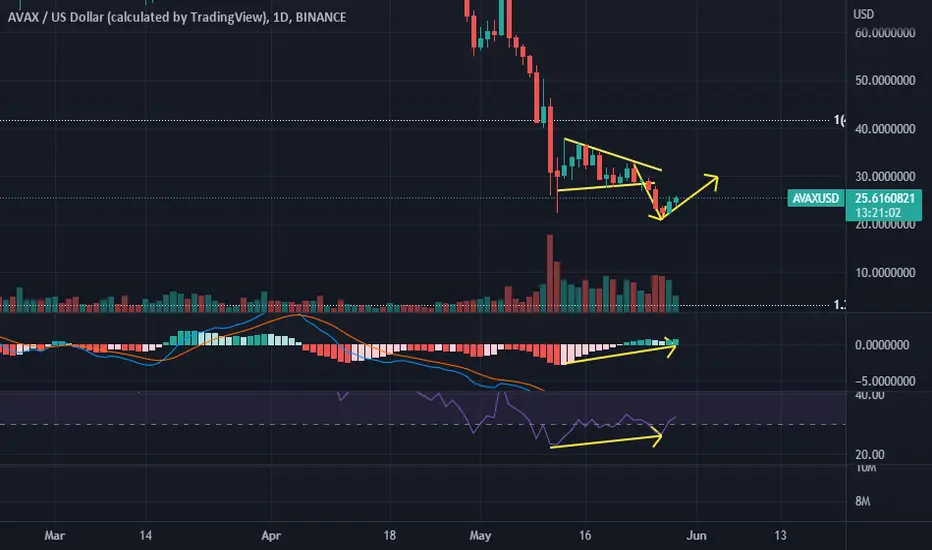
AVAXUSD, are sellers planning a new bear raid?Hello TradingView community, today we’re looking at AVAXUSD as price remains in a solid-looking downtrend. We are watching a consolidation pattern that could be a descending triangle or a wedge type pattern in the existing trend.
The key for us is at 28 support. If sellers break this level, the continuation could be on, and we would like to see a new LL set to show normal pattern of trend. If buyers can continue to hold 28 and above, this could be a worry for short term seller momentum that was set with a break of yesterday’s low this morning.
This pattern is also seen on SOLUSD, and other coins in the top 10 remain range-bound.
It’s really up to sellers now if they want to take this trend lower.
Good trading

AVAX/USDT about to breakoutGood morning,
Today we came across AVAX/USDT. We see that this coin is about to breakout as it is pulling itself upwards. We think that it is going to break the zone at $32.2 and once it breaks it should go as hight as $37-42. We would wait for the confirmation which we would get once the price reaches area $33.5.
If you like ideas provided by our team you can show us your support by liking and commenting.
Yours Sincerely,
Swallow Team
Disclamer:
We are not financial advisors. The content that we share on this website are for educational purposes and are our own personal opinions.

AVAXUSD ❕ volume declineAVAX is at the upper border of the channel.
Trading volumes are declining.
Volatility has declined.
I expect that after the retest of the channel boundary and fixation under it the price will reach the lower boundary of the channel.

19mshort scalp // half riding for maco ltf pivot which imo is bottom of range // aggressive shorts punished - no free lunch
