AVAX 6% gain targetLast night's level was hit today as expected.
AVAX is showing strong bullish momentum and we can expect the price to continue going up. It's possible for the price to go up much higher but in its current up wave, we have a bit more energy left to take us to 103.
Please like and follow so you don't miss critical updates such as this. Message me if you want to be added to the group chat in TradingView.
Not financial advice. Trade at your own risk.
AVAXUSD trade ideas

Long- possible impulsive move up for AVAXthis might not happen just an interesting idea. if we keep following this trend line we could be good till $117+. I'd get really careful after $124 - $125.

AVAX to make a 7-16% gain 🚀We see strong rejection of the buying zone. If you zoom into lower time frames, it will be apparent to you the amount of buying at this level. There is sufficient momentum to take us to the $96.7 price level. I expect the $88 price level to hold. If it breaks, that could change the dynamics, and I would need to provide an update. Please ask in the comments if I forget to give you guys an update.
My BTC update will contain an overall crypto market update and a list of the ideas for the day.
Take a look at my highly accurate predictions based on the momentum-based system that I'm developing; please like and follow me to show me your support so that I'm motivated to continue posting and receive all of the latest updates as I post daily. I do this for free, and in return, all I ask of you is to leave a comment and hit that like button. Also, drop in a chart in the comments that show nice consolidation, and I will tell you which direction the break out will be 😉
Here is a small snapshot of the system that's producing these signals. It's been built by someone with over 10000hrs of experience building trading systems and advanced and complex indicators ibb.co It's beyond what you will find online anywhere 😉
Not financial advice. Trade at your own risk.

AVAXUSD outlookCurrently in a correctional wave. Its very easy to be blindly bullish - especially with recent price action.
What goes up must come down again before going up again.
Looking for major wave X to complete before it goes down.

AVAX Bull Cycle Prediction 3/30/22AVAX Bull Cycle Prediction 3/30/22
Indicators
HMA
Williams Alligator
MACD
RSI
Last HMA cycle in august of 2021, AVAX went up 1000% at its highest point. Bearish divergence finished off the cycle in November 2021.
This prediction uses previous cycle data, and fibonacci as targets. 1-2-3-4 618 levels.

Avalanche: Ready to AvalancheAvalanche still has time until the resistance at $98.77 to finish wave B in green, but it could also decide to avalanche into the orange zone between $70.58 and $58.31 immediately. There, it should complete wave C in green as well as wave ii in orange and use its drive to change direction. In contrast to its namesake, Avalanche should then rush upwards above the resistance at $98.77. However, there is a 35% chance that Avalanche might endeavor to emulate said namesake and slide below the support at $53.16.

AVAX Pullback for Perfect LONG Entry !Currently 0.786 fib level holding resistance as AVAX pullsback after an insane pump,
We look to LONG or BUY the retracement of AVAX to the 0.5 fib level, overlapping with the crucial support @ 103 to 98 zone (white box)
TP will be next major resistance at
TP1 123.8
TP2 143.73
SL 86.15
Do show your support by liking and following if my ideas were helpful : )
Feel free to leave your thoughts and comments below ~

avax/usdTesting/tracking elliot wave theory. Please do not trade off idea without S/L. Not financial advice.
Link to previous chart:
The 5th wave of the minor wave (3) cycle hit sooner than expected and we've reached the bottom of the wave (4) retracement. We should be working on the last impulse wave (5) of the bigger cycle as shown. The price of wave 4 has entered price territory of wave (1), which normally doesn't happen too often, but when it does, it's a good indication that the bottom is in or near, unless its a dead shitcoin. I don't think avax is dead as there are a lot of good development from the team.

AVAX SHORT !!! #AVAX #CRYPTOAs it is shown that the emergence of a candle with WICK and medium size, this indicates the descent to the support, then the rise towards the resistance

AVAX reaching 86as we can see it's under the POC of the volume profile and from the stochastic RSI there is an obvious sign of going up, in my personal opinion it will reach at least the point of control 86, and my goal is 2%

AVAX double bottom, breakout points and 50 day SMAI'm noticing this beautiful double bottom with handle on AVAX so I'm picking several points to prove my analysis. One the price continues to move up out of this handle. Two the price moves above the left side of the W. Three the price moves above the right side of the W. Four, if the price does fall down to the 50 day SMA as a test of support, it bounces off that support and moves higher.

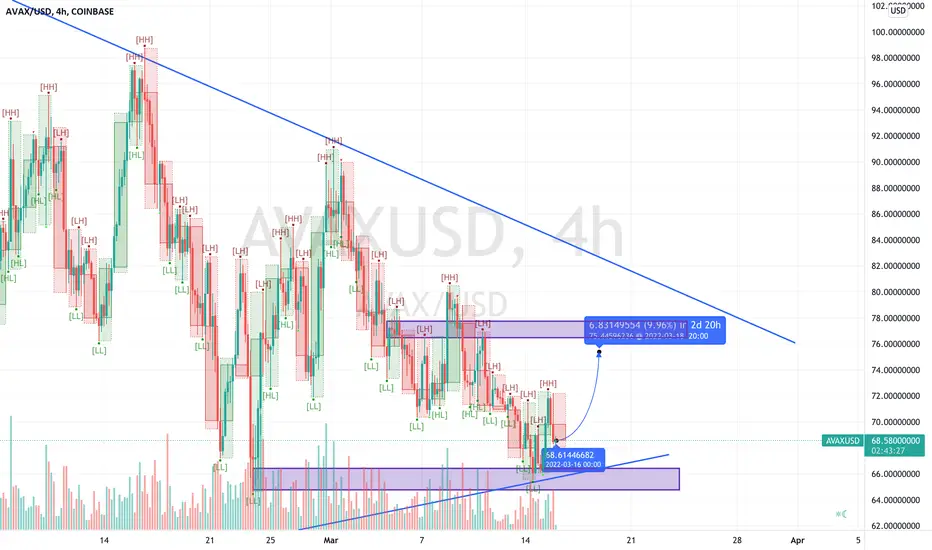
AVAX good for 5-10% gain in the next 48hrs or soMore details of the market trend are available here:
AVAX
Entry $83.41
Exit 1 $88.90
Exit 2 $91.49
TP Target 1 6.6%
TP Target 2 9.69%
I'm doing something a little different now. I'm posting what my entries and exits are. I plan to sell 50% of the coins at Exit 1 and another 50% at Exit 2. My overall plan projects over 10% of gains in the next 48hrs. However, I will take my profits at around 5% profit for the entire basket and close out the trades if the levels are close enough. Take your winnings! 😊
As a reminder, follow, like, comment. You haven't seen anything like this ever in TradingView. Get it while the getting is good cause I have no idea how much longer more I will do this to give back to the community that has given me so much over the past 10+yrs.
A kind reminder, trade at your own risk, and best of luck to you!

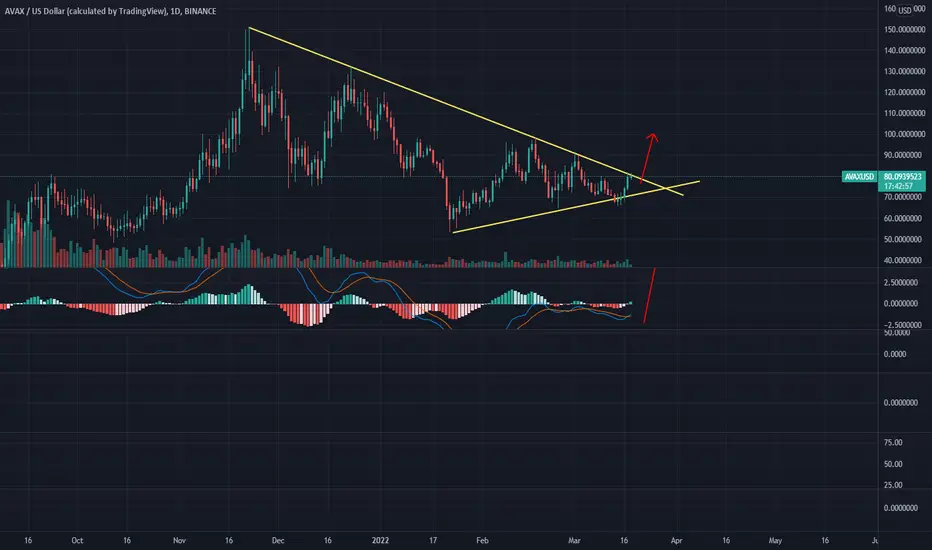
If this symmetrical triangle is valid on AVAX, target= $177These seem like the most valid trendline for the avalanche usd pair on the weekly chart. If this is a valid pattern and the top trendline is correct then we should see the breakout confirmed by early April. If so the target would be $177. *not financial advice*

AVAX Looks BullishOn the left (USD pair) shows a falling wedge where price has broken out of, this breakout should continue bullishly
The BTC pair on the right also looks bullish, having established a heavy support along the 1.618 Fibonacci circle line

Bearish 3 Line Strike at Support Level with 67% Upside PotentialWe have a Weekly Bearish 3 Line Strike while showing Hidden Bullish Divergence at a Support Level Breaking a Trendline that if Broken out of could take us to around $140

AVAX.Usdt (Y22.P1.E3).Go longHi All,
Perfect bump and run structure and we just had a retest on the lead in trend line.
Once we pass this 618 resistance, up it goes to the fib ext. of 1 or near about.
We will likely see a consolidation under this resistance and it would surprise me we break out soon.
It is obviously a strong resistance as in the past.
How to trade this, look for smaller time frames for an entry.
For now, I'm looking at this level on the 4 hr chart for some sort of bull flag
#AVAX #Avalanche
All the best,
S.SAri

AVAXUSD pretty good mtf setup here tbh
long to .618 bluebox confluence
s/l previous fib level or below the current breakout candle
decent rr

Why AVAX Price Is Positioned For Exponential GrowthAVAX has registered a spike of around 12% in the past 24 hours. The token is trading at an average price of $90.05, at the press time. The AVAX’s 24-hour volume of $2,105,943,120 has seen a surge of over 42%. It is interesting that the coin managed to stay above the $90 resistance level. According to CoinMarketCap, the Avalanche token is the 10th biggest cryptocurrency with a total market capitalization of $24.03 Billion.

AVAX, can it break through?The following is machine translation:
Reach the edge of the breakout triangle area.
If it can effectively break through, there will be a wave of market trends.
If it can't break through, it may also oscillate in the triangle area.
Judging from the macd indicator, there is a high probability of a breakthrough, and the macd golden fork is bullish. Unless a larger pullback tonight turns into a rejection of the golden fork.
AVAX Long target detected, 7%+ gain on its wayThere are a couple of lagging coins and AVAX is one of them. I expect these to have a burst of momentum upwards within the next couple of days and it should be good for a conservative 7% gain.
I don't just post signals, I trade them too 😉
i2.paste.pics


AVAX tradecoin M30Risk warning, disclaimer: the above is a personal market judgment based on published information and historical chart data on Tradingview, all analysis is only subjective. Hope investors consider, I am not responsible for your investment decision. Thank you.
Good luck
