AVAXUSD trade ideas


AVAX simple flipAs we see AVAX has shown a potential s/r flip on the 1d. This could fill the gap up to 30-33$ with a stop in the 19s. high r:r

AVAX: DID'NT DISAPPOINTMy target resistance was around $20
It broke it and exceeded ....
I'm looking for a retracement to probably around $24 also to act as my support...then gonna target above $30
Patience is 🔑


AVAX Idea - Possible ReversalI see a possible reversal with the formation of a double bottom in the 1.618 fib range
This reversal may be short lived however (in red) or price breaks this resistance line
A double bottom is a strong reversal sign

AVAX bullish breakout coming AVAX reached my bottom target and turned to move bullish. I marked green area as accumulation zone. This is strong support zone from beginning of the year and buyers should take control over the price movement here. Sellers mostly left the market, meaning its buyers’ market now.
The accumulation area on a price and volume chart is characterized by mostly sideways movement, which is seen by investors or technical analysts as indicative of large investors buying, or accumulating, a large number coin of over time. Identifying this area could help investors spot good entry points into an investment before its price begins to rise.
AVAX is on my long-term hold list, I’m targeting $21, and a breakout should take the price to red trendline around $28.

AVAXUSDAVAX is currently bearish, however, it has been consolidating for 118 days and seems to have found support.
Steps to take:
1) Buy at $13.50 support area OR candle open/close above $18.00 resistance line OR multiple buy signals
2) Sell if candle open/close below $13.50 support


AVAXPERP - ideas update- This counter shall do some bullish. My assumption was base on the price is almost hitting lowest support line.

avax/usd 21ema is crossing up on the 50ema. once we get a 6hr cross could be good indicator for a decent uptrend.

AVAX breakout trade! Are you ready?Hi Traders!
AVAX is probably one of the undervalued L1 blockchains out there. Now that AVAX-BTC is coming out of a Wyckoff accumulation, we can prepare a trade on the USDT pair with higher confidence.
What I see is this:
+ A Tenkan/Kijun crossover and a kumo breakout on the Ichimoku
+ Demand spikes in the volume, a typical volume signature of accumulation
+ A triangle consolidation range below resistance since May, slightly downward facing which gives it a bullish character (you could also identify it as a cup & handle)
Depending on BTC action this week we may see one final breakdown before a run up. In the worst case the order block at 24.7 can possibly give us a bounce during which we should attempt to set SL to breakeven immediately and trade it as a "liquidity grab" below the EQL line.
If BTC remains stable we can just look for a regular triangle breakout with volume confirmation and buy the re-test, which gives us a better entry instead of longing right below the resistance.
Happy trading!


Avalanche (AVAX) - May 10Hello?
Dear traders, nice to meet you.
By "following" you can always get new information quickly.
Please also click "Like".
Have a good day.
-------------------------------------
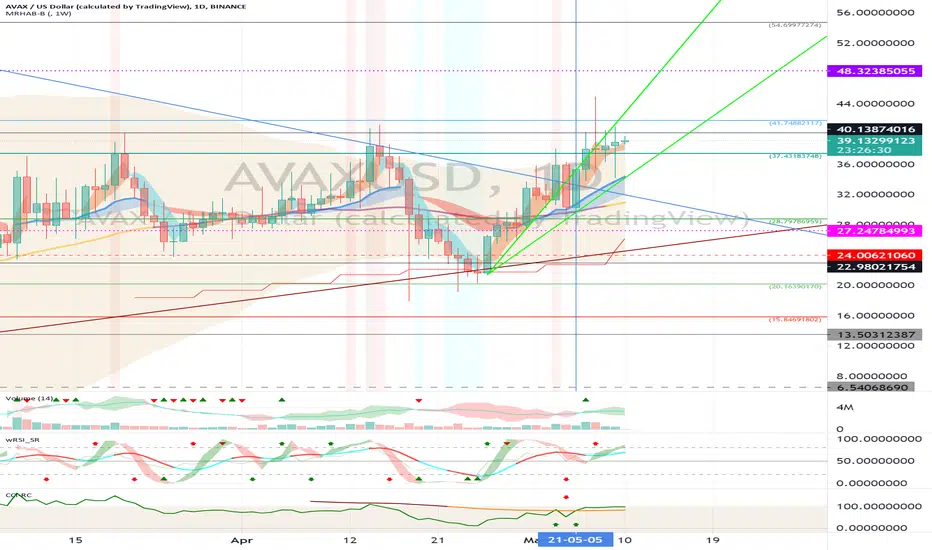
(AVAXUSD 1W chart)
(1D chart)
We have to see if we can get support at 37.43183748 and rise above 41.74882117
In particular, it remains to be seen if it can rise along the uptrend line.
If you fall from the 37.43183748 point, you can touch the 28.79756959 point, so you need to trade carefully.
In particular, if you fall below the downtrend line, you need short-term Stop Loss.
If it falls in the 22.98021754-24.00621060 section, a Stop Loss is required to preserve profit and loss.
It remains to be seen if the CCI line can rise above 100 points on the CCI-RC indicator to maintain the uptrend.
-------------------------------------
(AVAXBTC 1W chart)
(1D chart)
We have to see if we can go up along the uptrend line.
--------------------------------------
It is advisable to trade at your average unit price.
This is because if the price flows below your average unit price, which was on an uptrend or downtrend, there is a high possibility that you will not be able to earn a large profit due to the psychological burden.
The center of every trade starts with the average unit price you start trading.
If you ignore this, you may be trading in the wrong direction.
Therefore, it is important to find a way to lower the average unit price and adjust the proportion of the investment, so that the money that ultimately corresponds to the profit can regenerate the profit.
-------------------------------------------------- -------------------------------------------
** All indicators are lagging indicators.
So, it's important to be aware that the indicator moves accordingly with the movement of price and volume.
Just for the sake of convenience, we are talking upside down for interpretation of the indicators.
** The wRSI_SR indicator is an indicator created by adding settings and options from the existing Stochastic RSI indicator.
Therefore, the interpretation is the same as the conventional stochastic RSI indicator. (K, D line -> R, S line)
** The OBV indicator was re-created by applying a formula to the DepthHouse Trading indicator, an indicator that oh92 disclosed. (Thank you for this.)
** Check support, resistance, and abbreviation points.
** Support or resistance is based on the closing price of the 1D chart.
** All explanations are for reference only and do not guarantee profit or loss on investment.
Explanation of abbreviations displayed on the chart
R: A point or section of resistance that requires a response to preserve profits
S-L: Stop Loss point or section
S: A point or segment that can be bought for profit generation as a support point or segment
(Short-term Stop Loss can be said to be a point where profits and losses can be preserved or additionally entered through installment transactions. It is a short-term investment perspective.)
GAP refers to the difference in prices that occurred when the stock market, CME, and BAKKT exchanges were closed because they do not trade 24 hours a day.
G1: Closing price when closed
G2: Market price at the time of opening
(Example) Gap (G1-G2)

AVAXPERP Düşen trend kırılımı Avax düşen trend kırılımı takip edilmeli kırılımdan sonra gelen re test ile değerlendirilebilir
YTD


