Alts to drop 50% then rise by 600-700% (BC)Buying Climax (BC) would be accompanied by a HUGE drop in BTC.D
Many alts testing their 2021 bull run Break of Structure areas.
AVAX is around 76-77.
This would make sense if BTC does go to 130K.
AVAXUSDT trade ideas

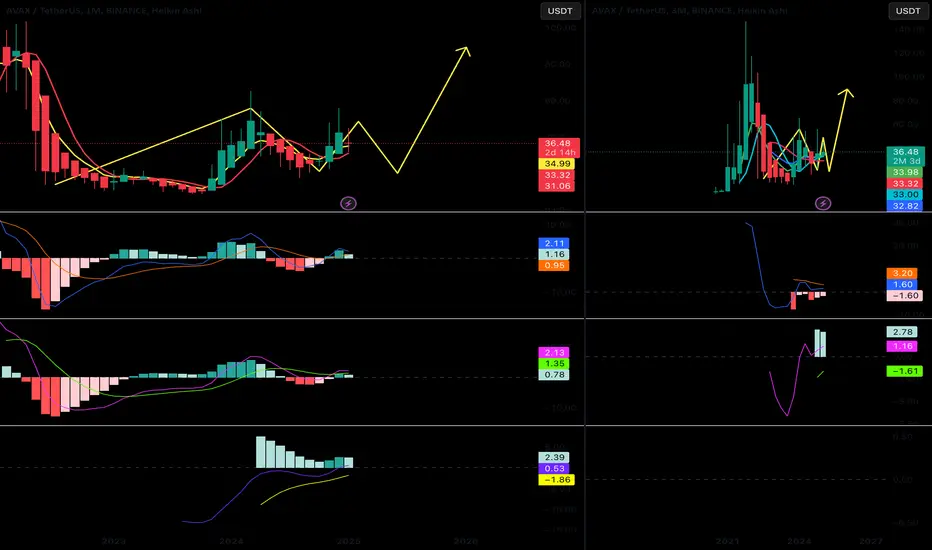
AVAX/USDTAfter the liquidity was taken out at the November low, the coin is showing a good reaction. I have highlighted the zone for buying the coin.
Targets for growth:
Target 1 = 30.35
Target 2 = 36.15

Avax analysis and review: another rise or fall?hello guys
We came with Avax analysis.
This coin has been suffering for almost 35 days after its price drop, and now that the price is at the bottom of the trading range, it is expected that we will have an upward movement by maintaining the support range up to the ceiling of the trading range.
In case of failure, we will give you a new update.
*Trade safely with us*

Will We Hear About AVAX in 2025?While the market fixates on degen trading, AVAX continues to fly under the radar. Yet, its ecosystem remains one of the most robust in the space. Here’s why it deserves attention:
Avalanche at a Glance
High-speed, multi-chain architecture – Subnets enable independent blockchains with customized rules.
EVM-compatible – Seamless migration for Ethereum dApps.
Near-instant finality – Avalanche consensus achieves low-latency, high-throughput transactions.
Market Position & Recent Developments
TVL: $1.43B (9th among blockchains per DeFiLlama).
Recent Institutional investments:
- In December 2024, the Avalanche Foundation secured $250 million through a private token sale , with participation from firms like Galaxy Digital, Dragonfly, and ParaFi Capital. This funding supports the upcoming Avalanche9000 upgrade, aiming to enhance scalability and reduce transaction costs.
- BlackRock launched its USD Institutional Digital Liquidity Fund (BUIDL) on the Avalanche blockchain via Securitize, marking a significant move in asset tokenization.
Tech Updates
- the newest upgrade "avalanche 9000" is now live ; the main objective - to lower fees 25 times - is successfully achieved.
Price Action & Accumulation
Accumulation since mid-2022 → Local rally in late 2024 with volume divergence.
Price retesting previous accumulation highs (Creek) after rejecting breakout attempts.
Volume profile insight: No major resistance zones above, suggesting minimal overhead sell pressure.
Potential Trade Setup
Considering a spot entry with manual exit, if next week's close confirms a higher low.
Key level: $26 – Strong support from prior accumulation phase.
Do your own research.
Everything is priced in.
Everything is on the chart.

AVAX Swing Trade Setup📊 Price Action & Trend Analysis
Analyzing market trends using price action, key support/resistance levels, and candlestick patterns to identify high-probability trade setups.
Always follow the trend and manage risk wisely!
Price Action Analysis Interprets Market Movements Using Patterns And Trends On Price Charts.
👉👉👉Follow us for Live Market Views/Trades/Analysis/News Updates.

AVAX LongRationale:
Bullish Divergence: 1D MACD shows a classic bullish divergence. Price is making lower lows, while MACD is forming higher lows. This suggests weakening bearish momentum and potential for a bullish reversal.
Demand Zone + Order Block (OB): Current price action is within a previously identified Demand Zone, an area of historical buying pressure. This zone overlaps with an Order Block, further reinforcing the potential for strong support and a bullish bounce.
Trend Change: The CHOCH indicator has recently transitioned from a downtrend to an uptrend. This confirms a shift in market sentiment and increases the probability of further upward price movement.
NOTE: In this position as you can see the RRR is 8:1. You can extend the SL for more safety.
Warning: Don't follow this trade set-up unless you can afford to lose.

AVAX buy/long setup (8H)From the point we marked on the chart, it seems that AVAX has started its correction.
An ABC pattern is nearing completion. The green zone is a fresh support level.
In this area, we can look for buy setups to enter a new pattern or wave D.
A daily candle closing below the invalidation level will invalidate this analysis.
For risk management, please don't forget stop loss and capital management
Comment if you have any questions
Thank You

AVAX - Avalanche bounce playBased on the simple structure of this chart on the 4 hr. I see a trend based bounce play, depending on the crypto market.
Watching for $28 area to hold and confirm to continue trend up.
Optimum trade for me will be a bounce off $29, back to GETTEX:50S

Avax long big movement commingAvax same case with ETH my indicators that I developed based on Gann's theory. The time indicator predicts that tomorrow, February 1, the price will have a big movement. In my opinion, from here we could climb seeking liquidity

AVAX 17% PUMP OR 5% DUMP INCOMING.If we can flip $34.50 (Monthly Value Area Low) into support, I would expect price to rotate to at minimum the POC (Red Line). the next target would be The value are high 17% away from current price.
If rejected, 5% drop could follow.
#Avalanche
Calculate Your Risk/Reward so you don't lose more than 1% of your account per trade.
Every day the charts provide new information. You have to adjust or get REKT.
Love it or hate it, hit that thumbs up and share your thoughts below!
This is not financial advice. This is for educational purposes only.

AVAX/USDT | 1W🩸 CRYPTOCAP:AVAX ⁀➷
#Avalanche. Macro chart Another
💯 Intermediate Target - $55
🚩 Macro Target 1 - $80
🚩 Macro Target 2 - $140
🚩 Macro Target 3 - $220
- Not financial advice, trade with caution.
#Crypto #Avalanche #AVAX #Investment #L1
✅ Stay updated on market news and developments that may influence the price of Avalanche. Positive or negative news can significantly impact the cryptocurrency's value.
✅ Exercise patience and discipline when executing your trading plan. Avoid making impulsive decisions driven by emotions, and adhere to your strategy even during periods of market volatility.
✅ Remember that trading always involves risk, and there are no guarantees of profit. Conduct thorough research, analyze market conditions, and be prepared for various scenarios. Trade only with funds you can afford to lose and avoid excessive risk-taking.

AVAX short-term bearish trendThe AVAX price is currently below the 20-day and 50-day Exponential Moving Averages (EMA) (magenta and orange lines), indicating a short-term bearish trend. Market sentiment remains pessimistic, negatively impacting demand. The 4-hour analysis suggests that AVAX may struggle to break through the upper resistance level, which is also evident on the daily chart. I marked in blue the support zone that has been lost for now, but it could be reclaimed as it has proven to be quite strong in the past.
RSI: Bearish (below 50)
Stochastic RSI: Oversold, so a slight rebound is expected
MACD: In the bearish zone and showing a bearish signal
For a long time, AVAX was moving within the yellow sideways range, but due to BTC’s influence (what else?), it broke downward and re-entered the downtrending channel (red zone). However, if Jeremiah doesn’t tear down the sandbox and we can keep playing, I believe AVAX will break out of this downtrend since, in my opinion, it is undervalued.
Nevertheless, I’ve outlined a Plan B (red path), which could influence its movement. If tonight turns out badly, there’s a chance that even the $31 support zone won’t hold, and AVAX could drop to the $26 zone. But this is just speculation—I find it more likely that the "kick effect" will work at the $31 level, pushing the price upwards if it reaches that point.
Red zones: Resistance levels
Green zones: Support levels
A bullish divergence is visible on the RSI in the 4-hour chart (orange line)
What do you think about AVAX? Option A or B (black or red path)?

AVAXUSD Bullish Bias Current Market Analysis & Strategy
The price has broken down to a key support level, but there are mixed signals across timeframes. Here’s my interpretation:
Daily Chart Perspective:
The pair appears to have bounced off the support line, suggesting potential bullish rejection (i.e., buyers are defending this level). This could indicate a fake breakout if the price stabilizes or reverses upward.
4-Hour Chart Observation:
The breakdown looks unconvincing ("fake") due to weak momentum or lack of follow-through. This shorter timeframe contradicts the daily chart’s bullish bounce, creating ambiguity.
Confirmation Strategy
To avoid acting on false signals, we need price confirmation:
1. Wait for the candle to close above the support level on the 4-hour chart.
2. A confirmed close above support would strengthen the case for a fake breakout and signal potential upside. If the price closes below support, the bearish breakdown is likely valid, and further downside could follow.
What do you think of this, my friends??

Prepare to BUY Spot AVAXUSDT (3M Cycle)🚀 Prepare to BUY Spot AVAXUSDT (3M Cycle)
🌟 AVAXUSDT is gearing up for a powerful 3M cycle breakout – A golden opportunity for accumulation! 🌟
🌍 Market Overview:
AVAX, one of the top 200 cryptocurrencies, has been in an extended accumulation phase. The upcoming 2-3 month correction is expected to provide the perfect buying window before a major uptrend unfolds in 2025.
📊 Trade Plan:
📌 Entry Point:
$20 - $30 – Optimal accumulation zone for positioning ahead of the breakout.
🎯 Target:
$80 - $100 – Aiming for a strong rally as the 3M cycle develops.
⏳ Hold Time:
Throughout 2025, aligning with the expected cycle expansion.
💡 Note:
Accumulate strategically within the recommended price range.
Watch for confirmation of bullish momentum as the next uptrend begins.
Patience will be key to capturing the full potential of this cycle.
🔥 AVAXUSDT is preparing for a massive move – Secure your position now! 🔥
AVAX Short termAVAX should reverse from here, the half supply or slide downwards to complete it. Watch out!!!!

AVAXUSDT: Short Opportunities On the Horizon!AVAXUSDT: Short Opportunities On the Horizon! 🔻
Here’s the game plan:
Blue Line: A solid target for short positions.
Red Box: A promising zone to look for new shorts.
Use your confirmation tools—CDV, volume profile, and LTF structure breaks—to ensure precision in your trades.
Let’s capitalize on these setups! Boost, comment, and follow for more winning ideas! 🚀
Let me tell you, this is something special. These insights, these setups—they’re not just good; they’re game-changers. I've spent years refining my approach, and the results speak for themselves. People are always asking, "How do you spot these opportunities?" It’s simple: experience, clarity, and a focus on high-probability moves.
Want to know how I use heatmaps, cumulative volume delta, and volume footprint techniques to find demand zones with precision? I’m happy to share—just send me a message. No cost, no catch. I believe in helping people make smarter decisions.
Here are some of my recent analyses. Each one highlights key opportunities:
🚀 GMTUSDT: %35 FAST REJECTION FROM THE RED BOX
🎯 ZENUSDT.P: Patience & Profitability | %230 Reaction from the Sniper Entry
🐶 DOGEUSDT.P: Next Move
🎨 RENDERUSDT.P: Opportunity of the Month
💎 ETHUSDT.P: Where to Retrace
🟢 BNBUSDT.P: Potential Surge
📊 BTC Dominance: Reaction Zone
🌊 WAVESUSDT.P: Demand Zone Potential
🟣 UNIUSDT.P: Long-Term Trade
🔵 XRPUSDT.P: Entry Zones
🔗 LINKUSDT.P: Follow The River
📈 BTCUSDT.P: Two Key Demand Zones
🟩 POLUSDT: Bullish Momentum
🌟 PENDLEUSDT.P: Where Opportunity Meets Precision
🔥 BTCUSDT.P: Liquidation of Highly Leveraged Longs
🌊 SOLUSDT.P: SOL's Dip - Your Opportunity
🐸 1000PEPEUSDT.P: Prime Bounce Zone Unlocked
🚀 ETHUSDT.P: Set to Explode - Don't Miss This Game Changer
🤖 IQUSDT: Smart Plan
⚡️ PONDUSDT: A Trade Not Taken Is Better Than a Losing One
💼 STMXUSDT: 2 Buying Areas
🐢 TURBOUSDT: Buy Zones and Buyer Presence
🌍 ICPUSDT.P: Massive Upside Potential | Check the Trade Update For Seeing Results
🟠 IDEXUSDT: Spot Buy Area | %26 Profit if You Trade with MSB
📌 USUALUSDT: Buyers Are Active + %70 Profit in Total
🌟 FORTHUSDT: Sniper Entry +%26 Reaction
🐳 QKCUSDT: Sniper Entry +%57 Reaction
📊 BTC.D: Retest of Key Area Highly Likely
This list? It’s just a small piece of what I’ve been working on. There’s so much more. Go check my profile, see the results for yourself. My goal is simple: provide value and help you win. If you’ve got questions, I’ve got answers. Let’s get to work!

AVAX USDT1. Triangle Formation
Currently, AVAX is trading within a triangle pattern, which could potentially be part of a strong weekly trend correction. This pattern suggests a phase of consolidation before the price decides its next significant move.
2. Decreasing Volume on Bearish Candles
The decreasing volume on bearish candles indicates that sellers are losing strength. Additionally, we are approaching the end of the triangle, which increases the likelihood of a breakout in the near future.
3. RSI Trendline Confirmation
Using an RSI trendline adds further confirmation to this analysis. It provides a stronger basis for predicting potential price movement. However, for safer entries, one could consider entering a trade above the last daily high to confirm the breakout.
It’s important to note that these analyses are based on probabilities, and even in the best-case scenario, there is only a 50% chance of them playing out. Therefore, risk and capital management should always remain a top priority.

AVAX LongAvax bounced at 34.50, where there's strong support, as well as the 4-hour EMA 200 on the daily chart. At the moment, we have broken the trendline and are currently testing prev week mid and monday mid also previous small rezistance.
If we manage to hold, I expect the price to shoot up to 38.96, and from there, I anticipate the price will go back to test the level of 37.68. If it holds, I’ll be opening a trade.

It is recommended to buy Avax :)Avax is very suitable for buying, everything is provided for you in a very simple and excellent chart. don't miss out

Avalanche (Avax) market analysis📈 AVAX Analysis Update:
AVAX has recently bounced off a strong support level on the 4-hour timeframe, with the RSI showing oversold conditions. Additionally, increased on-chain activity and growing adoption of Avalanche’s subnets suggest heightened interest from both retail and institutional investors. These factors indicate a potential bullish movement for AVAX.
📉 Expectations:
We expect AVAX to re-test key resistance levels highlighted in the attached chart. A breakout above these levels could open the door for further upward momentum.
📊 Trading Strategy:
This setup is based on a combination of technical indicators and volume trends, suitable for medium to long-term trades. Always ensure proper margin management and implement sound risk controls to navigate market fluctuations.
🚦 Trading Rules:
1️⃣ Rule 1: Enter the trade only after AVAX crosses above our entry-level (GREEN LINE ON THE CHART).
2️⃣ Rule 2: Once Target 1 is achieved, consider partially closing your position or moving your STOP LOSS to the ENTRY price to protect gains.
3️⃣ Rule 3: Avoid entering new trades based on the same signal after Target 1 is reached.
4️⃣ Rule 4: If AVAX consolidates for over 2 days without breaking resistance, close the trade and wait for new opportunities.
💡 Disclaimer:
This is not financial advice—just an educational post sharing my ideas and thoughts. Always conduct your own research and consult a financial advisor before making any investment decisions.
Feel free to reach out with questions or feedback. Trade smartly and stay disciplined! 🚀✨

AVAXUSDT ShortA small scalping i can see on avaxusdt if it shows some bearish momentum.
Than my trading setup will be the same i posted..
BINANCE:AVAXUSDT.P

avax drops to $8gm,
i came up with this theory a few years ago, and it's been lingering in the back of my mind ever since. it's one of the primary reasons i exited near the recent highs and have been sitting on my hands ever since.
you can check out my original theory here:
keep in mind that 98% of my work is completely private,
shared only with the members of lunar syndicate 9.
---
i’ve decided to make this idea public today, mainly because, well…
ain’t nobody gonna believe me anyway xD
---
so here it is:
over the next month or two,
avax is likely to drop down to $8,
where a multi-year bottom will form!
if we get it, buy the dip with both hands.
nothing lost if we don’t.
🌙

Avalanche 1-WEEK Chart SHORT/Mid-Term & longs TERM Targets 📍 Crypto SIGNAL #📍
COIN:
S
SKL/USDT
(3-5x)
Direction: LONG 📈
➖➖➖➖➖➖➖
➡️ Entry : 34/29
🔰 Targets
🎯 Short Term :
🎯 Target 1 - 40
🎯 Target 2 - 45
🎯 Target 3 - 48
🎯 Target 4 - 52
🎯 Mid-Term :
🎯 Target 5 - 60
🎯 Target 6 - 68
🎯 Target 7 - 80
🎯 Target 8 - 90
🎯 Long Term :
🎯 Target 9- 115
🎯 Target 10 - 130+
❌ Invalid Level :**Invalid Level: Close one-day candle below 22.**
➖➖➖➖➖➖➖
#SRFXTEAM💻
