Analysis and trading in 1 hourAccording to the amount of liquidity of the buyers, there is a possibility of high prices
Please consider risk and capital management if you trade the signal
thank you
entry:(21.1_20.5)
st:20.22
tp:23.40
AVAXUSDT trade ideas

AVAX/USDTThis week we will have CPI news and most likely we will have more fall on crypto, so you can buy ONE step in the fall and hold for long term.

AVAX analysis (1D)From where we put the red arrow on the chart, it seems that AVAX has entered the correction phase.
We now seem to be in the F wave.
The price can drop down soon.
If the g wave is normal, it can end on Entry 1.
But if the g-wave is extended, the g-wave can continue up to the Entry 2 range.
Risk-averse people can wait for Entry 2, and risk-taking people can enter the range of Entry 1 and Entry 2 in the form of martingale.
We have such a view on AVAX.
For risk management, please don't forget stop loss and capital management
Comment if you have any questions
Thank You

AVAX Technical AnalysisAvalanche (AVAX) Analysis
Avalanche (AVAX) has been gradually recovering after a significant drop that saw the price decline from the $31.89 level down to a low of $17.29. Recently, AVAX has been trading on a support zone (Yellow) at $20.69 - $23.04, indicating some consolidation as it attempts to regain bullish momentum.
Currently, AVAX is hovering around the $23.05 mark, just above the critical support zone (Yellow) at $20.69 - $23.04. Despite this recovery, AVAX faces strong resistance near the $24.53 level, as seen in the recent price action.
While the market is showing some signs of recovery, a further downside movement towards lower support zones, particularly the $20.38 level, seems possible if the buying pressure weakens. If AVAX fails to hold above the support zone (Yellow) at $20.69 - $23.04, it may re-enter a bearish phase, pushing the price back towards the lower support level that could determine its medium-term direction.
AVAX is currently at a crucial juncture, with the potential for further downside if it fails to break key resistance levels. Traders should watch for the price holds above the support zone (Yellow) at $20.69 - $23.04 for a potential bullish continuation or a rejection that could lead to a retest of the lower support levels.

AVAXUSDT the best chart ive seen for now...this avaxusdt chart way back it has a good wave or flow. this is base on my experience guys hope this must be helpful...
take note im not a pro trader this is base on my own experience

AVAX🔍 AVAX/USDT Analysis: 4-Hour Timeframe 📉
The AVAX/USDT chart on a 4-hour timeframe highlights significant upcoming times where price movements may present trading opportunities. It’s essential to analyze these signals in conjunction with higher timeframes for a comprehensive market view.
• September 8, 2024, 9:00 AM - Red Line: This time marks a potential local peak, signaling a possible moment to reduce exposure or take profits.
• September 12, 2024, 9:00 AM - Green Line: This time indicates a potential local low, offering favorable conditions for accumulating AVAX or entering long positions.
• September 19, 2024, 5:00 PM, September 25, 2024, 6:00 PM - Red Lines: These are additional times marking potential local peaks, suggesting moments to consider exiting positions before a downturn.
When working with this 4-hour timeframe, remember to evaluate these movements within the context of the broader market trend, considering higher timeframes for a more global perspective.
Note: The exact timing of these phases can vary by +/- a few hours. All times are based on UTC-7 (Los Angeles).

AXAX - Falling WedgeBull and Bear Case paths.
Within structure, at Strong Volume Zone.
$22.50 to $23.50 critical Bullish Order Block.

AVAX has a good trade set upAVAX on the weekly chart is setting up a good risk reward trade set up. This is a weekly chart so it will take some time to play out.
We have modified MACD about to cross the zero line. MarketCipher momentum wave turning. Modified RSI is at the bottom turning.
I will accumulate between $20-23 dollar range. Below 20 the structure breaks and that would be a stop loss.
This is not a financial advise. Please DYOR.

AVAX in a Critical Zone: Is a Rebound or Further Decline Ahead?Today, AVAX/USDT finds itself at a pivotal point, hovering around the reversion zone marked by the purple lines on the chart. Historically, this area has served as significant support and resistance, making today’s price action crucial for determining the next move.
Current Analysis:
- Price Action: AVAX/USDT is testing the lower reversion zone after a sharp decline from recent highs. The price shows signs of consolidation, indicating that traders are waiting for the next catalyst.
- Reversion Zones: The reversion zones (purple lines) highlight areas where the price tends to be drawn. Currently, AVAX/USDT is approaching the short reversion zone, a critical support level that could either hold, leading to a rebound, or break, leading to further downside movement.
Key Levels to Watch:
- Support Level (Entry 1): Around $21.70, this level could act as a springboard for a potential rebound.
- Support Level (Entry 2): Around $21.40, this completes the short reversion zone, making it highly likely for price interaction.
- Support Level (Entry 3): Around $15.50, given the downward channel, the current candles suggest a potential move to this level. However, reaching this level before the price enters the Exit Zone is less likely.
- Resistance Level (Exit Zone): Around $26.65; if AVAX/USDT can rally, this would be the first major resistance to watch and a potential take-profit zone for long entries.
- Downside Risk: A break below the reversion zone could see AVAX/USDT heading toward the next support level of around $15.50.
What’s your take on AVAX/USDT’s current position? Do you see a rebound coming, or is there more downside risk? Share your thoughts and strategy in the comments below!

Lingrid | AVAXUSDT key Support Signals Potential ReversalThe price perfectly fulfilled my previous idea. It hit the target level. As you've observed, BINANCE:AVAXUSDT has reached the resistance level and subsequently pulled back with bearish momentum. The price is now approaching the channel border, which has served as support multiple times in the past. This sets the stage for a potential reversal. The presence of the round number 23.00 below adds another layer of significance to this support area. The 50% Fibonacci retracement level is also an important factor to consider, as it can often act as a endpoint for corrections in a prevailing trend. Given these conditions, I anticipate potential rejection patterns at this support zone, such as a long-tailed bar or an engulfing candle. These price action signals would indicate a strong buyer interest at this level and could reinforce a bullish outlook if confirmed. My target is resistance around 26.55
Traders, if you liked this idea or if you have your own opinion about it, write in the comments. I will be glad 👩💻

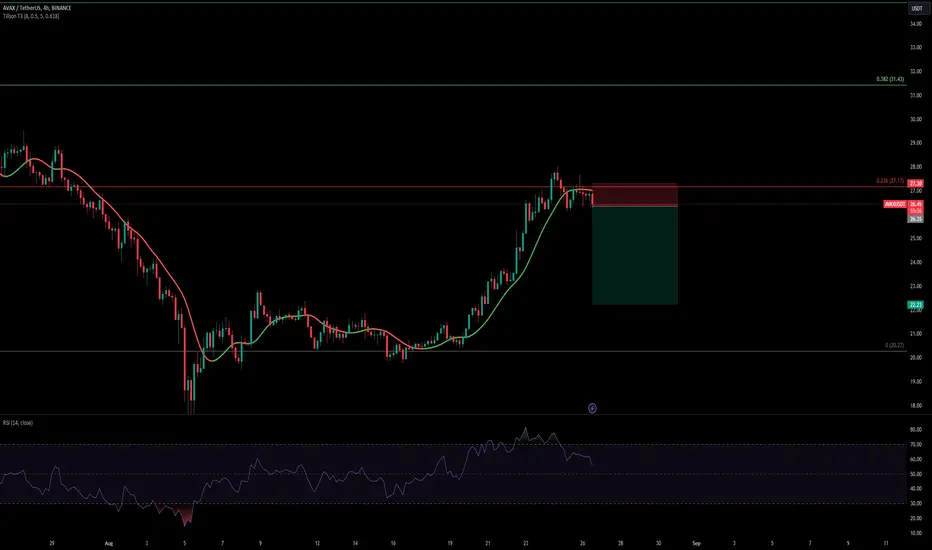
AVAXUSDT SHORT IDEAhello everyone, it hink btc build bart information. because of cryptomarket decrease in these days and there some bearish indicatoırs. i am one of the avax hodler almost 3 years but i will try avax short to add more avax o_O . avax also in resistance zone.
entry : 26,30
stop 27,30
target : 22-23 zone
its not financial advice. hope you earn money from this.
AVAXUSDT gives Bullish indicationsAVAXUSDT has finally broken out of the consolidation zone that has been developing since early August. On the weekly timeframe, the market formed an inside bar pattern, and the price has now surged above it, signalling a bullish outlook. Like many altcoins, AVAXUSDT has tested historical lows, revisiting levels from November 2023, where a significant price surge previously occurred. On the 4H timeframe, the price action has also broken through a triangle pattern, marking the end of an accumulation phase around 20.00 and indicating a potential bullish move. The market may retest the channel border and upward trendline. The target is the resistance zone around 27.50

AVAX#avax
#avaxusdt
#avax break the upwards trend line and confirm it.
Horizontal line now become resistance now , previous support at $26.88
Good opportunity to short --$26.88
Sl is - $28
Target is $23
#NFA
#DYOR

Lingrid | AVAXUSDT shows BULLISH sign. POTENTIAL LongBINANCE:AVAXUSDT has finally broken out of the consolidation zone that has been forming since the beginning of August. On the weekly timeframe, the market displayed an inside bar formation, and the price has now surged above it, which is a bullish sign. Like many altcoins, the market has tested historical lows, and in this case, the price revisited levels from November 2023, where we previously saw a significant price surge from this area. On the 4H timeframe, the price action has also broken through a triangle pattern, signaling the end of an accumulation phase around 20.00 and potential bullish move. I expect the market retest the channel border and upward trendline. My target is resistance zone around 27.50
Traders, if you liked this idea or if you have your own opinion about it, write in the comments. I will be glad 👩💻

AVAX USDT 15M🔍 AVAX/USDT Analysis: 15-Minute Timeframe 📉
The AVAX/USDT chart on a 15-minute timeframe highlights significant upcoming times where price movements may present trading opportunities. For short-term, intraday, or scalping trades, consider focusing on lower timeframes, but always ensure to analyze these signals in conjunction with higher timeframes for a more comprehensive understanding of the market.
• August 24, 2024, 01:15, August 24, 2024, 14:00, August 25, 2024, 01:45, August 25, 2024, 20:45 - Red Lines: These times mark potential local peaks. Traders might consider these as moments to take profits or reduce exposure, as the price could encounter resistance or a downturn.
• August 24, 2024, 05:30, August 24, 2024, 19:45, August 25, 2024, 08:45 - Green Lines: These times indicate potential local lows, providing favorable conditions for accumulating AVAX or entering long positions.
Note: The exact timing of these phases can vary by +/- a few hours. All times are based on UTC+3 (Kyiv/Istambul).

AVAX USDT 4H🔍 AVAX/USDT Analysis: 1-Hour Timeframe 📉
The AVAX/USDT chart on a 1-hour timeframe highlights significant upcoming dates where price movements may present trading opportunities. As always, it is crucial to analyze these signals in conjunction with higher timeframes for a more comprehensive understanding of the market.
• August 24, 2024, 17:00, September 6, 2024, 05:00, September 19, 2024, 17:00 - Red Lines: These times mark potential local peaks. Traders might consider these as moments to take profits or reduce exposure, as the price could encounter resistance or a downturn.
• August 31, 2024, 21:00, September 12, 2024, 09:00, September 24, 2024, 21:00 - Green Lines: These times indicate potential local lows, providing favorable conditions for accumulating AVAX or entering long positions.
When working with this 1-hour timeframe, keep in mind that these movements should be evaluated with a global perspective, considering higher timeframes to better grasp the overall market trend.
Note: The exact timing of these phases can vary by +/- a few hours. All times are based on UTC-7 (Los Angeles).

AVAX LONGThis chart illustrates the current price action of AVAX/USDT as it approaches a descending trendline resistance. The price is currently trading near $26.77, just below a critical weekly resistance level at $32.76. The momentum indicators below suggest potential bullish divergence, indicating a possible reversal if the price breaks through the descending resistance line. However, traders should watch for rejection at the trendline or the $32.76 resistance, which could indicate further downside movement.

$AVAX - LongBullish Falling Wedge Breakout and Retest Projection for AVAX. Bullish News of Grayscale and Franklin Templeton ETFs circulating.
3 weeks of Accumulation at Buying Order Block.
Bullish Change of Character with $23 to $24 as ideal structural retest Buying Entries.
PoC on VP at $36
Falling Wedge top at $41

Avalanche (AVAX) Enters a Pre-Bull Run Accumulation Zone – perspGrayscale Investments announced the creation and launch of Grayscale Avalanche Trust along with 20 other crypto investment products, including Solana, Litecoin, Stellar, Zcash, Chainlink, etc. Hence, the positive market sentiments have lit up as the AVAX price makes a bullish move towards the interim resistance zone between $28.29 and $30 from the lows below $20. However, the price is believed to have entered a preparation period which could be followed by a massive upswing.
The long-term price action suggests the price is heading towards the end of the accumulation phase. The token has undergone a similar consolidation that it displayed before the beginning of the 2021 bull run. Hence, a breakout from the current range could attract massive bullish attention, eventually triggering a fine rise, which may further transform into a bull run. However, the target remains slightly elevated, as the bulls do not appear to be well in position at the moment.
The Bollinger bands have begun to converge but are not showing the possibility of an expansion, which indicates a breakout. Besides, the levels of the DMI are approaching each other for a bullish crossover, which may consume some more time. Therefore, the AVAX price may continue to maintain an ascending consolidation and surpass the interim resistance zone. However, after surpassing the average bands of the Bollinger and rising above 0.236, this may validate a surge above the bearish influence.
Therefore, considering the Fibonacci levels, the new ATH could be above $154 in early 2025 if the Avalanche (AVAX) price breaks above the consolidation before the end of Q3 2024.

AVAXUSDTAvax daily time frame analysis
Avax must first break out of the $33 resistance to become bullish. Otherwise, the best time to buy support is 8.61-9.83, which can be a very good support for long-term buying.

AVAX - LONGWe are going up the stairs, I am waiting for the continuation.
The market has already started to grow, we are trying hard to catch coins that have not yet grown significantly.

