AVAX-Trade PlanAVAX USDT pair is currently range bound. It can give opportunity in either direction. Both trade plan with prope risk mangement are shared.
AVAXUSDT trade ideas

#AVX AVAX holding onto this strong UTA trading idea for the crypto space, to buy AVAXUSDT between $44 and $47, stop loss as a move under $43, with a target of $68.
If buying at current levels you are risking $4 to make potentially $21 so not a bad risk/reward on the trade. March the 5th highs at 44.36 were respected and held on the 5th of April, so i don't really want to see price below there, but i will give it space to 43 just so it doesn't wick us out. There was some decent volume traded under $43 so i think thats fine as a stop loss. On the upside the recent swing high at $50 needs to break which should then bring on some momentum to the upside.

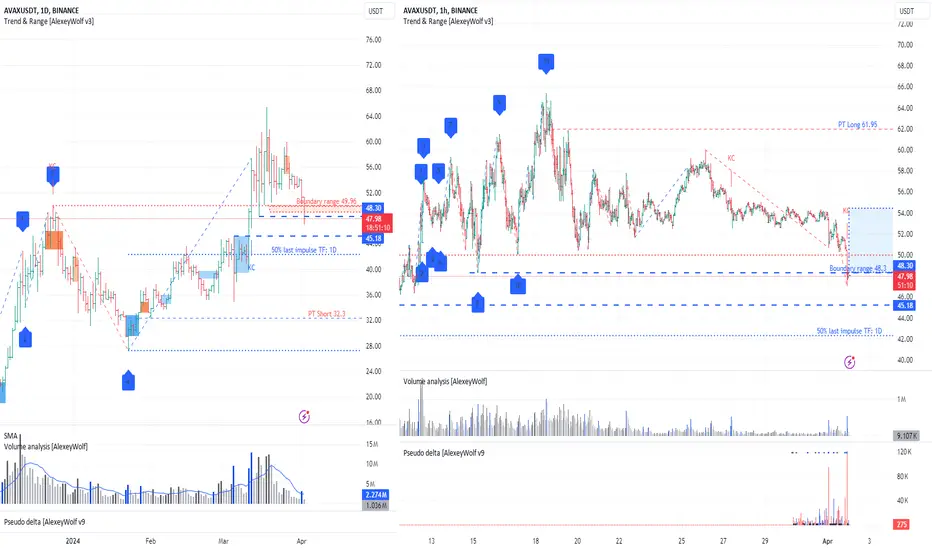
AVAUSDT. We have context for both selling and buying. It's an interesting situation. We have context for both selling and buying.
On the daily timeframe, there's a sideways movement (upper boundary - 49.96). The price has now returned to it, but the daily candle has not yet closed. If the daily candle closes inside the sideways movement, then we can look for sales, and the bearish vector 5-6 with a target at 32.3 will be relevant. There are two threats for the bears along the way in the form of buyer zones (blue background). The first one is at 48.3, which is currently being interacted with. The second threat is the buyer zone with the upper boundary at 45.18.
On the hourly timeframe, the price is at the lower boundary of the sideways movement (48.3). The bearish vector 11-12 has played out. The launch of the bullish vector 12-13 with a target at 61.95 is possible.
In summary, the daily and hourly buyer levels coincide (48.3). If the buyer shows itself at this level, then we can consider buying, taking into account the seller zones on the daily chart (red background). If the seller defends the breakout of the level 48.3, then we can consider selling, taking into account the daily buyer zone (upper boundary 45.18), inside which, by the way, lies 50% of the last daily buyer impulse.
For a more detailed explanation of how to read charts and consider different timeframes when looking for trades, you can refer to the article
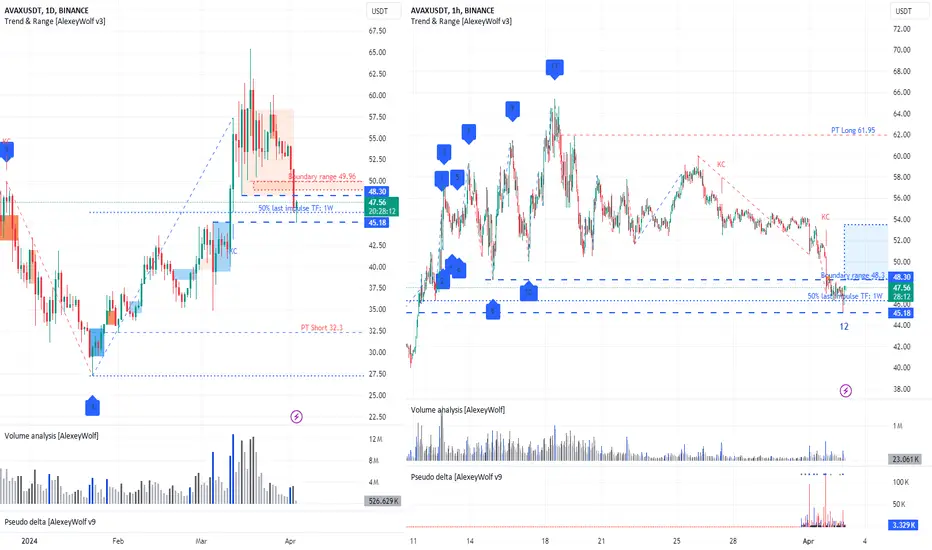
AVAXUSDT. On the Daily timeframe, selling takes precedenceOn the daily timeframe, we see a sideways movement with the upper boundary at 49.96. The price has been above the upper boundary for the last 20 days, but yesterday it returned to it and stopped at the 50% level of the last buyer's impulse on the weekly timeframe. This is clearly visible on the hourly timeframe:
At the top, a seller's zone has formed with the upper boundary at 48.3 (red background), and at the bottom, a buyer's zone with the upper boundary at 45.18 (blue background). I anticipate price interaction with the seller's zone of interest. If the seller defends the range of 48-50, we can consider the possibility of sales, and the bearish vector 5-6 will become relevant with a target at 32.3. However, on the way to this target, sellers may be hindered by the buyer's zone, with which there was just interaction and a bullish reaction began, as clearly seen on the hourly timeframe.
On the hourly timeframe, the price is below the lower boundary of the sideways movement at the level of 48.3. The bearish vector 11-12 has already played out, and we can expect the launch of the bullish vector 12-13 with an ambitious target at the level of 61.95 (ambitious, because the buyer will have to overcome the seller's zone on the daily timeframe). To launch the bullish vector, the buyer needs to raise the price above the range of 48-50 and protect it.
For a more detailed explanation of how to read charts and consider different timeframes when looking for trades, you can refer to the article
AVAX - Levels to watchDisclaimer: This is not financial advice. Most traders lose money. Trading in digital assets, including cryptocurrencies, is especially risky and is only for individuals with a high-risk tolerance and the financial ability to sustain losses.

AAVE, the next AVAX? 115% upside potentialAAVE / Weekly
- It's a weekly candle chart
- IF we close above $113 this week, a rebound is very probable
- There is the recent resistance line of $150, but high probability that we smash it through and go at least to $240

Avax Premium SignalAlright, folks, check this out. I've got a premium signal straight from the consulting chatroom where we've been hashing things out. Our analysts are in on the juicy stuff, only dealing with insider info from the big players like market makers and whales. Forget about all that technical analysis mumbo jumbo when the heavy hitters are making moves. This deal's set to hit its targets in the next few weeks. None of that trend line or Fibonacci nonsense here. Our endgame? Making bank, plain and simple. And let me tell you, these free signals ain't gonna come around often. Use your noggin, do your own research, and make your moves wisely, alright?

AVAX to 102 USDTarget to the falling wedge 102 USD . AVAX/ETH and AVAX/BTC we also have a huge falling wedge!!

AVAX 07/04/2024Avax increased by 9.47% from weekly imbalance level. We are in the discount level and it is better to accumulate from these levels. Price can give a retest now and continue to fill imbalances above.
If we pass the Weekly open level then we can target higher prices. PWO and MO is at the same level which makes it strong resistance level.


Avalanche / AVAX analysisThe price of AVAX is $20.7 today with a 24hour trading volume of 400 million dollars and its 95% up since last month
Avalanche is a layer one blockchain that functions as a platform for decentralized applications and custom blockchain networks. It is one of Ethereum’s rivals, aiming to unseat ethereum as the most popular blockchain for smart contracts. It aims to do so by having a higher transaction output of up to 6,500 transactions per second while not compromising scalability.
Avalanche’s bridge has performed over $60B in transfer recently a key factor in its rapidly growing DeFi ecosystem but now lets look at the price and chart
breaking 12 resistance and down-trend was a great opportunity for scalpers to long and make some quick buck. as you see 21-22 is the next resistance and after hitting 21 we had some correction
like most asset classes the market waiting for Federal Reserve's first meeting and rate decision of 2023 so be ready for some volatility in crypto. for long term Im bullish on avax
avax next targets are 23, 25 and 27

AVAX/USDT Analysis📈AVAX has successfully formed a 'W' pattern accompanied with a bullish engulfing on the ATL(All Time Low) level,so we are expecting a bull run📈 in the coming months,AVAX to the moon🚀🚀🚀.

My key points and idea on AVAXI believe the technical analysis and patterns illustrated on the chart are clear to the trained eye. this is not a signal nor anything like that. I just wanted to share my insight here and I would appreciate any opinion from you folks. Thank You :)

AVAX) Chart Analysis: Potential Bullish Breakout from Wyckoff This analysis examines the Avalanche (AVAX) price chart, specifically focusing on a technical pattern that suggests a possible bullish breakout.
Wyckoff Accumulation Schematic:
The chart appears to be exhibiting a Wyckoff accumulation schematic. This theory, developed by legendary trader Richard Wyckoff, suggests a price pattern that can precede a significant upward move. Here's a breakdown of the Wyckoff accumulation phases:
Spring: An initial downtrend that tests support levels and identifies strong buying interest.
Selling Climax: A sharp price drop that shakes out weak holders.
Accumulation Schematic: A trading range with relatively equal highs and lows, representing accumulation by informed buyers.
Markup: A sustained price increase as buying pressure overwhelms selling pressure.
Potential Breakout:
The current price action suggests AVAX might be nearing the end of the accumulation phase and on the verge of a breakout, or "jumping the creek" as some analysts refer to it based on the Wyckoff terminology. This breakout would ideally be accompanied by increased trading volume to confirm buying pressure.
Target Price:
Based on the Wyckoff accumulation theory, the target price for AVAX could be around $87 or higher. This target is projected by measuring the height of the accumulation range and adding it to the breakout point.

$AVAX 2 more days to go before we pop imho
reclaim 7 ema and then previous range low to flip range high and initiate fomo
assuming dominance must be topping out and dixie ready to get knocked back down
afk most of the times with some low leverage trades
2 weeks of fast n furious incoming
invalidation beloow vwap or looser yet 200 ema
rsi crossing yellow band shohld help us along
got some more QI in anticipation till 4.2c

AVAXUSDT SHORT OUTLOOKHello Traders, this is outlook that i think might be work. All Entry, Stop Loss, and Take Profit its already showed up. All trade it is on yourself. DYOR.


AVAX weekly chart analysis
AVAX weekly chart analysis
i am highly bullish on avax chart
we are on trendline support zone
target are mentioned enjoy free ride
boost me follow me

Livermore Cylinder and Elliot WaveImagine peering into a TradingView chart and spotting a Livermore accumulation cylinder, standing tall and proud amidst the sea of price action. It's like stumbling upon a hidden treasure chest in the vast ocean of market data.
And nestled within this cylinder, you notice the graceful formation of an Elliott Wave leading diagonal, tracing its elegant path across the chart like a dancer on stage. Each wave seems to tell a story, hinting at the market's intentions with every graceful movement.
As you study this mesmerizing spectacle, your mind starts to race with possibilities. What could this mean for potential targets? Could it be signaling the beginning of a powerful uptrend, or perhaps a subtle shift in market sentiment?
The targets seem to shimmer like distant stars in the night sky, teasing you with their allure. Could the Fibonacci extension levels offer clues to where the price might journey next? Or maybe it's the historical support and resistance zones that hold the key to unlocking the chart's secrets?
Whatever the case may be, one thing is for certain: this chart is a canvas of opportunity, waiting for the astute trader to decipher its hidden messages and navigate the markets with skill and precision.

Avax finally in demandAVAX, one of my largest holdings is finally in the daily local demand zone. I am starting to add heavily here as there are multiple converging supports in this price range. We approach the 100EMA which is typically a very strong support. We are hitting the demand zone (again support) , the real like is a diagonal support. A bottomed stochastic points to a reversal soon, but this depends on BTC. If BTC gets that prehalving crash, the more brutal downside target is marked as a dashed red.
-I am not using leverage (avax is a long-term bet for this cycle, and somewhat of a risk hedge)
-I am averaging to an already large position
-I have been in AVAX since last cycle very early
-Stay safe!

AVAX / USD Looking goodLong term targeting a $600 AVAX. But if I can catch a long when this level is hit I can see us flying back to ATH's fast!

AVAX: sell in trend📊Analysis by AhmadArz:
🔍Entry: 46.22
🛑Stop Loss: 47.59
🎯Take Profit: 44.77-42.68-40.09
🔗"Uncover new opportunities in the world of cryptocurrencies with AhmadArz.
💡Join us on TradingView and expand your investment knowledge with our five years of experience in financial markets."
🚀Please boost and💬 comment to share your thoughts with us!

AVAXUSDT 5 % SCALPING The AVAX/USDT trading pair is currently situated within a buying zone ranging from 46 to 46.30 USDT, presenting an attractive opportunity for a scalping long trade. Scalping involves exploiting short-term price movements for quick profits, making this buying zone ideal for traders seeking to capitalize on rapid fluctuations in AVAX's price against the US Dollar.
The concept of a buying zone refers to a price range where there is a notable accumulation of buy orders or increased demand for the asset. In this case, the buying zone indicates a region where traders are showing significant interest in purchasing AVAX, potentially leading to a price increase.
Additionally, the trade strategy incorporates the principles of demand zones and trend lines. Demand zones represent areas on a price chart where buyers are likely to be concentrated, providing support for the asset's price. By aligning the trade with the demand zone, traders increase the probability of success by trading in the direction of market sentiment.
Moreover, the utilization of trend lines adds another layer of technical analysis to the trade strategy. Trend lines are drawn on a price chart to illustrate the prevailing direction of the market trend. By following the trend line, traders aim to capitalize on the momentum of the market, further enhancing the likelihood of a successful trade.
The target profit for this scalping long trade is set at 5%, indicating the desired percentage increase in the price of AVAX from the entry point within the buying zone. Achieving a 5% profit target requires careful monitoring of price movements and timely execution of trades to capture the desired profit margin.
In summary, the scalping long trade on the AVAX/USDT pair leverages the buying zone between 46 to 46.30 USDT, in alignment with demand zones and trend lines. By targeting a 5% profit, traders aim to capitalize on short-term price movements while minimizing risk. Effective execution of this trade strategy involves thorough analysis, adherence to technical indicators, and disciplined risk management practices.
