AVAX in the BULLRUNits taking Off for avalanche as all other necessary crypto, it's following the uptrend of the bitcoin
AVAXUSDT trade ideas
AVAX/USDTAVAX is currently in a consolidation phase.
The key area of interest is the liquidity zone around $20.14 combined with a daily FVG.
🎯 After a move into this zone, long setups can be considered — only if proper conditions are met.
Target to the upside: $21.49
📌 Waiting for confirmation before execution. No setup — no trade.

Price tapped the OB. I didn’t flinch.This was surgical. Price delivered into a 1H OB with precision — not luck, not noise — but with the full weight of algorithmic intent behind it.
My breakdown:
After price expanded into 21.50, it left behind a clear inefficiency trail — multiple 60min FVGs and a sharp void beneath the premium leg. I marked the OB that anchored the move — it hadn’t been retested. That’s not a coincidence. That’s where Smart Money builds.
What followed was a retracement into a triple confluence zone:
1H Order Block
Dual stacked 60min FVGs
Golden fib zone (0.618–0.786), perfectly aligned with 20.05–20.32
This isn’t about catching a falling knife. It’s about understanding why price would want to deliver here — and what it's likely to target next.
Expectation:
From the 20.05–20.32 reaction zone:
First objective: 20.99 (0.382 fib)
Next: 21.35 clean inefficiency fill
Final draw: 21.50 high / liquidity sweep
If we break below 20.00 with intent, I’ll wait lower. But until then, price is simply reloading.
Final words:
I don’t react emotionally. I prepare structurally. This is where most traders get trapped. I don’t.
“There’s no guesswork when you know where Smart Money enters.”

AVAXUSDT Forming Bullish reversalsAVAXUSDT is currently positioned at a major demand zone that has acted as strong support multiple times in the past. This area between $17 and $20 has historically triggered bullish reversals, and recent price action shows a potential bottoming pattern forming within this zone. The market has responded positively with a slight uptick in volume, indicating renewed buying interest from both retail and institutional investors. This setup could be the beginning of a sharp bullish rally, especially if the price holds above the support and breaks the near-term resistance levels.
Avalanche (AVAX) continues to attract investor attention due to its rapidly growing ecosystem and increasing adoption across DeFi, NFTs, and Web3 projects. As blockchain infrastructure becomes more critical, AVAX stands out with its high throughput and low-cost transactions, making it a competitive choice for developers and users. The network has seen consistent upgrades and ecosystem expansion, which boosts long-term investor confidence. From a technical standpoint, the current structure resembles a classic accumulation range with a breakout potential pointing toward a 90% to 100% gain in the coming weeks.
If AVAX can reclaim and hold above the $22–$23 level, it would likely trigger a strong impulsive move toward the $42–$45 target range. The risk-reward ratio remains highly favorable for swing traders and position traders aiming to capitalize on this potential reversal. The expected upside is clearly illustrated on the chart, and with broader market sentiment slowly shifting bullish again, AVAX could be one of the top performers in this cycle.
With confluence from strong technical support, solid fundamentals, and increasing investor interest, AVAXUSDT is setting up for what could be a major bullish leg. Traders should keep a close eye on breakout confirmation and volume expansion for entry signals.
✅ Show your support by hitting the like button and
✅ Leaving a comment below! (What is You opinion about this Coin)
Your feedback and engagement keep me inspired to share more insightful market analysis with you!

AVAX. USDTThe nature of the market itself is risky and tense.
Therefore, entry and exit must be done with more caution.
So:
I am going to buy the AVAX between $14 and $16, or at least buy a step. but I will complete my purchase at the indicated price.

HolderStat┆AVAXUSDCRYPTOCAP:AVAX price analysis: After triangle breakout and twin consolidation phases, Avalanche respects a rising wedge, pinging support near 23.00 as buyers eye the overhead trend-line at 25.00. Momentum hints at a bullish crypto forecast into resistance.

AVAX Long Swing Setup – Retrace to Major Support in PlayAVAX is undergoing a healthy correction, setting up a potential swing opportunity as it approaches the $19.00–$20.00 support zone. This level has held as a key pivot in the past, and we’re now watching for bullish confirmation to enter long.
📌 Trade Setup:
• Entry Zone: $19.00 – $20.00
• Take Profit Targets:
o 🥇 $22.50 – $24.00
o 🥈 $27.00 – $29.00
• Stop Loss: Daily close below $17.80

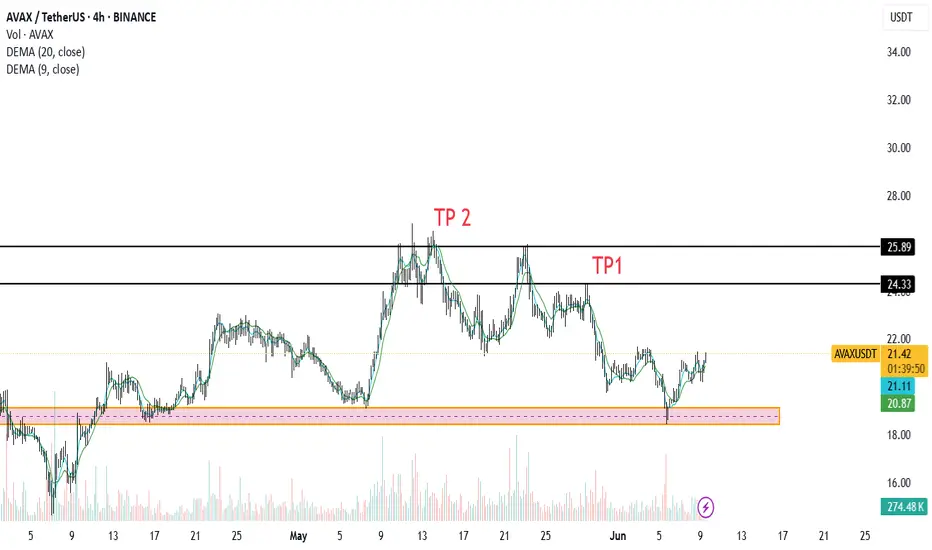
Trendlines Hold Firm: AVAX Faces Continued Selling PressureAVAX has been in a steady downtrend since mid-May, marked by two descending trendlines. Each rally into the upper blue trendline (around $21.20) has been met with selling pressure, resulting in lower highs. The red horizontal lines at $23.03 and $25.78 show prior support turned resistance, with the $23.03 level failing to hold when AVAX pulled back in late May.
More recently, price attempted to reclaim the steeper of those blue trendlines but was rejected, confirming bearish control. On the downside, the green support line at $18.63 has acted as a pivot zone twice (late April and mid-May), and the $16.00 area served as a strong floor in early May. With momentum still favoring sellers, a short entry at the next rejection near $21.10–$21.20 offers a favorable risk/reward.
Below are the precise levels:
Trade Setup (Short AVAX/USDT)
Entry: Short around $21.10–$21.20 after a clear wick/rejection against the upper blue trendline.
Stop-Loss: $22.00, just above the failed breakout zone and beneath the $23.03 resistance.
Take Profit 1 (TP1): $18.63 (recent horizontal support).
Take Profit 2 (TP2): $16.00 (major demand zone from early May).

AVAX Bulls Walking into a Trap? Yello Paradisers, are we on the edge of a clean breakout or is AVAX setting up the perfect trap before flushing the late bulls?
💎#AVAXUSDT has recently broken above a critical resistance zone and is now attempting a retest. This move appears strong on the surface, but it sits at a dangerous pivot—one that could determine the short-term direction in the days ahead. The structure is unfolding within a clean ascending channel, with both resistance and support levels well respected. These rising boundaries give the breakout credibility, but they also highlight how vulnerable the setup is if key support levels fail.
💎Right now, the level that previously acted as resistance is being tested as support. This is the moment of truth. If the price continues to hold above this level with strength and volume, we’re likely in for a continuation toward the next resistance level around $22.40. But the real test for bulls will come at the $23.00 region, where heavy profit-taking and increased selling pressure are highly likely. That’s where the larger players will look to trap over-leveraged longs and reposition.
💎But this bullish outlook comes with a clear condition and it’s non-negotiable. If #AVAX fails to hold $21.00 and begins closing candles back inside the previous range, the move instantly loses its legitimacy. In that case, our focus turns to the strong demand zone between $20.20 and $20.40. A reaction from this area could still save the structure, offering a potential reload for a bounce. But if this level gives way, the entire bullish setup is invalidated and what was once a breakout turns into a confirmed bull trap.
Trade smart, Paradisers. This setup will reward only the disciplined.
MyCryptoParadise
iFeel the success🌴

AVAX - SetupCurrently in a long swing position on CRYPTOCAP:AVAX
Tp1 + BE : at $26.8 — recent highs
Tp2: at $35.8 — trend reversal area
Tp3: at $39.5 — target region
If you have any questions about my system or trade logic, drop them below — I read every comment 👇

AVAX CLSIn the graph you can see CLS making a huge move down 2 Daily consecutive candles, leaving a footprint.
I have market the move by using fibonacci and marked levels 0,0.5 and 1.
On the graph you can see my entry zone which I will confirm once I get confirmation. As well as partials at 0.5 where I will be taking a percentage of the trade. And full TP at 1.

$AVAX – Key Zone Alert for Potential Breakout📊 CRYPTOCAP:AVAX is testing the descending channel support on the daily timeframe and showing a swift reversal bounce.
🟢 Price is also pressing into the horizontal support zone — a pivotal area that could shape the next major move.
👀 Keep your eyes locked on this level — whether it holds or breaks will likely determine the upcoming trend!
GATEIO:AVAXUSDT


AVALANCHE Avalanche (AVAX) Use Cases in the Crypto Ecosystem and Correlation with Bitcoin Price Movement
Avalanche (AVAX) Key Use Cases
Tokenized Real-World Assets (RWAs)
Avalanche ranks among the top blockchains for RWA tokenization, with over $37.22 million in tokenized assets (e.g., private equity funds, US Treasury bills) as of late 2024 .
Partnerships with institutions like Citigroup and Franklin Templeton highlight its role in institutional adoption .
Decentralized Finance (DeFi)
Hosts $846 million in Total Value Locked (TVL), supporting protocols for lending, borrowing, and decentralized exchanges (DEXs) .
EVM compatibility allows seamless migration of Ethereum-based DeFi apps with faster transactions (2-second finality) and lower fees .
NFTs and Web3 Gaming
Supports NFT marketplaces and gaming platforms, leveraging its scalability for high-throughput applications .
Enterprise Solutions via Subnets
Customizable Subnets enable businesses to build private or public blockchains for specific use cases (e.g., supply chain, identity management) .
AVAX Token Utility
Transaction Fees: Used to pay for gas on the network .
Staking: Secures the network and earns rewards (APR ~8-11%) .
Governance: Holders vote on protocol upgrades and treasury allocations .
AVAX Correlation with Bitcoin (BTC) Price Movement
General Market Sentiment-Driven Correlation
AVAX often moves in tandem with Bitcoin during broader crypto bull runs. For example, AVAX surged 8.46% (to $25.13) on May 22, 2025, as Bitcoin hit a record $111,544 .
Bitcoin’s dominance as a market leader means altcoins like AVAX frequently mirror its trends, especially during institutional inflows .
Divergence Drivers
Ecosystem Growth: AVAX’s unique developments (e.g., RWA adoption, Subnet upgrades) can decouple it from BTC. The Etna Upgrade (reducing fees) and partnerships have boosted AVAX’s standalone value .
Institutional Forecasts: Standard Chartered predicts AVAX could reach $250 by 2029 (1,326% growth), outperforming Bitcoin’s projected 500% rise .
Risk-Adjusted Performance
While BTC remains a "safe haven," AVAX’s higher volatility offers greater upside during risk-on markets but deeper corrections in downturns .
Summary Table
Aspect Avalanche (AVAX) Bitcoin (BTC)
Primary Use Case RWAs, DeFi, Enterprise Subnets Store of Value, Digital Gold
Price Correlation Moderate to Strong (BTC-driven rallies) Market Benchmark
Divergence Factors Subnet adoption, RWA partnerships, upgrades Macro trends, regulatory shifts
2025 Price Target $54.54–$105.79 $500,000 (Standard Chartered)
Conclusion
Avalanche’s use cases in RWAs, DeFi, and enterprise solutions position it as a versatile Layer 1 blockchain with growing institutional adoption. While AVAX often correlates with Bitcoin during market-wide rallies, its ecosystem-specific developments (e.g., Etna Upgrade, Citigroup partnerships) enable periods of outperformance. Investors should monitor both BTC’s macro trends and Avalanche’s on-chain activity to gauge AVAX’s price trajectory.
#BITCOIN #CRYPTO #AVAX

Avax updateUnlikely futures setup didn't take my order only with 7 cent . Let's see how far it can go . So optimist on holding avax in spot bag.nice bullish funda and chart.🙃🥂

avaxWe are going long on AVAX because AVAX is likely to test some key levels around specific dates I’ve identified using Gann analysis. These dates are significant turning points based on time cycles, and we expect price action to respond accordingly. I’ll be closely monitoring the charts and will update you as we approach those levels.
Stay tuned and manage your risk accordingly.

AVAX/USDT Potential UpsidesHey Traders, in today's trading session we are monitoring AVAX/USDT for a buying opportunity around 22.00 zone, AVAX.USDT is trading in an uptrend and currently is in a correction phase in which it is approaching the trend at 22.00 support and resistance area.
Trade safe, Joe.

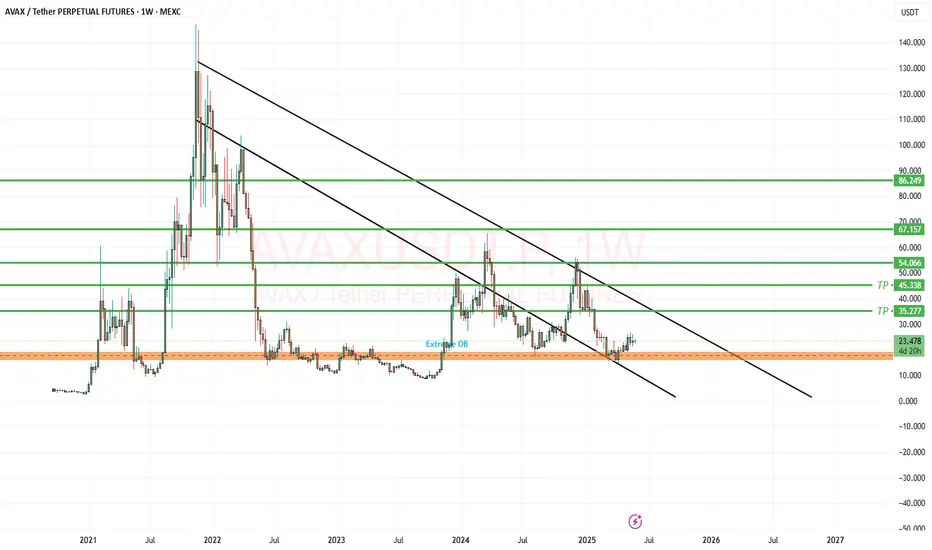
AVAX/USDT (CryptoNation_369)Fibonacci-Based Targeting & Levels
Several Take Profit (TP) levels are clearly marked:
TP1: ~35.277 USDT
TP2: ~45.338 USDT
Further targets:
54.066
67.157
86.249
90.000 (major resistance)
These are likely derived from Fibonacci extensions/retracements off major swing highs and lows:
Key Technical Zones
Zone Type Price Level Notes
OB Support $10–15 Strong historical support
Resistance $30–40 Historically reactive price area
TP Targets $35.3, $45.3 Likely Fibonacci confluence zones
Long-term TP $54, $67, $86–90 Full bullish cycle potential
AVAX/USDT Technical OutlookAVAX/USDT has broken market structure to the upside by forming a confirmed higher high, indicating a potential bullish trend reversal. However, despite this structural shift, the price failed to secure a daily close above the key resistance level at $26.02, leaving the breakout unconfirmed for now.
Currently, the pair is trading marginally above an ascending trendline. Given the present market structure, the most probable scenario involves a liquidity sweep below the trendline — targeting stop-losses from early long positions — before establishing a clean higher low and initiating a strong bullish reversal.
The $22.40 level, which previously acted as resistance, is now serving as key support. As long as price remains above this level, the bullish bias remains intact. However, a temporary deviation below the trendline and a move toward the $19.47 support area would likely represent a classic liquidity grab — designed to shake out weak hands before a sharp move higher.
A confirmed daily close above $26.49 would significantly increase the probability of continued upside momentum, with the next major resistance zone lying between $30.60 and $32.87. This zone remains the primary upside target in the short- to mid-term.

AVAX/USDT#AVAX Spot Strategy 🚀
AVAX is currently at a solid buy zone for spot entries.
The coin is in the top 15 by market cap, which adds fundamental strength.
💡 Recommended DCA approach:
Split your planned allocation into 3 entries — market volatility and manipulations remain high, especially lately.
• Entry 1 — at current price
• Entry 2 — around $15
• Entry 3 — if price drops to the $7–4 zone
This gives an average entry of ~$15, creating strong upside potential.
🎯 Targets:
• Target 1 = $35 (+50% from current levels)
• Target 2 = $45 (+90%)
• Target 3 = $55 (+135%)
📌 Key resistance zone: $30–35
Once reached, we’ll monitor price action + seasonal market behavior.
If momentum supports it, additional entries could be considered in that area.

$AVAX Update – Breakout Retest Play!!CRYPTOCAP:AVAX is respecting the ascending trendline beautifully after a clean retest of the breakout zone.
The price is holding above the trendline, and the 200 EMA is in the 4H timeframe.
Multiple confluences align around the $22.5–$23 zone – a critical support area now flipped from resistance.
Targets are set at:
• 26.81
• 29.47
• 33.40
As long as we hold this support, the upside potential remains strong.

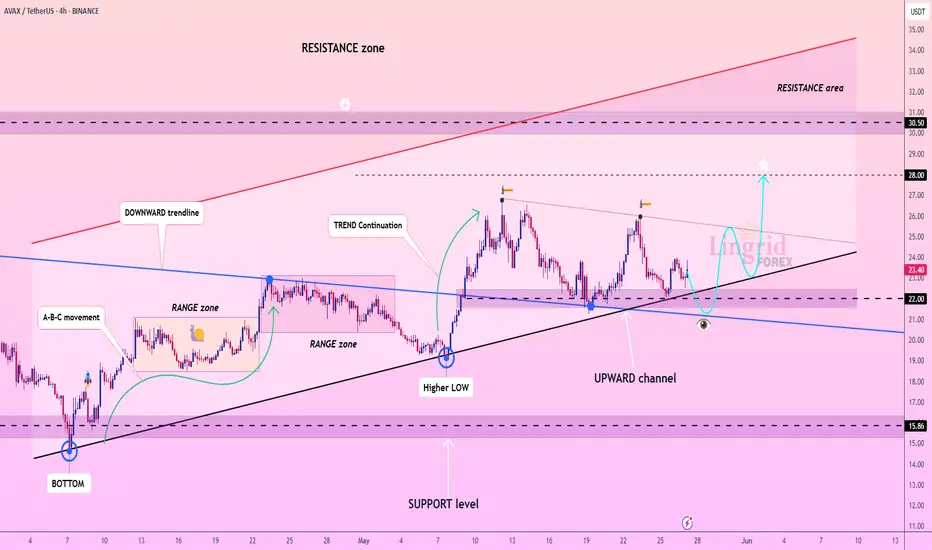
Lingrid | AVAXUSDT Compression Phase Before Upside BreakoutBINANCE:AVAXUSDT is retracing from local highs but remains inside the broader upward channel. Price is nearing the $22.00 support zone, which aligns with the uptrend line and a potential higher low area. If bulls defend this zone and trigger a bounce, we could see a continuation toward $28.00 and possibly higher into the resistance area. However, a breakdown below $22 would shift near-term structure bearish.
📈 Key Levels
Buy zone: $21.50 – $22.00
Buy trigger: bullish rejection from $22.00 with volume
Target: $28.00
Sell trigger: clean break below $21.50
💡 Risks
Crypto market sentiment remains fragile amid macro uncertainties
Failed bounce from $22 could initiate deeper correction
Loss of trendline support would invalidate bullish setup
Traders, if you liked this idea or if you have your own opinion about it, write in the comments. I will be glad 👩💻
TradeCityPro | AVAX: Watching Key Resistance in RWA Uptrend👋 Welcome to TradeCity Pro!
In this analysis, I’ll be reviewing the AVAX coin — one of the popular RWA projects in crypto with a high market cap.
🔍 This coin currently has a market cap of $9.94 billion and ranks 14th on CoinMarketCap.
⏳ 4-Hour Timeframe
As shown on the 4-hour chart, there’s a clear ascending trendline that has been tested several times. There was also a fake breakout below the trendline, and now price is reacting to it once again.
⚡️ A resistance level has formed at 23.90, which the price has reacted to. Given the recent bounce off the trendline, the probability of breaking 23.90 has increased.
✔️ A break above 23.90 offers a potential long entry, though this isn’t the main long trigger. The target for this move would be 25.78. The main long position should be considered after a breakout above 25.78.
💥 The 25.78 zone is a key resistance level that marked the top of previous bullish legs, so breaking it could lead to a strong bullish trend.
🔽 On the flip side, if the price prints a lower high below 25.78 and moves back toward the trendline, the probability of breaking the trendline increases.
✨ If the trendline breaks, the confirmation trigger would be 22.10. A break below 22.10 opens a short setup, with the next support level located at 19.23.
📊 Currently, market volume is favoring the buyers. With renewed buying volume off the trendline, if this momentum continues, the bullish scenario becomes more likely.
📝 Final Thoughts
This analysis reflects our opinions and is not financial advice.
Share your thoughts in the comments, and don’t forget to share this analysis with your friends! ❤️
