AVAXUSDT trade ideas

AVAX🔺Lets GoThe long-term downtrend has been broken and the pullback has been completed, ready to climb?!

Trading opportunity for AVAXUSDTBased on technical factors there is a Sell position in :
📊 AVAXUSDT
🔴 Sell Now
🪫Stop loss 18.10
🔋Target 13.50
📏 R/R 2
💸RISK : 1%
We hope it is profitable for you ❤️
Please support our activity with your likes👍 and comments📝

EASY Trading AI Prediction: Short Opportunity on AVAXUSDTBased on the EASY Trading AI analytical strategy, I'm eyeing a sell signal on AVAXUSDT. Currently, the market indicates notable selling pressure entering at 17.87, putting the short-term target at a Take Profit of 17.58333333, with a protective Stop Loss activated at 18.26333333.Our proprietary algorithm detected overbought momentum and weakening bullish volume at this key price level, signaling a likely downward correction. Strictly follow these parameters to manage your risk effectively.Trade precisely, control risks, and stay profitable.

Possible Scenario for AVAX/USDTPossible Scenario for AVAX/USDT:
1. Price Action: The price is within a descending channel marked by the blue lines. This suggests a bearish trend as the price has been making lower highs and lower lows.
2. Potential Scenarios:
- The **green arrow** indicates a potential bullish scenario, where the price might break out to the upside, aiming toward a target of around $31.84.
- The **red arrow** suggests a bearish scenario, where the price might break down further, potentially testing the lower support level near $11.91.
3. Key Levels:
- **Resistance**: Around the $31.84 level (shown in red), which could be a strong resistance zone if the price attempts a recovery.
- **Support**: Near the $11.91 level (shown in green), which could act as strong support if the downtrend continues.

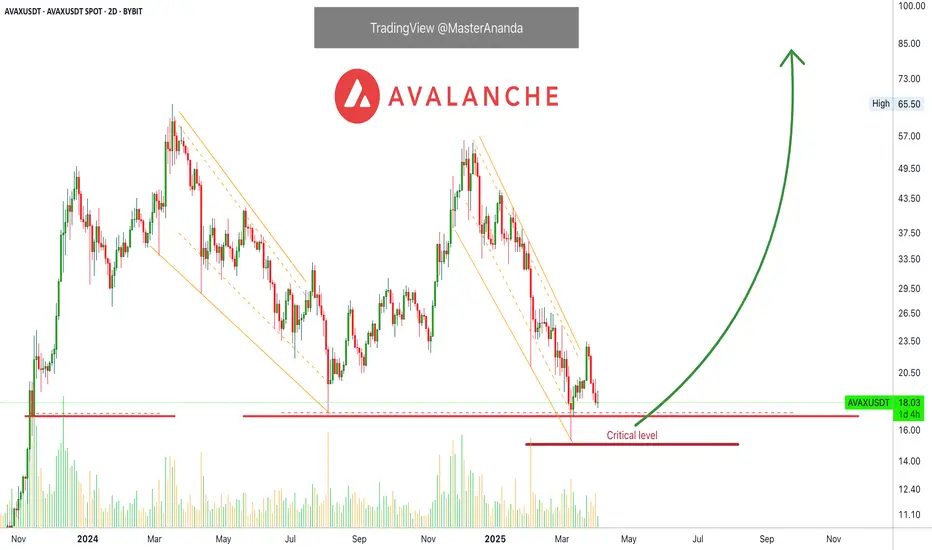
Avalanche's Higher Low Indicates The Bottom Is InAVAX is currently trading above its August 2024 bottom low price, and this is bullish.
AVAXUSDT produced a major low on the 10-March trading session. The current session is a higher low compared to this date. This is a double bullish signal. The August low and last month. Both are active, valid and hold.
So the August 2024 low was actually tested and pierced but the session close happened above this level. The bottom back then was $17.27. In March, AVAXUSDT went as low as $15.30 but closed at $17.51. The next session went below again and hit $16.95 but closed at $18.5. As you can see, the bulls win.
The current session is green after four sessions closing red. Each session has two candles, 48 hours (2D candles).
Here we have the activation of long-term support. Classic behaviour before a major bullish run.
The dynamic is always this: The correction unravels and gains momentum before reaching its end. When it hits bottom, there is a strong reaction causing a sudden bullish jump. This bullish jump is short-lived and quickly corrected. This short-term correction ends in a higher low. From this higher low, prices start a new wave of growth. We are entering this new growing phase now.
Thanks a lot for your continued support.
This is another time based chart.
The time to enter is now, always focusing on the long-term.
We buy now with the patience and mindset to hold between 6-8 months. If this can be done, easy and big wins will be yours.
The 2025 All-Time High potential and more can be found by visiting my profile.
Thanks a lot for the follow. Your support is appreciated.
Namaste.
AVAX DAILY ANALYSISHi friends,
Let's get back into analysis after Eid al-Fitr vacations.
Today, we pay attention to AVAX in the Daily time frame.
As marked on the chart, we have a strong daily resistance trend line and a 4-Hour resistance trend line, which is marked by yellow color. As you can see that we had a great support level of $19.855, which has now turned into resistance.
Also, you can see that for AVAX to retain its bullish momentum, it has to close daily candles above $29. Besides that, we have a strong daily and weekly accumulation area between $12 and $15.
We have a local 4-Hour support level that is ideal for entering into short positions after having the momentum and confirmations.

#AVAXUSDT: Three Swing Buy Take Profit EntriesThe cryptocurrency market has experienced volatility in recent months, particularly with the #AVAXUSDT token. We have identified two potential price reversal points:
1. **Current Price Range:** The market is currently experiencing a surge in volume, indicating a potential reversal.
2. **Liquidity Removal and Reversal:** If the price were to remove liquidity and subsequently reverse at its previous low, it could trigger a significant price drop.
Additionally, we recommend setting three targets based on your analysis to guide your trading decisions.
We extend our sincere gratitude for your unwavering support since the beginning. We anticipate that this support will continue to grow and evolve.
Team Setupsfx_
🚀❤️

#AVAX/USDT Short-term riseHello traders!
There is an upward wave and the price is declining in a correction . I expect a similar upward wave. We have an POI Zone and I expect the wave to start from there.

Avax long term.This is my opinion on Avax.
I think the downward waves are good buying opportunities, while the upward waves after that can be good selling opportunities.
* What i share here is not an investment advice. Please do your own research before investing in any digital asset.
* Never take my personal opinions as investment advice, you may lose all your money.

AVAX Long TriggerAVAXUSDT | Long Trigger Setup 🚀
AVAX is forming a bullish structure on the 15-minute timeframe, respecting an ascending trendline while consolidating near key resistance levels. The price is currently finding support at $18.67, where buyers have stepped in multiple times, indicating demand.
A breakout above $19.06 (previous resistance) could confirm a continuation towards higher levels, with the next major target at $19.79.
🔹 Technical Analysis:
✅ Ascending Trendline Support: Higher lows suggest bullish momentum.
✅ EMA Alignment: Price is interacting with the 7, 25, and 99 EMAs, signaling potential upside if reclaimed.
✅ Volume Analysis: Increasing volume on green candles suggests accumulation.
📊 Key Levels:
🔹 Immediate Support: $18.67
🔹 Breakout Resistance: $19.06
🔹 Major Target: $19.79
🔹 Trendline Support: Holding structure above $18.67
🚀 Long Setup Confirmation:
A break and retest of $19.06 with strong volume could confirm a bullish breakout, targeting $19.79. If buyers step in aggressively, momentum may push even higher.
🔻 Invalidation & Risk Management:
A break below $18.67 with volume could invalidate this setup.
A cautious stop-loss can be placed slightly below $18.67 to manage risk efficiently.
This setup offers a high-reward potential if conditions align, making it a strong long opportunity if executed correctly.
#AVAX #Crypto #Trading #LongSetup #Breakout #TechnicalAnalysis 🚀

AVAX NEXT MOVESell after bearish candle stick pattern, buy after bullish candle stick pattern....
Best bullish pattern , engulfing candle or green hammer
Best bearish pattern , engulfing candle or red shooting star
NOTE: IF YOU CAN'T SEE ANY OF TOP PATTERN IN THE ZONE DO NOT ENTER
Stop lost before pattern
R/R %1/%3
Trade in 5 Min Timeframe, use signals for scalping

SHORT AVAXovergrown ...
ATR ends
we got closing longs
got through point of liquidation and already nobody liquidate

Avalanche AVAX Will Reach $100+ In 2025!Hello, Skyrexians!
Let's make an update on BINANCE:AVAXUSDT the coin with the most clear Elliott waves structure. We have some changes since our last update.
Let's take a look at the weekly chart. We can count the growth from the bottom to the March 2024 top as the wave 1. After that we can see the flat correction ABC in the wave 2. The great sign that price has printed even 2 green dots on the Bullish/Bearish Reversal Bar Indicator inside the Fibonacci 0.61 zone. We expect that for this asset correction is over and the next target is 1.61 extension for the wave 3. Now it's located at $105.
Best regards,
Skyrexio Team
___________________________________________________________
Please, boost this article and subscribe our page if you like analysis!

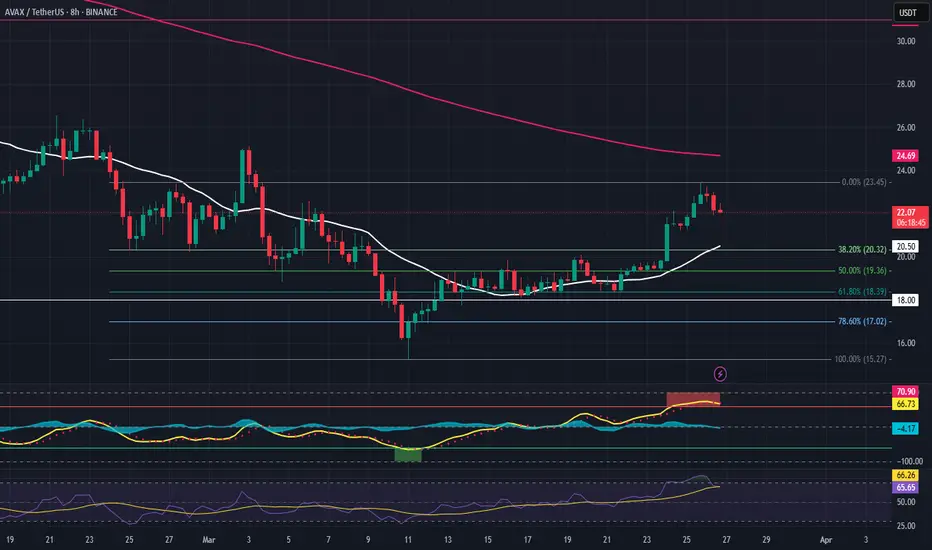
AVAX Is Approaching a Make-or-Break Level — What Comes Next?Yello, Paradisers! Is #AVAX finally waking up after months of bearish slumber, or is this just another bull trap? After moving within a well-defined descending channel for weeks, we are now seeing the first real shift in structure: AVAXUSDT has just broken above its 12-hour EMA convincingly for the first time since November 2024. This development may be a strong early signal of a potential corrective move to the upside.
💎At the moment, #AVAXUSDT is testing a critical resistance at the $23.50 level, which lines up with the descending trendline that has capped price since December 2024. A breakout above this zone would significantly increase bullish momentum, with the next target likely at $27.35 — a key area of moderate resistance that could temporarily halt upward movement.
💎However, $27.35 is not expected to be an easy level to break. Sellers will likely defend this zone, potentially causing short-term volatility. But if bulls manage to flip it into support, the path opens toward the $31.20 to $34.00 region. This higher resistance area is even more significant as it aligns with the 50% Fibonacci retracement level — a major technical barrier where many traders will be looking to take profits or fade the rally.
💎On the downside, AVAX has established a strong support range between $19.50 and $18.80. If this short-term support fails, we then look to the weekly support zone between $16.20 and $15.00, which continues to serve as a long-term base structure. As long as AVAX holds above this broader support, the larger bullish outlook remains intact.
Paradisers, strive for consistency, not quick profits. Treat the market as a businessman, not as a gambler.
MyCryptoParadise
iFeel the success🌴

AVAX triangleAfter a heavy correction halfway through the bullrun, avax pulled back to a bullish trendline.

AVAX Trade Setup - Waiting for Retrace to SupportAVAX has had a strong run over the last two weeks. Now, we're waiting for a retrace to key support before entering a long spot trade.
🛠 Trade Details:
Entry: Around $20.00
Take Profit Targets:
$23.50 (First Target)
$31.00 (Extended Target)
Stop Loss: Just below $18.00
Watching for buying pressure at the support level before confirming the move! 📈🔥
AVAX SHORT SETUP ALL trading ideas have entry point + stop loss + take profit + Risk level.
hello Traders, here is the full analysis for this pair, let me know in the comment section below if you have any questions, the entry will be taken only if all rules of the strategies will be satisfied. I suggest you keep this pair on your watchlist and see if the rules of your strategy are satisfied. Please also refer to the Important Risk Notice linked below.
Disclaimer

AVAXUSDT 1WAVAX ~ 1W Analysis
#AVAX Buy gradually from here if you still have a Conviction on this coin with a short -term target of at least 20%+.

AVAX/USDTHello friends
As you can see, the price has been well supported by buyers from the specified support area...
Now you can buy in steps with capital and risk management and move to the specified targets.
The red resistance area can also cause a price correction, so be careful and take profit.
*Trade safely with us*

avax buy limit midterm "🌟 Welcome to Golden Candle! 🌟
We're a team of 📈 passionate traders 📉 who love sharing our 🔍 technical analysis insights 🔎 with the TradingView community. 🌎
Our goal is to provide 💡 valuable perspectives 💡 on market trends and patterns, but 🚫 please note that our analyses are not intended as buy or sell recommendations. 🚫
Instead, they reflect our own 💭 personal attitudes and thoughts. 💭
Follow along and 📚 learn 📚 from our analyses! 📊💡"

Hidden Bullish Setup on AVAX – Just Revealed !Hello Traders 🐺
In this idea, I want to talk about one of the top altcoin projects in the crypto space—AVAX. If you’ve been around, you probably know the name... but here’s why I’m bullish on it right now: 🔥👇
✅ 1. Massive Weekly Triangle Pattern
On the weekly timeframe, AVAX is already inside a huge triangle formation, which—if it breaks out—could push the price to at least its previous ATH (~$165). If you enter now, that’s potentially a 750% profit! 🚀💰
I’ll go deeper into this long-term price target in a future idea, because this move still needs to break the weekly resistance—and there are multiple resistance levels along the way. But for now, we’re focusing on the immediate short-term setup. ⚠️📈
✅ 2. Repeating Price Patterns Inside the Triangle
Inside this gigantic triangle, AVAX price tends to repeat a similar structure each time:
The first pattern was made of converging trendlines → breakout → strong pump to the triangle’s top.
The second setup was a falling wedge → breakout → same explosive move.
👉 And now guess what? We have another bullish channel, and it’s currently breaking out as we speak! ⛓📉➡️📈
So make sure to act accordingly and keep your eyes on the chart! 👀🔥
and always remember :
🐺 Discipline is rarely enjoyable , but almost always profitable 🐺

AVAX / AVAXUSDT | 1H | Avax will be the rocketHey there;
I have prepared avax analysis for you. All I ask from you is to support this analysis with your likes.
My Avax target level is 22.62 and my stop level is 17.37.
This analysis has a win rate of 2.00
Guys I will update this analysis under this post
Now let's just follow this analysis and see if my analysis is correct or not.
Thank you very much to everyone who has been kind and supported me with their likes.
Thanks to your support, I am constantly preparing special analyzes for you.
I love all my followers very much.
