Is #AVAX Making Much Needed Comeback or Another Bull Trap Ahead?Yello, Paradisers! Is #AVAX on the verge of a major breakout, or is this just another bull trap? Let's look at the latest setup of #Avalanche:
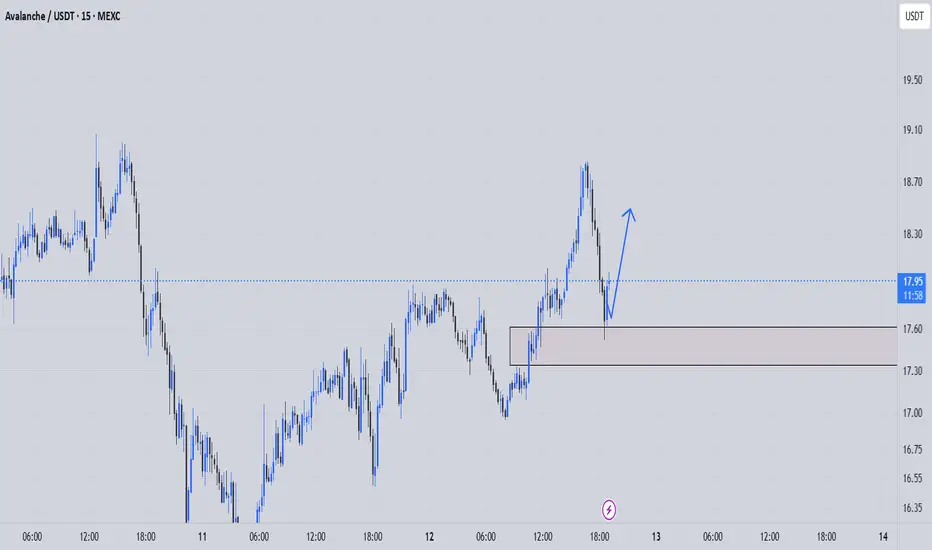
💎#AVAXUSDT has been stuck inside a falling wedge for weeks, respecting both the descending resistance and descending support levels. However, bulls have finally pushed through the upper trendline, signaling a potential shift in market sentiment. The question now is: will it sustain the momentum, or will we see a sharp rejection at key resistance levels? AVAX has been stuck inside a falling wedge for weeks, the breakout shows a high probability of an impulsive move toward the highlighted zones.
💎The immediate support to keep an eye on sits around $18.38, a level that could act as a strong demand zone if retested. Below that, $16.61 serves as a critical invalidation level for the bullish setup. A breakdown here would shift the momentum back in favor of the bears.
💎On the upside, #AVAX faces its first major challenge between $23.00 and $26.00, where sellers are likely to step in. A clean breakthrough of this zone would open the door for a more aggressive rally. RSI & Volume Confirmation – The RSI is showing early signs of strength, but volume confirmation is still needed. A strong push above the resistance zone on high volume would solidify the bullish breakout.
💎If #AVAXUSD can flip $18.38 into strong support, we could see an impulsive move toward the $23-$26 range. However, a failure to hold support could result in a bearish breakdown toward the $14 region.
The market rewards discipline and patience—trade smart, Paradisers!
MyCryptoParadise
iFeel the success 🌴
AVAXUSDT trade ideas

AVAXUSDT Testing Key Resistance Amid Bearish Market OutlookAVAXUSDT has been steadily climbing after rebounding from a crucial support level and is now testing last week's high, a level that has repeatedly held firm. Additionally, the price continues to respect the established upward trendline. However, on higher timeframes, the overall market sentiment remains strongly bearish, with prices falling below the August 2024 low. Given the significant downward movement, a period of consolidation is likely. A rebound from the psychological level at 20 is anticipated, followed by a retest of the support zone around 17.05

Lingrid | AVAXUSDT reached WEEKLY high. ShortThe price perfectly fulfilled my previous idea . It hit the target level. BINANCE:AVAXUSDT has gradually climbed higher after bouncing off a key support level and is currently testing the previous week's high, which has been respected multiple times. Furthermore, it continues to respect the upward trendline. However, on higher timeframes, the market remains heavily bearish, with prices dipping below the August low of 2024. Following such a significant bearish movement, the price will likely consolidate for a period. I expect a rebound from the psychological level at 20, followed by a retest of the support level. My goal is support zonearound 17.05
Traders, If you liked this educational post🎓, give it a boost 🚀 and drop a comment 📣

avax sell midterm "🌟 Welcome to Golden Candle! 🌟
We're a team of 📈 passionate traders 📉 who love sharing our 🔍 technical analysis insights 🔎 with the TradingView community. 🌎
Our goal is to provide 💡 valuable perspectives 💡 on market trends and patterns, but 🚫 please note that our analyses are not intended as buy or sell recommendations. 🚫
Instead, they reflect our own 💭 personal attitudes and thoughts. 💭
Follow along and 📚 learn 📚 from our analyses! 📊💡"

AVAXUSDT Breakdown Alert – Are Lower Lows Coming Next?Yello, Paradisers! Is AVAXUSDT gearing up for a bigger drop? Let’s break it down.
💎AVAXUSDT has turned bearish after breaking below its key support trendline. A Change of Character (CHoCH) confirms the shift to the downside, and right now, the price is rejecting from a critical 4H Fair Value Gap (FVG) and the 200 EMA resistance zone. Adding to the bearish pressure, we also see a 4H bearish divergence, making a downside move highly probable.
💎Moreover, AVAXUSDT is in the process of forming a Head & Shoulders pattern, which increases the risk-to-reward (RR) potential for short trades. On top of that, there’s liquidity resting below, which could act as a magnet, pulling the price further down.
💎However, if the price breaks out and closes a candle above the 200 EMA resistance zone, this bearish outlook will be invalidated. In that case, it’s better to wait for clearer price action before making any moves.
🎖Patience is key, Paradisers. Stick to the strategy, avoid emotional trading, and let the market come to you. The best setups will always present themselves to those who wait!
MyCryptoParadise
iFeel the success🌴


BULLISH SCENARIOI'm currently tracking a possible ABCD Bullish Harmonic pattern for AVAX. A possible bounce around $7 region filling those imbalances.

$AVAX 3D BULLISHif this holds (i.e., week closes green, volume stays green and above average), this looks pretty bullish.

avax long midterm "🌟 Welcome to Golden Candle! 🌟
We're a team of 📈 passionate traders 📉 who love sharing our 🔍 technical analysis insights 🔎 with the TradingView community. 🌎
Our goal is to provide 💡 valuable perspectives 💡 on market trends and patterns, but 🚫 please note that our analyses are not intended as buy or sell recommendations. 🚫
Instead, they reflect our own 💭 personal attitudes and thoughts. 💭
Follow along and 📚 learn 📚 from our analyses! 📊💡"
AVAX Breakdown Incoming? Key Levels to Watch Now!Yello, Paradisers! Is AVAXUSDT about to take another dive, or are the bulls finally ready to step in? Let’s break it down!
💎#AVAXUSDT remains firmly in a downtrend, struggling to gain bullish momentum while continuously rejecting key supply zones. Recently, the price tapped into the imbalance zone around $21.5, but sellers smacked it right back down a clear sign that bears are still in control.
💎Adding to the bearish case, a descending trendline and moving averages are acting as resistance, keeping price action suppressed. The structure continues to form lower highs and lower lows, reinforcing downside momentum.
💎If Avalanche retests the $22.5 supply zone and faces rejection, another leg down toward $18.956 is likely, with the next major support sitting at $17.523. Right now, if the price closes below the 50 EMA, there’s a strong probability it will directly target our projected support levels. A failure to attract strong buying interest at these levels would confirm further downside continuation.
💎However, if AVAX manages to break through the $22.5 supply zone, our focus shifts to the next major resistance at $24.136. A breakout above this level with strong volume could invalidate the bearish setup, potentially pushing price toward $24 - $25. A confirmed move past $24.136 would shift momentum bullish, opening the door for a rally toward $26 and beyond.
Stay sharp, Paradisers! The market rewards patience and discipline. If we get confirmation, we act. If not, we wait. Trade smart, not fast! 🎖
MyCryptoParadise
iFeel the success 🌴

Avalanche (avax)Avax usdt Daily analysis
Time frame daily
As you see on the chart , if decrease of avax stops on 17.5 $ the pattern (double bottom)will create.
So we will see the end of decreasing and avax will reach to 25$
On the other hand , if price breaks down and reach 15 EURONEXT:OR less , this pattern will failed

Avax short to $20 or lowerJust now I opened as short position on avax. It might push back up a bit to my entry...might not.
Targeting $20 or a bit lower looks primed to drop

AVAX/USDT: BIG CHANCEHello friends
As the price reached a resistance area, we witnessed a double top pattern that caused the price to fall.
Now the price has been able to recover by reaching a strong support area and with the continued power of buyers, you can buy within the specified ranges and we have also specified targets for you.
*Trade safely with us*

Avalanche AVAX price analysis It's been a long time since we've had an analysis of CRYPTOCAP:AVAX
Well, we're sorry.... but inform you that OKX:AVAXUSDT price is now in a potential buying zone.
The main thing is that the price of the #Avalanche token does not fall much below $20
And the growth potential is the same as six months ago - at least up to $45-50
_____________________
Did you like our analysis? Leave a comment, like, and follow to get more

AVAX/USDTAfter working with liquidity, a daily IFVG has formed. If it holds the price, this will be a good long continuation, with growth targets as follows:
Target 1 = 25.11
Target 2 = 28.77

Lingrid | AVAXUSDT short Opportunity at DAILY High LevelBINANCE:AVAXUSDT market has been consistently making lower lows within a downward channel. The market recently formed a consolidation zone before breaking through it, reaching yesterday's high level. On the daily timeframe, the trend is still making lower lows, and on Tuesday, it closed below the significant psychological level of 20.00. I think the market may continue to test this 20.00 level, especially since it has recently bounced back above it forming ABC pullback, which typically signals a continuation afterward. There is also a possibility that the price could reach middle of the range zone below. My goal is the support zone around 20.50.
Traders, if you liked this idea or if you have your own opinion about it, write in the comments. I will be glad 👩💻

AVAX at a Critical Support Level: Next Move Incoming
The BINANCE:AVAXUSDT COINBASE:AVAXUSD chart on the 1W timeframe is at a crucial decision point as it tests the $22 support level, a key area where price previously bounced. The strong wick rejections suggest buying interest, but the price remains within this range, meaning a breakdown is still a possibility.
If $22 holds, a long position targeting $38 offers a favorable risk-to-reward ratio of more than 1:3. For confirmation, traders might wait for a swing high formation, followed by a break to the upside, signaling renewed bullish momentum.
However, if $22 fails, the next significant downside target sits at $10, marking a major support zone where buyers could step in for a deeper accumulation phase.
This setup presents both bullish and bearish scenarios, making it a high-stakes area to watch.
👨🏻💻💭 Will AVAX defend $22 and push toward $38, or is a drop to $10 on the horizon? Share your thoughts and let’s discuss the next move!
__
The information and publications within the 3Commas TradingView account are not meant to be and do not constitute financial, investment, trading, or other types of advice or recommendations supplied or endorsed by 3Commas and any of the parties acting on behalf of 3Commas, including its employees, contractors, ambassadors, etc.

Lets sell AVAX now.AVAX need big short now.
Entry :23.646
TP1 :23.41
TP2 :23.173
TP3 :22.937
Stop Loss:23.882
Lets sell together!
BINANCE:AVAXUSDT.P

Avalanche: Long-Term Bullish Above Support & Other SignalsThe end of February didn't do much harm to Avalanche, which is a bullish signal. In early February, the lowest price hit was $21, in late February the lowest price was $20. The difference is only 5%. This small gap between these lows indicate that the bearish force is over.
Let me explain. There was a low on the 13-January session at $32, the low in February was $21. That's a big gap.
For a new low to be considered of any value from a technical standpoint, the minimum, after the $21 low, would be $17 or much lower around $9 or $8. When we get $21 first followed by $20, we are simply looking at a double-bottom. A double-bottom is a bottom pattern and tends to lead to a trend reversal.
The next little fact that is of interest to us, Cryptocurrency bulls, is the existence of a long-term support, on this chart labelled as "baseline." A lower low as mentioned above would require a break of this level. This is highly unlikely.
Well, let's not go too deep into this type of technical analysis, let's consider a different perspective.
In late 2023 after a strong period of sideways with a downward bent, a complex correction, AVAXUSDT moved to produce a 5-up waves bullish impulse. As this impulse ended, we have the same dynamics as before, between January and November 2023, a long complex correction.
The action that AVAX has been witnessing since March 2024 is all part of a correction in Elliott Wave Theory terms. Once this correction is over, we will have a new bullish wave. This bullish wave tends to develop in five steps. Three steps forward and two backwards. The 2025 bull-market. This impulse will end in a very strong new All-Time High.
This is simple technical analysis and it will end up being right.
Do you agree?
If you do, make sure to show your support by following me.
2025 is going to be big. It will be big. Trust.
Patience is key.
The worldwide adoption of Cryptocurrencies as a means of payments will result in world peace.
Namaste.

Avalanche (AVAX): The Next Big Reversal Opportunity?Hello,
AVAX has been consolidating around a strong support zone, with historical price action indicating a high probability of reversal from this level. A break above key resistance at $26 could confirm the trend shift.
Waiting for breakout.
Regards,

AVAX getting support on previous bottom?AVAX is back revising bottoms. If the price doesn't use it as support it is likely to see the price extend to lower levels. Momentum is oversold which is the ideal time to spot divergences and pivot structures.

AVAX/USDTThere is a liquidity removal from the bottom of the consolidation, on lower timeframes there is a structural break to the long, with the target being the upper range, and I would like to see a breakout from it.
Target 29

AVAXUSDTThe $17 price floor is important for the symbol. If the price breaks above the dotted trendline shown on the chart, we can expect wave D to begin.If it loses $17, the second scenario will be activated.
