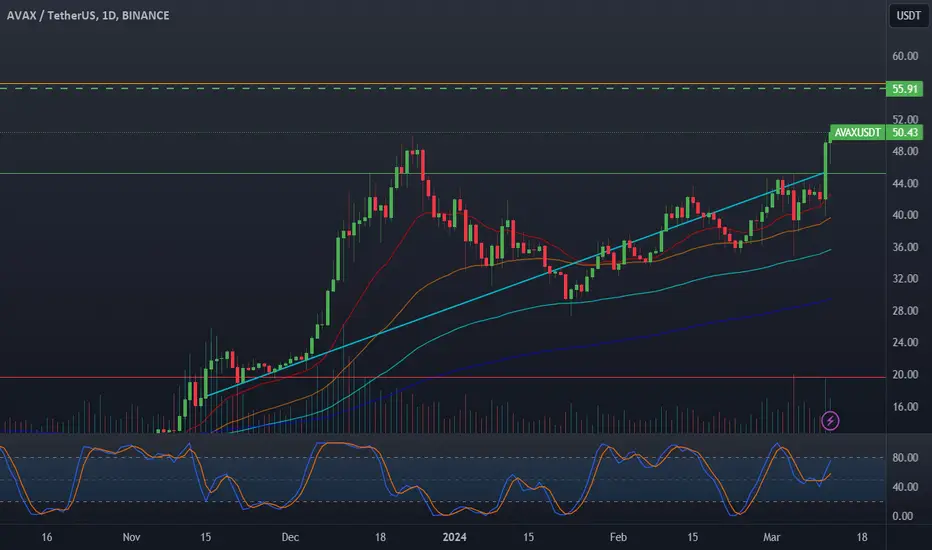
AVAX: Approaching ResistanceTrade setup : Price is in an uptrend. Following a bullish break above $43 key level, price has reached our near-term target of $50 for a +15% gain. This is where price got rejected in late 2023, which makes it a significant resistance level. Now we look for the right entry opportunity in Uptrend. We wait for price to either 1) break above $50 to signal continuation of uptrend, with + 30% upside potential to $65 next, or 2) pull back near $43 support for another swing trade entry in Uptrend with +15% upside potential back to $50.
Trend : Uptrend across all time horizons (Short- Medium- and Long-Term).
Momentum is Bullish (MACD Line is above MACD Signal Line and RSI is above 55).
Support and Resistance : Nearest Support Zone is $35 (previous resistance), then $25. The nearest Resistance Zone is $40 - $43, which it broke, then $50 and $65.
AVAXUST trade ideas

Avax breaks 50$At long last, avax is once again testing 50$, the token had a nice run back to momentum trend and claimed yet another fib with conviction. The dashed green is the next area of relevant price history.
-Short term 55$
-Medium term 70$ at the next fib
-I still expect 250-400$ this cycle
AVAX LONG Future ForecastHello friends,
With Bitcoin breaking its all-time high, we are on the verge of entering a mega bull season. While Bitcoin has led the bull run so far, and although the altcoin market has shown some upward movement, it's premature to say that the altcoins' rally has begun. I believe the real surge for altcoins will start from today onwards. AVAX, which has shown strong performance even during the pre-ATH bull season, I anticipate will continue its performance more efficiently in the coming days.
Looking at the situation technically, in the short term, we are within a cup and handle formation, and we have reached our initial target of (50.03$). If we break the target resistance, the RSI on the 4-hour and daily charts will turn into overbought territory from the 70 levels, and according to the formation, our next target will be 59.20$, triggering overbought conditions on the daily chart and initiating a new daily uptrend wave. Easily, we will reach our current resistance levels (79.91$, 99.42$, 127.38$) and then ATH (148$) levels.
Stay tuned for more gains, my friends!
Wishing you all profitable trades.

$AVAX: BREAK THE BOX Until we don't break the box, I remain undecided.
AVAX stayed in this box for some moments, let's see if the momentum of BTC will help Avalanche to go up...


Here I buy Avalanche at $47Now it's Avalanche Time
Just bought Avalanche at $47
I'm dividing all my money into all the large caps.
And now that I bought CRYPTOCAP:AVAX at $47 you know the drill
This thing won't be under $40 anytime soon and the road to 2 digits will be built from this single buy.
Avalanche is an umbrella platform for launching decentralized finance (DeFi) applications, financial assets, trading and other services. It aims to be something of a global assets exchange, allowing anyone to launch or trade any form of asset and control it in a decentralized manner using smart contracts and other cutting-edge technologies.
See up there.

AVAX ABC Correction PlaybookAVAXUSDT has recently encountered a formidable psychological barrier at $50, coinciding precisely with the 661.8% Fibonacci retracement level. This alignment presents an opportune profit-taking level for buyers, suggesting a potential shift in market sentiment. Traders could be inclined to initiate short positions on AVAX, possibly giving rise to an ABC corrective pattern in line with the Elliott Wave theory.
The critical factor to monitor is the adherence to the $50 level. As long as this psychological resistance holds, it signals a preparation for a robust C-Wave down, indicative of a corrective move in the broader market. Staying vigilant around this key level will provide insights into potential developments and opportunities in AVAXUSDT's price action.

AVAXUSDT Cup and Handle PatternLooks like AVAX is ready to pump!
Easy 60+ Target with Cup and Handle Pattern

AVAX: Resistance BreakoutTrade setup : Price is in a clear uptrend and broke above $43 to signal continuation of uptrend, with +15% upside to $50 next. Stop Loss (SL) level at $37.
Trend : Uptrend across all time horizons (Short- Medium- and Long-Term).
Momentum is Bullish (MACD Line is above MACD Signal Line and RSI is above 55).
Support and Resistance : Nearest Support Zone is $35 (previous resistance), then $25. The nearest Resistance Zone is $40 - $43, then $50 and $65.

Avalanche is ready for the next stage The accumulation phase of Avax has just ended
If he defeats the last resistance, he will go to the unknown land
Goodluck
#AVAX

Cryptolean Avalanche AVAX Update After a fast bearish dip to the key daily support at $37 and 100-Day Moving Average, Avalanche recovered strongly and now is trading in the bullish territory, holding the current daily support at $41.65.
A bullish move from $41.65 towards the previous local high and the key daily resistance zone of $47-$49 is very likely.
The AVAX price action with this zone will be very important.
A bearish dip to below $41.65 will result in AVAX price declining to re-test $37 and an interaction with the minor support at $39.5.
The AVAXUSDT 4-Hour chart is trying to re-claim $42.87.
A bullish move from its current price location is likely and will push #Avalanche to the key intraday resistance zone of $46.76-$48.26.
A bearish dip to below$42.87 towards $41.21 or, even better, to $39.57 and a bullish rejection of one of these levels could offer a long trade towards $46.76-$48.26 and higher.
AVAX will follow $BTC. A strong bearish rejection of $69,654-$73,422 in the BTCUSD daily chart will lead to the weakness of the whole #crypto market and AVAX won't be an exception.
Like once read.
Thank you!

Ascending Reversal PatternOn the weekly timeframe the support area marked by the blue box plays a key role in supporting the price and initiating a growth phase. After the price approached this support area, we witnessed a positive market reaction and the start of an upward trend. During this uptrend, the price reached the orange-colored resistance box, which had been previously identified as a major obstacle to price growth. However, the market managed to break through this resistance level and move beyond it.
The formation of bearish candles on the chart, indicating a correction and pullback to the broken level, is considered a natural part of the upward trend cycles. This pullback serves not only as a correction phase but also as a setup for the formation of an ascending reversal pattern.
With the completion of the pullback and the emergence of signs of an ascending reversal pattern, it is anticipated that the AVAX price in this timeframe will experience significant growth. The price is expected to move towards the next resistance area, previously set as the next target
Enjoyed the analysis? Don’t forget to hit like, drop a comment with your thoughts, and share it with your friends.

AVAX buy setupThe price is fluctuating within a large range.
Considering iBOS and iCH and liquidity pools at the top of the range, we can expect this demand to work well.
By maintaining the demand range, it can move towards the supply side.
Closing a daily candle below the demand zone will violate the analysis
Note that the financial market is risky, so:
Do not enter any position without confirmation and trigger.
Do not enter a position without setting a stop.
Do not enter a position without capital management.
When we reach the first TP, save some profit and try to move the stop continuously in the direction of your profit.
If you have any comments please post them, comments will help us improve our performance
Thanks

Bullish Cup and Handle Pattern in AVAX/USDTThe AVAX/USDT pair has formed a bullish cup and handle pattern, which suggests that the price is likely to continue its upward trend. The target price for the cup and handle pattern is 60$. The cup and handle pattern is a reliable bullish pattern, and it has a high probability of success. However, it is important to note that no technical analysis pattern is 100% accurate.

Avaxusdt 1D (A battle between cows and bears)Hello friends, I hope you are doing well, you can see the daily avax currency chart. In case of the exit from the triangle and the victory of the bulls, the goals have been determined, and in the case of the defeat of the bulls, he has an important and valid support in front of him, which he has reacted to several times

AVAX NEW ATH on the Way
Dont miss the AVAX Rally , it will Pump hard
DCA from here and Chil for new ATH
Copy Spot trading are available now in bitget with 100 % win rate so far , seats are limited , lets make Money
BitcoinJumber

Avax Push To 45Not FInancial advice.
Just have been keeping an eye on avax for quit some time and have gotten into two positions.
My plan is to keep compounding on Margex and keep entering bigger trades as i collect some profits going up. This is super risky but I'm just trying something new out. Follow my Crypto journey because I'm excited.
Position 1: 40.29
Position 2: 41.48
Tp 1 was 42.05
Tp 2 was 43.70
Tp 4 is gonna be 44.73
tp 5 is 45

#AVAX/USDT#AVAX
The price is moving in a descending channel on the 12-hour frame
We have a commitment to the limits of that channel
Now we have a breakout of the downtrend
We have buying momentum on the MACD indicator
Entry price is 36.29
The first goal is 37.96
The second goal is 40.78
Third goal 43.59

AVAXUSDT.PHi guys Another personal analysis
I expect the upward movement to the previous high according to the structure
Check it yourself, thanks

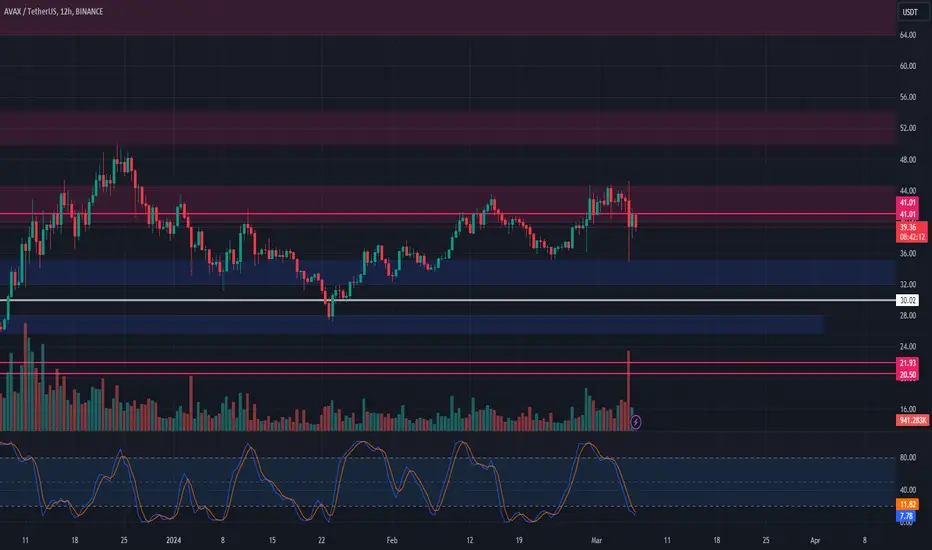
🔄 AVAX Spot Trade: Setting Up Within Support Zone! 📈💹📊 Analysis:
Spot Trade: Initiating a spot trade on AVAX.
Support Zone: Ladder into the trade in the $32 - $35 support area.
Resistance Levels: Target profit at $50 - $54 or $65 - $72.
Risk Management: Set a stop loss just below $30.00.
🌐 Note: Exercise caution during entry, especially regarding potential downside wicks. It's advisable to wait for price stabilization before entering.
$AVAX #AvalancheAVAX/USD (Avalanche) formed an ascending triangle. I'm expecting another leg up after a proper breakout through this resistance zone.

AVAXUSDTHi guys
Provided that the resistance range of $44.88 is consumed, the possibility of continuing the upward trend in the medium term is strengthened. The price area of $27.9 is a low-risk area for spot buying, provided that the resistance range is consumed.
What do you think?

AVAX: A good one? What about short term?
AVAX emerges as one of the major projects, demonstrating strength in its initial movement and showing ample support. There seems to be a lot more in store, in my opinion. Of course, this is not investment advice. it's important to continue monitoring the market closely and making informed decisions. Feel free to comment. Thank you
