Be Prepared For Bitcoin To Go PARABOLIC MartyBoots here. I have been trading for 14 - 15 years and I am here to share my ideas with you to help the Crypto space.
Bitcoin & ALT Coins are Setting up for a HUGE bounce and we in CryptoCheck intend to make lifechanging money
------------------------------------------------------------------------------------------------------------------------------------------------------------
If you want help trading Bitcoin or any other ALT coins hit me up , We will improve your trading . Have a look at the link below
------------------------------------------------------------------------------------------------------------------------------------------------------------
AVEUSD trade ideas

AAVE POSSIBLE TARGETS*************************************
Market Structure Alignment
AAVE
M = B
W = B
D = B
H4 = B
H1 = BR
M15 = BR
M5 = B
M1 = B
**************************************
BIASES:
BB = Bullish BIAS
BRB = Bearish BIAS
****************************************
CODES:
b = Bullish
bg = Bullish Range
br = Bearish
brg = Bearish Range
****************************************
Bimb = Buyers IMBalance
Simb = Sellers IMBalance
****************************************
Boms = Break of Market Structure
Bboms = Bullish Break of Market Structure
Brboms = Bearish Break of Market Structure
****************************************
DZ = DemandZONE
SZ =SupplyZONE
************************************
H = High
HH = HigherHIGH
HL = HigherLOW
L = Lower
LL = Lowbrow
LH = LowerHIGH
*************************************
POI = Point Of Interest
IMB = Imbalance
IC = Institutional Candle
MIT = Mitigation
*************************************
Black = Monthly
Red = Weekly
Green = Daily
Yellow = H4
SkyBlue = H1
NavyBlue = M15
Pink = M5
Purple = M1
Orange = Alerts
************************************

Market Structure Alignment AAVE**************************************
Market Structure Alignment
AAVE
M = B
W = B
D = B
H4 = B
H1 = BR
M15 = BR
M5 = B
M1 = B
**************************************
BIASES:
BB = Bullish BIAS
BRB = Bearish BIAS
****************************************
CODES:
b = Bullish
bg = Bullish Range
br = Bearish
brg = Bearish Range
****************************************
Bimb = Buyers IMBalance
Simb = Sellers IMBalance
****************************************
Boms = Break of Market Structure
Bboms = Bullish Break of Market Structure
Brboms = Bearish Break of Market Structure
****************************************
DZ = DemandZONE
SZ =SupplyZONE
************************************
H = High
HH = HigherHIGH
HL = HigherLOW
L = Lower
LL = Lowbrow
LH = LowerHIGH
*************************************
POI = Point Of Interest
IMB = Imbalance
IC = Institutional Candle
MIT = Mitigation
*************************************
Black = Monthly
Red = Weekly
Green = Daily
Yellow = H4
SkyBlue = H1
NavyBlue = M15
Pink = M5
Purple = M1
Orange = Alerts
************************************

AAVE Targets for Sept/OctLook for Defi to do big things this fall. I'm anticipating AAVE to perform better vs ETH than it has in the past and looking to these fibs as targets.

AAVE Momentum Play AAVE is advancing from a double-bottom with a confident right wall, already passing the 1.272 Fibonacci level. I've collected a 4.27% gain in a day since putting it on the books at 386.5 on 8/31. Now we just sit back and let it play out. Prognosis: I'm expecting either a possible correction back to the neckline, a reconsolidation along the 1.272 or possibly even the .618 if it climbs higher. Sideways action is normal for these Adam & Eve/DB type set-ups, so be ready to take profit or bail depending on the VSA. As long as demand is strong I'm holding on and anticipating more advances after the retests conclude.
*Fulltime Wyckoffian VSA crypto swing trader since 2017. I regularly seek out the most lucrative swings on all the major exchanges.
All my charts are clean, straightforward, and easy to follow. No junk, no needless indicators, just solid volume spread analysis ( VSA ) and 'take-the-money-and-run' Fibonacci target zones.
I go after the runners and big money. My win rates are between 80-85%. Follow me on TradingView and see for yourself.
I review over 300 coins & tokens daily and handpick all the runners myself (no bot signals).
** Not financial advice. Trade at your own risk.

AAVE - Testing SupportAave is sitting on support rn. I think this is a good spot to start buying.
Aave is one of the best projects in DEFI. Patience will be rewarded

Aave getting some loveAave looking good, just broke up on the rsi trend it was in. Could be related to the cgld (celo) pump today. Volume is picking up, may get a nice pump today.

AAVE on possible strong support showing a trend chageNews have been positive developments on twitter, if the market moves in converse to the us indexes a test of the 50% retracement is possible. In lower time frames 1 hour, MACD has been converging and ema's are being pushed with a confirmed cup and handle.... #BuYThEdIp buy the dip and break the emas. most recent news "A proposal has been created to test a cross-chain governance workflow in which Aave governance controls and updates a mock Aave market deployed on Polygon." -AAVE

VWAP bounce - $AAVEDefi summer continuation into EOY - bullish on $AAVE and could lead the crypto market up


Aave AAVEUSDT - Road to 5000 USD + 1000% gains!- Aave is an Open Source and Non-Custodial protocol to earn interest on deposits and borrow assets.
- Current rank 30 on coinmarketcap + Volume 24h $651,835,502.
- This is my Elliott wave count - we are currently in the next Impulse wave to the upside!
- Next target is 1:1 trend-based fib extension for next Elliott wave.
- For expected duration of the trade, probability, stop loss, profit target, entry price and risk to reward ratio ( RRR ) - please check my signature below ↓
- If you want to see more of these ideas, hit "Like" & "Follow".

AAVE/USD Possible Long TargetsFTX:AAVEUSD I'm a nub and still flexing new charting skills, so take with a grain of salt .
If you have time, please let me know how wrong or right I am in my methods. Thanks! AAVEUSD


Watch AAVE. The price is in between. Support lineWell, look at the chart. If it breaks the support line price goes down to $300, if not - goes to $580
What do you think? COINBASE:AAVEUSD

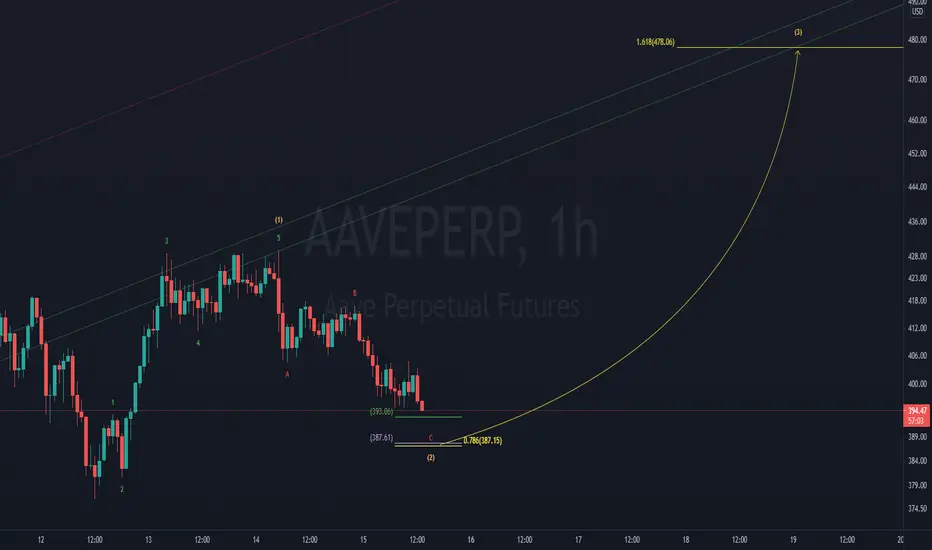
aave w3 setupi think just like btc and eth, aave is primed for a rip to the upside in the days ahead.
after a clean 5 wave move up, it's retracing wonderfully and algorithmically.
once this wave C is in between 393~387, i anticipate a wave 3 impulse which should take it to 478 in the week ahead.
wave 2 target = 387
wave 3 target = 487
Aave AAVEUSDT - Impulse Elliott wave + 1000% gains!- Aave is an Open Source and Non-Custodial protocol to earn interest on deposits and borrow assets.
- Current rank 27 on coinmarketcap + Volume 24h $651,835,502.
- This is my Elliott wave count - we are currently in the next Impulse wave to the upside!
- Next target is 1:1 trend-based fib extension for next Elliott wave.
- For expected duration of the trade, probability, stop loss, profit target, entry price and risk to reward ratio ( RRR ) - please check my signature below ↓
- If you want to see more of these ideas, hit "Like" & "Follow"

Aave (AAVE) - August 9Hello?
Welcome, traders.
By "following", you can always get new information quickly.
Please also click "Like".
Have a nice day.
-------------------------------------
(AAVEUSD 1W Chart)
If the price holds above the 206.817161 point, it is expected that the uptrend will continue.
(1D chart)
If the price holds at the 315.356387-419.933 section, we expect it to move up to the 419.933-472.221304 section and re-determine its direction.
Accordingly, it must rise above the 472.221304 point to continue the uptrend.
If it falls in the 300.459751-315.356387 section, you can touch the 158.491471-210.779774 section, so Stop Loss is required to preserve profit and loss.
-------------------------------------
(AAVEBTC 1W chart)
If the price holds above the 0.004956-0.005734 range, we expect the uptrend to continue.
(1D chart)
If the price holds in the range 0.007364-0.009798, I would expect it to move up to the range 0.009798-0.011016 and re-determine.
Accordingly, to continue the uptrend, it must rise above the 0.011016 point.
If it goes down, you should check to see if it finds support in the 0.006650-0.007865 range.
If it falls from the 0.006650 point, you can touch the 0.003712-0.004930 section, so you need Stop Loss to preserve your profit and loss.
------------------------------------------
We recommend that you trade with your average unit price.
This is because, if the price is below your average unit price, whether it is in an uptrend or in a downtrend, there is a high possibility that you will not be able to get a big profit due to the psychological burden.
The center of all trading starts with the average unit price at which you start trading.
If you ignore this, you may be trading in the wrong direction.
Therefore, it is important to find a way to lower the average unit price and adjust the proportion of the investment, ultimately allowing the funds corresponding to the profits to regenerate themselves.
------------------------------------------------------------ -----------------------------------------------------
** All indicators are lagging indicators.
Therefore, it is important to be aware that the indicator moves accordingly with the movement of price and volume.
However, for the sake of convenience, we are talking in reverse for the interpretation of the indicator.
** The wRSI_SR indicator is an indicator created by adding settings and options to the existing Stochastic RSI indicator.
Therefore, the interpretation is the same as the traditional Stochastic RSI indicator. (K, D line -> R, S line)
** The OBV indicator was re-created by applying a formula to the DepthHouse Trading indicator, an indicator disclosed by oh92. (Thanks for this.)
** See support, resistance, and abbreviation points.
** Support or resistance is based on the closing price of the 1D chart.
** All descriptions are for reference only and do not guarantee a profit or loss in investment.
Explanation of abbreviations displayed in the chart
R: A point or section of resistance that requires a response to preserve profits.
S-L: Stop Loss point or section
S: A point or section where you can buy to make a profit as a support point or section.
(Short-term Stop Loss can be said to be a point where profit and loss can be preserved or additional entry can be made through split trading. It is a short-term investment perspective.)
GAP refers to the difference in prices that occurred when the stock market, CME, and BAKKT exchanges were closed because they are not traded 24 hours a day.
G1 : Closing price when closed
G2: Opening price
(Example) Gap (G1-G2)

$AAVE LONGTrend reversal, waiting for pullback to cluster zones.
1st and 2nd entries marked by arrows.
RR areas shaded in green/red

Aave AAVEUSDT - Impulse Elliott wave + ALL TIME HIGH soon!- Aave is an Open Source and Non-Custodial protocol to earn interest on deposits and borrow assets.
- Current rank 27 on coinmarketcap + Volume 24h $651,835,502.
- This is my Elliott wave count - we are currently in the Impulse wave to the upside!
- Next target is 0.618 trend-based fib extension for fifth wave.
- For expected duration of the trade, probability, stop loss, profit target, entry price and risk to reward ratio (RRR) - please check my signature below ↓
- If you want to see more of these ideas, hit "Like" & "Follow"!

AAVE - Broken Out of Inverse H/S? Looks Like Money!Here's a very nice setup for AAVE, which has some very bullish developments taking place with AAVE pro.
I expect a pretty easy payday here, though we're nearing retracement on the RSI so expect to grab a quick dip for even better gains.


AAVEUSDT D2: 550% GAINS BEST Level to BUY/HOLD (SL/TP)(NEW)Why get subbed to me on Tradingview?
-TOP author on TradingView
-2000+ ideas published
-15+ years experience in markets
-Professional chart break downs
-Supply/Demand Zones
-TD9 counts / combo review
-Key S/R levels
-No junk on my charts
-Frequent updates
-Covering FX/crypto/US stocks
-before/after analysis
-24/7 uptime so constant updates
🎁Please hit the like button and
🎁Leave a comment to support our team!
AAVEUSDT D2: 550% GAINS BEST Level to BUY/HOLD (SL/TP)(NEW)
IMPORTANT NOTE: speculative setup. do your own
due dill. use STOP LOSS. don't overleverage.
🔸 Summary and potential trade setup
::: AAVEUSDT 2days//candle chart review
::: speculative reversal setup
::: DO YOUR OWN DUE DILL
::: use a fixed stop loss as well
::: however correction mode NOW
::: few weeks so for now recommend
::: to stay out of this market
::: recommend to focus on buying low
::: I don't think that we are ready to MOON yet
::: reload BULLS near 150/160 later August 2021
::: best trades near point D for the BULLS
::: it's a strong prior bull market so can
::: so expecting at least one final PUMP
::: BULLS get ready to BUY after pullback
::: TP bulls is 550% gains
::: TP BULLS +250%/+550% gains max
::: patience required next few weeks
::: BEST reload BULLS is 150/160 USD
::: as we are getting ready for a move now
::: final TP BULLS is +250%/+550% gains max
::: good luck traders!
🔸 Supply/Demand Zones
::: N/A
::: N/A
🔸 Other noteworthy technicals/fundies
::: TD9 /Combo update: N/A
::: Sentiment mid-term: BULLS/BUY PULLBACK
::: Sentiment short-term: BEARS/CORRECTION
RISK DISCLAIMER:
Trading Crypto, Futures , Forex, CFDs and Stocks involves a risk of loss.
Please consider carefully if such trading is appropriate for you.
Past performance is not indicative of future results.
Always limit your leverage and use tight stop loss.
