AVEUSD trade ideas


Aave (AAVE) • About to break into new HighsOk. Volumes and break of price structure coming from spot and swaps are looking very strong here for AAVE.
It means that is probably time to long the longs.


AAVEUSD - FINALLY BREAKING THE RESISTANCE TRENDLINE?? AAVEUSD
Price is showing good sign of upward section after long time of consolidation.
Reasons to be bullish
1) Breaking resistance trendline
2) Strong support at 0.5 fib area
3) Above all MA, golden cross of 20MA and 50MA at daily TF
4) RSI above 50, currently at 56
5) MACD daily flipped green
First level of resistance: USD 454
Second level of resistance : USD 570
Third level of resistance : USD 855
Forth level of resistance : USD 1066
Overall price section looks bullish, price still in consolidation phase, expecting big move soon for AAVEUSD

aavelooks bullish to me after breaking out from significant resistance with a potential bat pattern formation


AAVE/USD 85% untill the 1st targetThis one is still in the inferior side of the range, bullish continuation is expected.


AAVE: Markup ImminentAAVE is prepping to go the distance. All the forensic whale signs are there: stealth absorption, accumulation spikes, secret supply sell-offs to maintain low trading range volatility (so as to not cue the retailers of a pump). All that to say this: I'm buying the bloody candles right alongside the whales, and I plan to dump my AAVE on the same retail traders they're going to. It's the way of the predator: the scorpion and the frog. Hey, at least I'm upfront about it lol.
*If you have strong hands, patience, and like big wins and big money, follow me. I track and trade all the USD & USDT-paired cryptocurrencies on Coinbase Pro, Kraken, Gemini, Binance, along with many other coins & tokens on various exchanges around the world, and regularly seek out the most profitable swing trades available. All my charts are clean, straightforward, and easy to follow.
NOTE: I am not a financial advisor. This trade may fail. Join me at your own risk.
My wins for March 2021 (Total Gains: 527.58%)
1. Filecoin: 31.92% in 14 days
2. Kyber Network: 12.09% in 7 days
3. Loom Network: 66% in 10 days
4. Ravencoin: 78.55% in 11 days
5. NMR: 19% in 2 days
6. Elastos: 178% in 15 days
7. Qtum: 66.84% in 24 days
8. Filecoin: 24% in 5 days
9. AION: 22.83% in 2 days
10. Flamingo: 28.35% in 1 Day
My wins so far for April 2021:
1. Kyber Network: 35.91% in 10 days
2. Lisk: 51.7% in 10 days
3. ZEC: 42.6% in 27 days
4. OMG: 56.8% in 27 Days
5. Compound: 12.15% in 29 days
6. XTZ: 46.7% in 34 days
7. Dent: 90.48% in 8 days
Follow me to the money

Aave possible upside breakout?Hi traders!
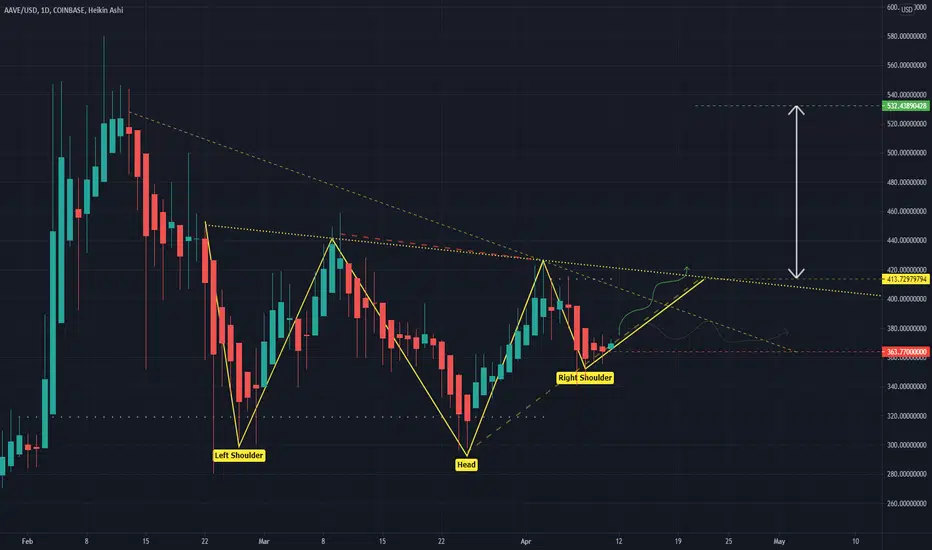
I'm looking forward to seeing this inverted head and shoulders in the coming days! With Coinbase IPO just around the corner; Is Aave looking to go upwards in this symmetrical triangle? Hit a like if you agree!!


AAVE Levels Im watchingWill be playing these levels on AAVE.
Would like to be patient and wait for a retest of $350 area and buy hard. If we aren't gifted another pullback here, I'll wait for s/r flip of the $430 area to buy. Buy support, sell resistance, ezpz.
Looks like this could be a lot of fun over the next couple of months.


Aave long and possibly breaking out soon to 450!Based on my chart analysis, Aave's recent price corrections might be over and it's looking to go surge back to 430 - 450. But the possibility of it going down is also possible if it won't hold support at 395 - 405.

NEW IDEA ON AAVEUSDIn the symbol AAVEUSD forms a triangular neck.
It seems that this pattern will break from the ceiling and will increase in price up to the number shown in the chart.
In this chart, the compression of the candlestick is too high to break the triangular roof.

AAVE/USD - potential 78% setupHello, Traders!
AAVE is exiting the active trading range of $298 - $418 and prepares to continue the market cycle.
Last time the flat movement lasted 55 days and resulted in 530% growth.
The current flat movement has lasted for 60 days, which gives us a trigger for action.
We can consider opening a position in the range of $382 - $418
Stop Loss might be placed under $324
Targets according to Fibonacci levels:
$450
$565
$638
$682
Good luck and watch out for the market.
P.S. This is an educational analysis that shouldn't be considered a financial advice

$AAVE - ETHBTC bullish gives AAVE extra power?Again massive expansion
Big corrective phase after
Month to two of consolidation,
Now Trendline breaks
With ETHBTC looking good, as this is DeFi built on ETH it could give it extra pump power
Again, as long as BTC doesn't pullback again
