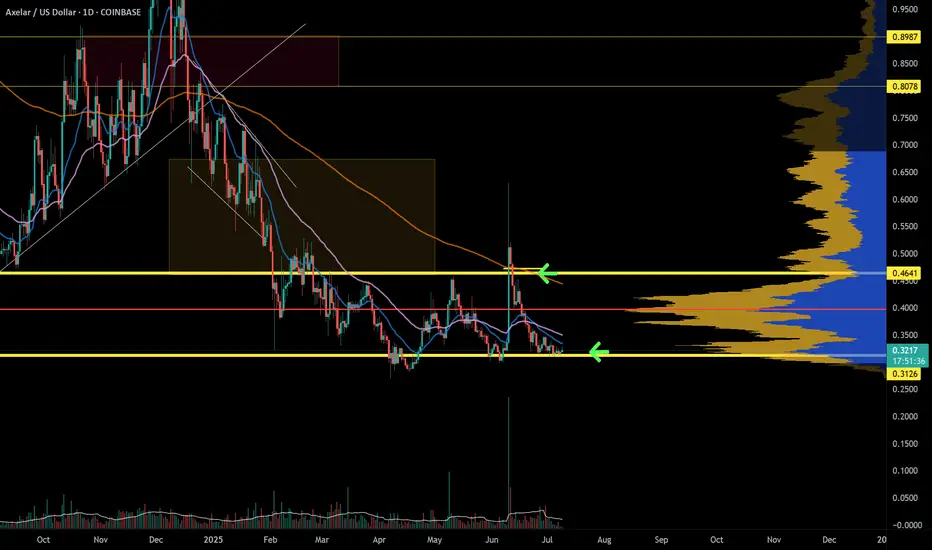
Axelar finding support if not get outAXL is now within a clearly defined range. At the bottom of the range, the RR is at its best. The best part of this range is the amount of volume. This suggests the market is participating here.
Full TA: Link in the BIO
AXLUSD trade ideas
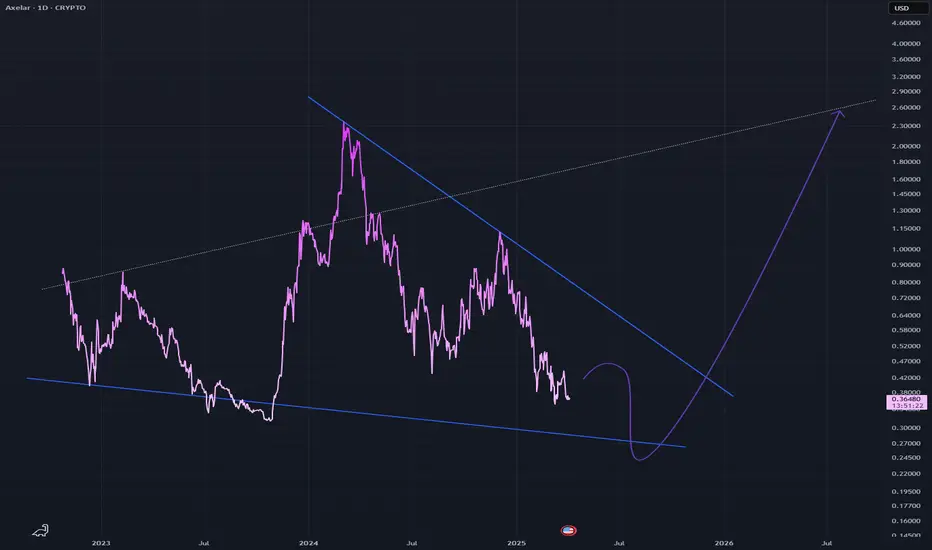
AXLUSD - Falling WedgeA falling wedge pattern which is a bullish pattern
This is on a long timeframe being the daily
I expect price to break out to the white dotted line
Daily timeframe
AXELAR Stock Chart Fibonacci Analysis 021225Trading Idea
1) Find a FIBO slingshot
2) Check FIBO 61.80% level
3) Entry Point > 0.76/61.80%
Chart time frame: B
A) 15 min(1W-3M)
B) 1 hr(3M-6M)
C) 4 hr(6M-1year)
D) 1 day(1-3years)
Stock progress: C
A) Keep rising over 61.80% resistance
B) 61.80% resistance
C) 61.80% support
D) Hit the bottom
E) Hit the top
Stocks rise as they rise from support and fall from resistance. Our goal is to find a low support point and enter. It can be referred to as buying at the pullback point. The pullback point can be found with a Fibonacci extension of 61.80%. This is a step to find entry level. 1) Find a triangle (Fibonacci Speed Fan Line) that connects the high (resistance) and low (support) points of the stock in progress, where it is continuously expressed as a Slingshot, 2) and create a Fibonacci extension level for the first rising wave from the start point of slingshot pattern.
When the current price goes over 61.80% level , that can be a good entry point, especially if the SMA 100 and 200 curves are gathered together at 61.80%, it is a very good entry point.
As a great help, tradingview provides these Fibonacci speed fan lines and extension levels with ease. So if you use the Fibonacci fan line, the extension level, and the SMA 100/200 curve well, you can find an entry point for the stock market. At least you have to enter at this low point to avoid trading failure, and if you are skilled at entering this low point, with fibonacci6180 technique, your reading skill to chart will be greatly improved.
If you want to do day trading, please set the time frame to 5 minutes or 15 minutes, and you will see many of the low point of rising stocks.
If want to prefer long term range trading, you can set the time frame to 1 hr or 1 day.

AXELAR - Setting up for a bullish wave, lots of potential gains!NYSE:AXL - Checkout the take profit targets I plotted. Great potential gains on the horizon.
Indicators heating up and flashing bullish soon.

AXL I see a megaphone pattern playing out .
With a target of 1,4$ approximately.
Around 22 januari .
*If the rest of the market stays in a healthy rythem up . With slight consolidations

Axelar breaking up from an inverse head & shoulders pattern. Axelar seems to be in the midst of validating a breakout upward from another nverse head and shoulder pattern. Target is $1.41 *not financial advice*

AXLUSD golden cross on approachAxelar (AXLUSD) has yet to see significant movement this cycle unlike alts, especially the other coins related to CRYPTOCAP:XRP ( CRYPTOCAP:XLM , BLACKBULL:SOLO , MEXC:COREUMUSDT ). As the market cycles into the lower caps I suspect COINBASE:AXLUSD and COINBASE:DIAUSD (both related to Ripple) to move.
COINBASE:AXLUSD is showing an golden approaching golden cross on the daily with the 21 day SMA about to cross up through the 255 day SMA in the next week. The last time this happened was November 2023 after which COINBASE:AXLUSD did a 4-5x in the following months.
I expect a market cap for COINBASE:AXLUSD between $5-$10 B by 2026 to make it comparable to peers such as MYX:COSMOS & CRYPTOCAP:DOT although COINBASE:AXLUSD current inflationary tokenomics are not appealing.

AXLUSD - 4h Consolidation ZoneAXLUSD - 4h Consolidation Zone
If you like my AT, and you agree with the approaches, please FOLLOW ME and press BOOST so we can share it with more people. We are working on an automated trading tool so that everyone can apply their strategies in a VISUAL and PROFESSIONAL way, as we present in the analysis.
Thank you!
_______________________________________________________
AXLUSD - 4h Consolidation Zone
AXL broke strongly from 0.40 which we marked as dynamic support and is now trading at 0.81
It is possible that the price will test 0.75 before developing a new momentum that leads the value to seek 1.11.
LEVELS:
SL: 0.75
TP1: 1.11
TP2: 1.31
Part of its development will have to do with what btc does, but it seems that October will continue to be a BULLISH month.
______________________________________________________
Automated Cryptocurrency Trading Bots: All these strategic alternatives can be configured with TradeX BoT, since it will allow you to position in both directions without having to block any amount per position. It will only be necessary for the conditions to be met, either downward or upward, for the orders to be executed in one direction or another, taking the necessary deposits from your portfolio.
TradeX BoT (in development): Tool to automate trading strategies designed in TradingView. It works with both indicators and technical drawing tools: parallel channels, trend lines, supports, resistances... It allows you to easily establish SL (%), TP (%), SL Trailing... multiple strategies in different values, simultaneous BUY-SELL orders, conditional orders.
This tool is in the process of development and the BETA will soon be ready for testing.
FOLLOW ME and I will keep you informed of the progress we make.
I share with you my technical analysis assessments on certain stocks that I follow as part of the strategies I design for my portfolio, but I do not recommend anyone to operate based on these indicators. Inform yourself, train yourself and build your own strategies when investing. I only hope that my comments help you on your own path :)

Axelar breaking upward from symmetrical triangleHorizontal green trendline and 200ma(blue line) likely to act as resistance on the way to the target. *not financial advice*

AXLUSD 1D - Rises above $0.70AXLUSD 1D - Rises above $0.70
AXLUSD is a stock to watch. It had a continuous rise that took it to a maximum of $2.70. It is now trading at $0.60.
It has already overcome the downward trend and is settling its price to begin a new price escalation. It has to overcome the previous lower high at $0.70 to be ready for a bullish rally.
Before breaking upwards, it could mark a DOUBLE BOTTOM in the $0.40 area. Hence the importance of breaking the $0.70 levels and not losing the dynamic support.
The objectives are clearly marked.
This strategy can be executed with TradeX BoT when we finish developing it.
TradeX BoT (in development):
Tool to automate trading strategies designed in TradingView. It works with both indicators and graphic design tools: parallel channels, trend lines, supports, resistances… It allows you to easily establish SL (%), TP (%), SL Trailing… multiple strategies in different values, simultaneous BUY-SELL orders, conditional orders.
This tool is in the development process and the BETA will soon be ready for testing.
FOLLOW ME and I will keep you informed of the progress we make.
I share with you my technical analysis assessments on certain values that I follow as part of the strategies I design for my portfolio, but I do not recommend anyone to operate based on these indications. Inform yourself, train yourself and build your own strategies when investing. I only hope that my comments help you on your own path :)

AXL 8R Trade Idea with Entry, Targets, and Stop LossAXL is down from entry and has tagged the previous weekly entry that sent price down 32% and then up 500% (47 cents entry to 32 cents low, and finally a rally to $2.7). Price has retraced this move back to the previous entry of 47 cents AND made another weekly entry at 57 cents.
Targets based on the risk from that entry have been drawn.
Yellow Stop loss of -20% is based on previous lows.
Orange stop loss of -33% is based on how low price went after the previous weekly entry of 48 cents before the rally (-32% from weekly entry)

Axelar AXLChart Analysis for Axelar (AXL)
Potential Price Target: $0.44
Volume Profile:
The volume profile reveals a significant cluster around the $0.44 area, indicating a strong level of interest and potential support at this price point. This suggests that if Axelar's price were to decline, it could find substantial buying interest and consolidation around $0.44.
Fibonacci Levels:
The Fibonacci retracement levels highlight key areas of interest, especially as the price reaches the lower ranges. These levels serve as potential support and
resistance zones, which could influence price movements in the near term.
Market Outlook:
Given the current market conditions, it is crucial to see an increase in trading activity and bullish momentum. Without a pickup in volume and positive sentiment, the likelihood of Axelar (AXL) dropping to the $0.44 range in the coming weeks is high. This analysis underscores the importance of monitoring these technical indicators closely to anticipate potential price movements and make informed trading decisions.

AXLUSD Eyes $1.48 After Finding SupportAXL bulls are back in control after the price found support at $1.05. The bulls were able to push the price up to $1.29, after forming a double-bottom pattern. Currently, AXLUSD is trading at $1.22.
I am cautiously optimistic about the short-term outlook for AXLUSD. If the current price holds, the bulls could make another attempt to break through $1.29. If successful, this could open the door for a move towards $1.48.

AXLUSD worth watchingNot sure why volume is spiking so hard, but this is worth keeping an eye on. Targets are muddy, and I think if this is the bottom it will take more time to develop structure.

Potential support and resistance levelsCalculated levels from current trading patterns in the market.
The only way to be sure is to wait for the volume to build and start testing.
This is also tradable on coinbase if your curious.
The order books on coinbase has plenty of liquidity and too be honest no resistance.
1 million dollars in rapid volume would shoot the moon 1000's of percent literally in seconds
until people started selling.
I saw it listed on coinbase even though i don't use the exchange anymore i am still looking out and
sharing my analysis.
this is my observation of current market conditions
and in no way is this investment advice.
good luck
