AXSPERP trade ideas

AXS - Video Top-Down Analysis!Hello TradingView Family / Fellow Traders. This is Richard, as known as theSignalyst.
Here is a detailed update top-down analysis for AXS.
Which scenario do you think is more likely to happen? and Why?
Always follow your trading plan regarding entry, risk management, and trade management.
Good Luck!
All Strategies Are Good; If Managed Properly!
~Rich


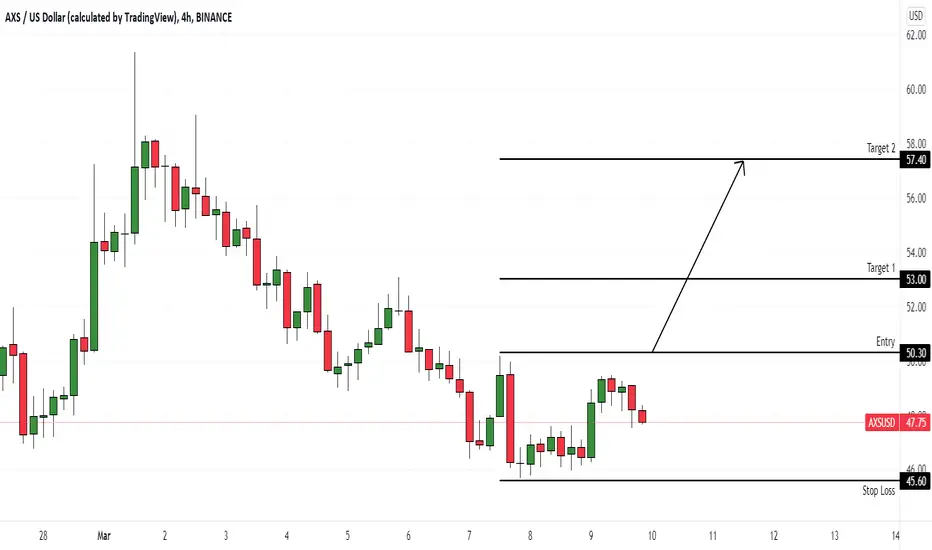
AXSUSD (4H) Bullish reversalHi Traders
AXSUSD (4H Timeframe)
Waiting for the upward break of 50.30 resistance level, which will complete a bullish trend reversal pattern to go LONG. Only the downward break of 45.60 would cancel the bullish scenario.
Trade details
Entry: 50.30
Stop loss: 45.60
Take profit 1: 53.00
Take profit 2: 57.40
Score: 4
Strategy: Bullish reversal
$AXS - To Reach it's Bullish Order Blocks Early in the Week. SMT*SMT = Smart Money Theory = everything you think that is not retail related to trading. First, SMT does not believe that triangles, wedges , trendlines , channels, harmonics, etc. has any effect on how price reacts. The second is to recognize that the price is not random, it is set by an algorithm controlled by those that control the asset. The Third thing to remember is price will move toward Liquidity and Balance. That's the basics. The rest is very unique in the vocabulary you need to have and the concepts that wrap around these ideas.
It Appears AXS is heading towards the Order Blocks it formed on 2/23. We should See the price get down to these levels (Entrance 1 45,58 and Entrance 2 (if gets there) 43.30, this should possibly have some consolidation to trick retail traders into selling off when it should then take everyone by surprise and rise to new higher levels which I belive will be in the 162% Extension of the original wave which is also neathe bearish Order Block of nearly $60.
I see it as this
Breaking through both sell side liquidity points as it created a "Support Area" Which is an area that people will chase up until it turns around and goes agaoins those retail traders. Then we should see it finally move in the direction thast it should, hopfully gettting no lower than it already has in CoinBase.
BINANCE:AXSUSD
FTX:AXSUSD
KRAKEN:AXSUSD
BITFINEX:AXSUSD
GEMINI:AXSUSD
BITSTAMP:AXSUSD
OKCOIN:AXSUSD
KUCOIN:AXSUSDT
COINEX:AXSUSDT
OKEX:AXSUSDT
HUOBI:AXSUSDT
PHEMEX:AXSUSDT

AXSUSD (4H) Bearish reversalHi Traders
AXSUSD (4H Timeframe)
Waiting for the downward break of 48.86 support level which will complete a bearish trend reversal pattern to go SHORT. Only the upward break of 53.26 would cancel the bearish scenario.
Trade details
Entry: 48.86
Stop loss: 53.26
Take profit 1: 46.16
Take profit 2: 42.55
Score: 8
Strategy: Bearish reversal

Clear short for ASDThis is an easy setup, In a clear downtrend and allthough the blue support held several times it gets weaker and weaker.....ladder until 59/60 and take a 30% market buy position now. Target will be the next support line

Bullish Shark at Support Line with MACD Bullish DivergenceFrom the looks of it AXS would like to see one more bounce before it resumes it's Bearish Trend. I suspect close to a 50% Retrace of the Prior Highs before an Ultimate Reversal back to the downside.
For now the trade is Bullish and Profit Taking Targets range from 80 dollars to just over 100 dollars.

AXS USDT SHORT SWING | AXSUSDT | SHORT @ 50 - 49 | TP @ 48, 47, 46, 45, 44 | SL @ 59 | PATTERN = BLACK MARABOZU | FTX |
Swing trade idea. Kindly follow targets and stop loss. Will update with new targets once all 5 are achieved.


AXS booting up....AXS resting and accumulating in a demand zone....
Find entry, sl & tp in TA
Trade safe....
NB: Patience + risk management = Winning trades
#e2kclicks #axs

Bullish trendAXS is now in a very strong area of demand which caused the previous break in structure of the price to the upside

Set Up Long AXSUSDT/BinanceLong at Bullish OB at equilibrium 0.5 fibonacci.Stop loss and Take profit like my set up.


AXS cup & handle targets to 82 for first TPAXS cup & handle targets to 82 for first TP AXS cup & handle targets to 82 for first TP AXS cup & handle targets to 82 for first TP
@micdot7

AXSUSD (4H) Bullish reversalHi Traders
AXSUSD (4H Timeframe)
Waiting for the upward break of 62.10 resistance level, which will complete a bullish trend reversal pattern to go LONG. Only the downward break of 55.10 would cancel the bullish scenario.
Trade details
Entry: 62.10
Stop loss: 55.10
Take profit 1: 65.80
Take profit 2: 72.40
Score: 6
Strategy: Bullish reversal

AXS - LongAXS is ready to make the next move.....
30days forecast = TP1
Like this idea ?... Please do a thumbs up
Thanks for watching.

AXS Short / SXP Long ?I'm looking for Pairs to trade against each other to offset the risk of a single trade.
With a "± simple" calculation of each possible outcome of A UP / A Flat / A down - B UP / B Flat / B down i look wich move in A/B is the most likeliest.
AXS / SXP UP 1 6%
AXS / SXP Down 4 34%
SXP / AXS UP 4 17%
SXP / AXS Down 2 33%

Good opportunity for long trade in Axie infinity As one can see in the chart Axie infinty chart after a good consolidation at the support level it gave a breakout of the trendline this could be possible trend reversal. Entry neat 56-58 sl below the consolidation at 43 target near 77-78.

Do not Buy the Dip on AXS yet !!No Investment Advice.
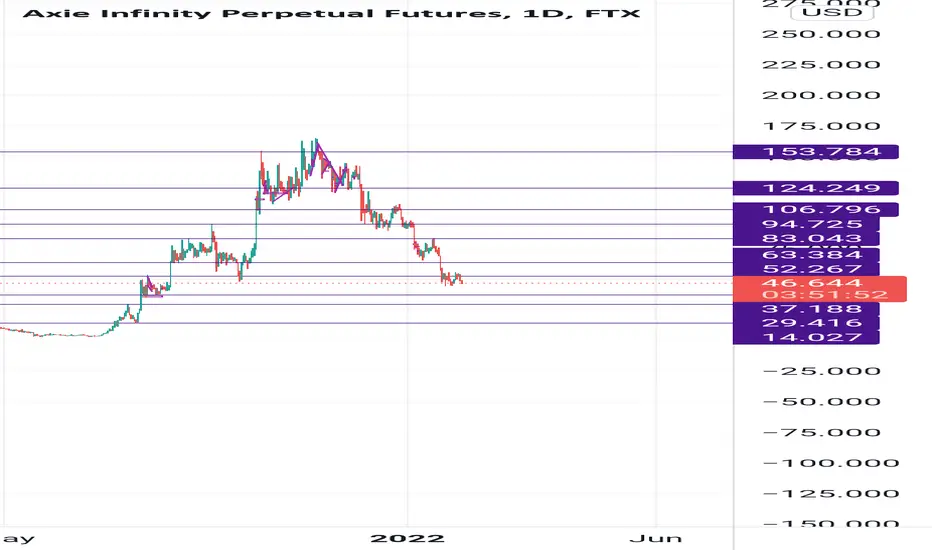
AXS looked amazing when it was making its minor degree impulse. Wave 3 was massive in relation to wave 1. Wave 3 finished very close to fibb level shown in purple. And a usual wave 4 Triangle structure. Wave 5 spot on fibb level. Usually wave 5 is .618 of wave 1+3 but in this case it finished 1 level lower suggesting upcoming weakness in the trend.
Now it has been selling off with the market. But the most worrying thing is that it has managed to make a lower low invalidating possibility of wave 3.
If you are holding bags i wish you good luck with that. If i were you i will do a solid fundamental analysis. And if i come to a conclusion that this project has future i will DCA. My next entry will be 20.50 and next level 5. Based on fibb level as shown below-

Axie infinityI don't want to sound negative, but what's the idea behind axie? How sustainable is it. Well from the charts price is going down. ( Obviously this correction or should I say change in major trend is soo... Cold. Brace yourself for next level around $36 area. Or could there be a turn around zone? Not anytime soon I guess 🙂
Axie InfinityAxie Infinity (AXS/USD) is on the verge of a bullish cross SMA55/SMA233 on the 1hr chart. It looks like it's trying to consolidate it's lower price action since the crypto market shake out a week ago. Unless you've already been holding for +365 days, imo now is a good time to start being a "Hodler" in the crypto market as a whole & add on potential dips. Here's levels on the 1 hour chart, 1 week view:
7 day high = $55.47
7 day low = $44.61
52 week high = $165.37
52 week low = $0.76
SMA233 = $53.94
SMA144 = $49.33
SMA89 = $48.75
SMA55 = $47.37
breakout = $53.96
R3 = $52.51
R2 = $51.07
R1 = $49.62
pivot = $48.18
S1 = $46.73
S2 = $45.28
S3 = $43.84
breakdown = $42.40
Do your own due diligence, your risk is 100% your responsibility. This is for educational and entertainment purposes only. You win some or you learn some. Consider being charitable with some of your profit to help humankind. Good luck and happy trading friends...
*3x lucky 7s of trading*
7pt Trading compass:
Price action, entry/exit
Volume average/direction
Trend, patterns, momentum
Newsworthy current events
Revenue
Earnings
Balance sheet
7 Common mistakes:
+5% portfolio trades, capital risk management
Beware of analyst's motives
Emotions & Opinions
FOMO : bad timing, the market is ruthless, be shrewd
Lack of planning & discipline
Forgetting restraint
Obdurate repetitive errors, no adaptation
7 Important tools:
Trading View app!, Brokerage UI
Accurate indicators & settings
Wide screen monitor/s
Trading log (pencil & graph paper)
Big, organized desk
Reading books, playing chess
Sorted watch-list
Checkout my indicators:
Fibonacci VIP - volume
Fibonacci MA7 - price
pi RSI - trend momentum
TTC - trend channel
AlertiT - notification
tickerTracker - MFI Oscillator
www.tradingview.com

