AXSUSDT Elliott Waves Analysis (Global Vision)Hello friends.
Please support my work by clicking the LIKE button👍(If you liked). Also i will appreciate for ur activity. Thank you!
Everything on the chart.
we have a formed downward impulse,
in the medium term we are expected to grow, after which we will have another decline in the ~5$ zone.
But now, we have a good opportunity to take up to 500% profit.
Targets: 20 - 35 - ~50
HOLD!
Good luck everyone!
Follow me on TRADINGView, if you don't want to miss my next analysis or signals.
It's not financial advice.
Dont Forget, always make your own research before to trade my ideas!
Open to any questions and suggestions.
AXSUSDT.P trade ideas

ScalpFor documentation
AXS might make a move based on technical analysis.
Technical Analysis: Looking good
Fundamental: Market just had large sell-offs from FTX and could correct.
Good Risk Reward ratio
Entries: $6.68-$6.5

strong longThe bottom of the channel is touched. Wait for the confirmation candle, then enter the position
By observing the loss limit

AXSVery simple ... Very clear
This is my personal opinion. Please do not trade based on my analysis and data.

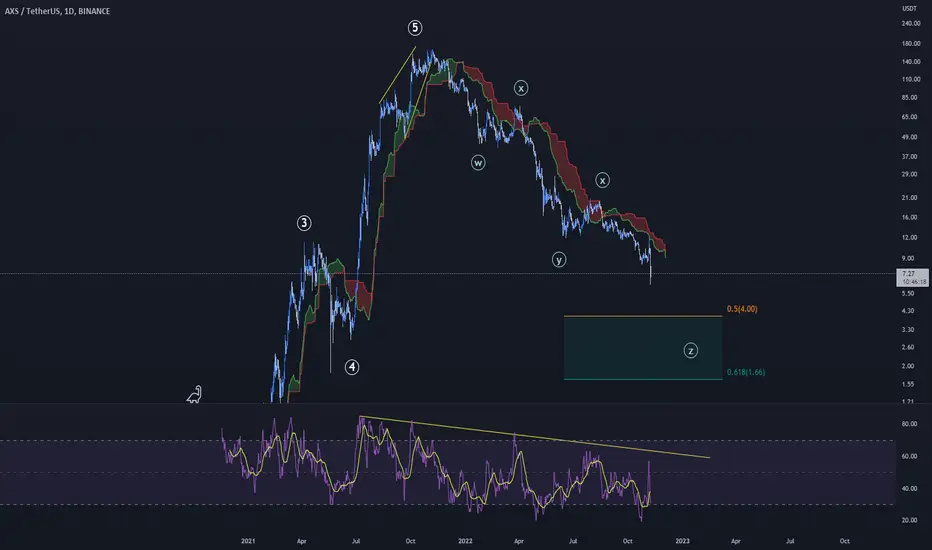
AXS Long-Term AnalysisFrom the point of Elliott wave analysis, We can clearly see a downward trend from ATH, Which can have a final target in Wave Z in the specified Fibonacci Range.
Considering that the analysis is from a long-term point of view, as a result, the Fibonacci range is enlarged, but an experienced trader should look for reversal patterns to enter the trade by checking the price movement when reaching the Fibonacci area or near it.
Also If You can Manage your Risk, you can easily take short on this Time while reaching the Fibonacci Zone, and also it can Be a Great Short Position with +100% Profit with a moderate Leverage.
In the future, we will update this analysis as the price moves further.
Keep calm and follow the trend with me
AXSUSDTHi guys
We have a positive RSI divergence on the daily and hourly time frame, we have now reached an important support range!
If the price range of $7.64 is maintained, there is a high probability of breaking the downtrend line.
If the uptrend is above the $13.25 range, we will be issued a divergence confirmation.
What do you think?

AXSUSDT 4HAxie Infinity Shards (AXS) Potential Setup
Swing Short Idea. Risk management is a must on this trade; look for confirmation before enter and find a good entry point

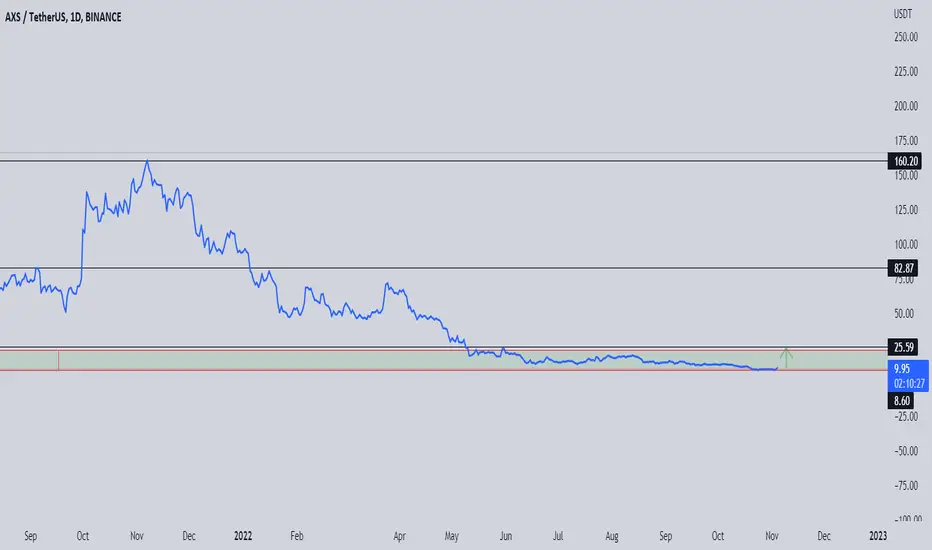
AXS Axie Infinity The Full Speculative Bubble and Price TargetAs you can see in the chart, AXS Axie Infinity made 1375X and went from $0.12 to $165 in only one year.
Now it is trading at $15.08, still high in my opinion!
AXS is an Ethereum based token.
Grayscale expressed concerns over the potential impact on the Ethereum Merge, especially on tokens that run natively on Ethereum:
The Merge may lead to a fork that might have unexpected and unfavorable outcomes and a scenario where stablecoins and tokens locked in smart contracts might not be redeemable.
Token and stablecoin holders might panic and start liquidating their holdings.
In this context, my price target for AXS Axie Infinity is $4.29, still 36X higher from 2 years ago.
Looking forward to read your opinion about it.

Possible Long on AXS/USDTso a descending triangle has been formed, if price breaks above it, it would be great opportunity to open a long position,
the entry point and TP&SL are pointed out in the chart
The strategy behind opening any position is to make sure your win/loss ration is 3/1 i.e TP should be 10% and your stop loss 3%
I suggest you do the same, so if you do 10 trades you only need 3 of them to be successful to gain a profit on your whole trades

#AXSUSDT Bearish channel breakTrade setup: Following a bearish break from Sideways Channel ($14-$20), below $14 support, price made a new Lower Low, which is a sign of Downtrend. It is now approaching $6 support. (set a price alert).
Trend: Downtrend across all time horizons (Short- Medium- and Long-Term).
Momentum is Mixed as MACD Line is above MACD Signal Line (Bullish) but RSI ~ 50 (Neutral).
OBV (On Balance Volume): is rising, indicating that volume on Up days is greater than volume on Down days. Hence, demand (buyers) exceeds supply (sellers).
Support and Resistance: Nearest Support Zone is $6. The nearest Resistance Zone is $14 (previous support), then $20.

AXSAXS right now sitting on trendline support which comes from nov-2020
here I m expecting a quick rally up to 26-35
NFA
DYOR
invalid if any candle closes below the trendline

AXSUSDT analysis buying signalMarket is on the way to our white buying area after formation of III white sequence

AXSIdea: The price rose to strong resistance and started a correction. The correction will end at 200 EMA, then the price will continue to rise to one of the strong resistance levels to the daily 100 MA-EMA


AXS/USDT - LONG --> Divergence ----- Welcome, dear followers! -----
- Here is my trading methodology. I trade with a normal system and analysis of resistance and support, as well as price reversal patterns.
- For the record, I do not place a stop loss within my trades. So that I only risk 1.5% of my total capital in order to support the loss due to a price reversal against me.
- If a price reversed against my expectation and touched the drawn line r3, then I transferred targets to the entry point and waited for the price to close at it with a loss equal to almost zero.
- Today's deal is shown in the chart, and here are the entry and exit points below.
-- Support me with numbers and follow up on my account for other deals in the future. Thank you for coming to this part.
---------------------------------------------------------
⚡️⚡️ AXS/USDT ⚡️⚡️
Exchange: Binance Futures
Trade Type: Breakout (Long)
Leverage: Cross (1.0X)
Entry Orders:
1) 9.75 - 100.0%
Take-Profit Orders:
1) 10.51 - 70.0%
2) 11.08 - 20.0%
3) 11.99 - 10.0%
Trailing Configuration:
Stop: Breakeven -
Trigger: Target (1)

AXS : SHOWING MOVEMENT INCREASE + VOLUMEAXS: SHOWING MOVEMENT INCREASE
Depending on the low time frame it can show coming to time more volume trends.
This can be also the new Bottom that AXS has made.
volume range can increase with time.
Targets
There is a good chance that we can see coming time a movement of AXS price between 11-15 USD
This is expecting and not trading advice: Crypto is most of the time too risky, manage your risk well, and don't just enter any coin with no study and confirmations.
AXS | Getting Ready for Massive Breakout..!!
#AXS (Update)
Falling Wedge Formation in 2-day timeframe Chart.
As Pretty Decent Buying Volume Coming in, Looks Promising for Breakout.
In Case of Breakout, Expecting +500% Bullish Rally in Midterm. (Patience Will Payoff)
Please like the idea for Support & Subscribe for More ideas like this and share your ideas and charts in Comments Section..!!
Thanks for Your Love & Support..!!

#AXSUSDT (Watchlist) 11/22#AXSUSDT maybe worth it to add this coin to your Watchlist. 👀
(Share it with your friends)
Remember Alts totally rekt during the bearish cycle and they always do -92 -95 -99% so make sure to follow risk management.
#DYOR
Everything mentioned on the chart (Pattern/Resistance/Support / Breakout/Breadkwon levels, Also R: R)
add to the watchlist means the coin we mentioned is forming a pattern or moving near a historical bottom, around or above good support, increase in trading volume , showing a reversal candle, accumulation stage, etc, but no reaction from bulls, so we inform you to add it to your watchlist until the right time for entry.!!
Ps:
we avoid trading any coin if the entire project is based on gambling, prostitution, human trafficking, borrowing, lending, etc.
This is not financial advice, The purpose of these Charts is to give you an idea about coin movement (not buy or sell signal) so before following any idea be sure to make your own research and follow risk management.
Whatever Don't forget that." Be bullish or bearish as you want, But be sure you cannot impose your opinion or force it to happen. so be ready for everything"
We are responsible for what we write, not for what you understand, so take care and read it carefully to understand it clearly.
The Cryptocurrency market is very volatile and involves gains and losses, so know very well what you are heading toward before engaging in it.
The information we mentioned here is a personal effort so it subject to success or failure.
Good luck to All.
🙏we ask Allah reconcile and repay🙏

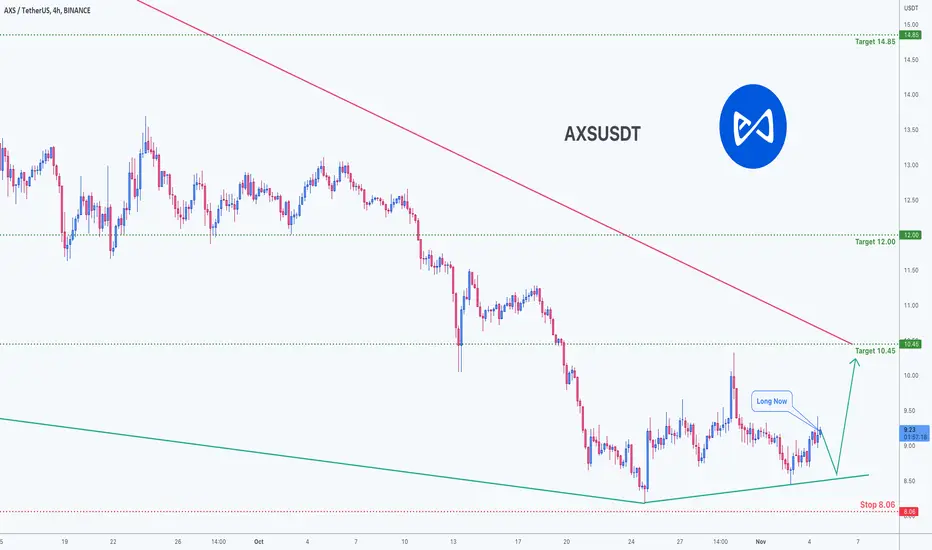
Trading opportunity for AXSUSDT Axie InfinityBased on technical factors there is a Long position in :
📊 AXSUSDT Axie Infinity
🔵 Long Now 9.24
🧯 Stop loss 8.06
🏹 Target 1 10.45
🏹 Target 2 12.00
🏹 Target 3 14.85
💸RISK : 1%
We hope it is profitable for you ❤️
Please support our activity with your likes👍 and comments📝
AXS SHORT SETUPHello, dear traders. how are you ? Today we have a setup to sell/short the AXS symbol.
For risk management, please don't forget stop loss and capital management
When we reach the first target, save some profit and then change the stop to entry
Comment if you have any questions
Thank You

#AXSUSDT 4h Chart
Price tapped perfectly into the 4h demand zone and moved up from there as predicted. MACD is showing bearish weakness, RSI and EMAs are neutral. Once price breaks above $9.3 then i would expect it to keep moving up towards the daily supply around $11.

AXS in free fallI don't know what happened with this coin, but it lost almost all of the HTF support. it is not even near an area that would make me interested to buy for the long term. I expected it to fall as low as 3 dollars. but now it had some kind of reactions that may it indicate a possible range is forming before another leg down. so market structure changed in 4h. when it pulls back to 12h OB and the Golden pocket I would long. anywhere between 8.4/8.7 is good for buying. stop below the low. target the previous wick low that was put in before break down.

Axie Infinity AXS to $8 - Swing trade opportunity.On the above 1-day chart price action has increased 380% in 15-days. That’s amazing. There is now a number of reasons to be bearish in the short term:
1) While the ‘great sell’ signal has not yet triggered it is in the post, the little blue triangle above price action tells me that. Look left.
2) Price action is well outside the upper Bollinger Band (not shown here) it will collapse to the mean, which is currently at $6.70.
3) When RSI was at the current levels (green circles) price action collapsed 40%.
Easiest swing trade ever.
Good luck!
WW
