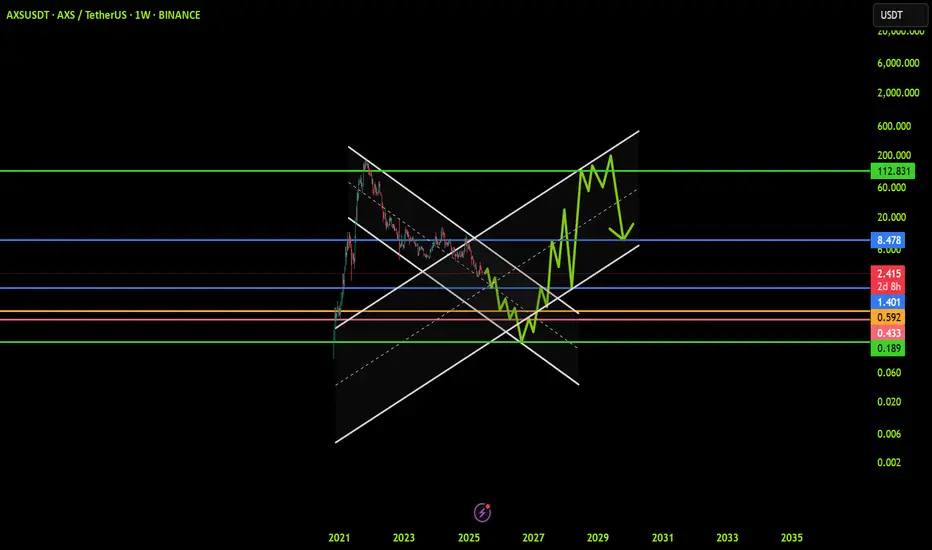
AXS - We are on support, next rocket 180%At the moment, the price is in the testing zone of the lower boundary of the descending channel. This is a critical level that will determine the further direction of movement. If the price bounces off the support, we can expect an upward correction. If the price breaks through the support, we shoul
Related pairs

#AXSUSDT #4h (Bitget Futures) Falling wedge breakout and retestAxie Infinity just pulled back to 50MA support where it's bouncing, looks ready for recovery towards 200MA resistance and more.
⚡️⚡️ #AXS/USDT ⚡️⚡️
Exchanges: Bitget Futures
Signal Type: Regular (Long)
Leverage: Isolated (4.0X)
Amount: 4.7%
Current Price:
2.509
Entry Zone:
2.489 - 2.407
Take-Pro

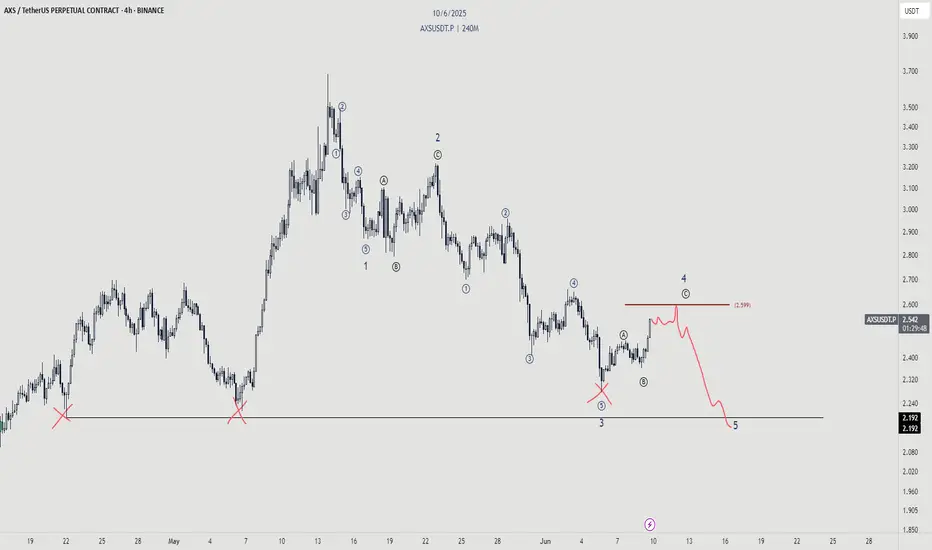
AXSUSDT 1D Analysis AXS ~ 1D Analysis
#AXS Buy gradually from here if you still have confidence in this coin with a short term target of at least 15%++

AXSUSDT: Trend in weekly timeframeThe color levels are very accurate levels of support and resistance in different time frames, and we have to wait for their reaction in these areas.
So, Please pay special attention to the very accurate trend, colored levels, and you must know that SETUP is very sensitive.
Be careful
BEST
MT
AXS/USDT (6H) – Downtrend Resistance Test in Progress AXS/USDT (6H) – Downtrend Resistance Test in Progress
Pattern: Descending Trendline Breakout
Timeframe: 6-Hour ⏱️
Pair: AXS/USDT 💱
Published: June 11, 2025 📅
Technical Overview:
AXS/USDT is approaching a key descending trendline that has capped price action since early June. Price is testing thi

AXSUSDT Analysis AXS is showing signs of a potential breakout after breaking the descending trendline and reclaiming the 50 EMA. Price is currently testing a key resistance zone between 2.62–2.80 USDT.
🟦 Key Levels:
Support: 2.50 – 2.46 USDT
Resistance: 2.62 – 2.80 USDT
🔀 Two Possible Scenarios: ✅ Bullish: Pric

AXS - Dont be faked outWhile the bounce is nice, we should not forget about the real trend here.
We're still bearish overall and there is a shit ton of liquidity to be taken out. Don't be blinded
AXSFor the pattern to be a buy signal, the neckline must be breached with a candle closing above it. In the image, the breakout has not yet occurred; the price is still below the neckline, so the pattern cannot be confirmed yet.📊

AXS LONG RESULT AXS price experience a sharp Bearish dump after failing to break the Resistance Zone of $3.9, In time has been trading within a symmetrical triangle pattern, with the major Support Trendline in Confluence.
So I decided to Take a Short position from the minor resistance to the major Support zone as

AXSUSD | LONG | NFT Gaming Bounce| (May 19, 2025)AXSUSD | LONG | NFT Gaming Bounce + Short Squeeze Potential | (May 19, 2025)
1️⃣ Insight Summary:
AXS, the token behind Axie Infinity, is setting up for a potential short squeeze. With NFT gaming interest reviving and key support holding, a move higher could unfold soon.
2️⃣ Trade Parameters:
Bias

See all ideas
Summarizing what the indicators are suggesting.
Oscillators
Neutral
SellBuy
Strong sellStrong buy
Strong sellSellNeutralBuyStrong buy
Oscillators
Neutral
SellBuy
Strong sellStrong buy
Strong sellSellNeutralBuyStrong buy
Summary
Neutral
SellBuy
Strong sellStrong buy
Strong sellSellNeutralBuyStrong buy
Summary
Neutral
SellBuy
Strong sellStrong buy
Strong sellSellNeutralBuyStrong buy
Summary
Neutral
SellBuy
Strong sellStrong buy
Strong sellSellNeutralBuyStrong buy
Moving Averages
Neutral
SellBuy
Strong sellStrong buy
Strong sellSellNeutralBuyStrong buy
Moving Averages
Neutral
SellBuy
Strong sellStrong buy
Strong sellSellNeutralBuyStrong buy
Displays a symbol's price movements over previous years to identify recurring trends.
Frequently Asked Questions
The current price of AXS / USDT Spot Trading Pair (AXS) is 2.288 USDT — it has risen 0.70% in the past 24 hours. Try placing this info into the context by checking out what coins are also gaining and losing at the moment and seeing AXS price chart.
AXS / USDT Spot Trading Pair price has fallen by −0.69% over the last week, its month performance shows a −9.64% decrease, and as for the last year, AXS / USDT Spot Trading Pair has decreased by −56.71%. See more dynamics on AXS price chart.
Keep track of coins' changes with our Crypto Coins Heatmap.
Keep track of coins' changes with our Crypto Coins Heatmap.
AXS / USDT Spot Trading Pair (AXS) reached its highest price on Nov 6, 2021 — it amounted to 165.764 USDT. Find more insights on the AXS price chart.
See the list of crypto gainers and choose what best fits your strategy.
See the list of crypto gainers and choose what best fits your strategy.
AXS / USDT Spot Trading Pair (AXS) reached the lowest price of 1.916 USDT on Jun 22, 2025. View more AXS / USDT Spot Trading Pair dynamics on the price chart.
See the list of crypto losers to find unexpected opportunities.
See the list of crypto losers to find unexpected opportunities.
The safest choice when buying AXS is to go to a well-known crypto exchange. Some of the popular names are Binance, Coinbase, Kraken. But you'll have to find a reliable broker and create an account first. You can trade AXS right from TradingView charts — just choose a broker and connect to your account.
Crypto markets are famous for their volatility, so one should study all the available stats before adding crypto assets to their portfolio. Very often it's technical analysis that comes in handy. We prepared technical ratings for AXS / USDT Spot Trading Pair (AXS): today its technical analysis shows the buy signal, and according to the 1 week rating AXS shows the sell signal. And you'd better dig deeper and study 1 month rating too — it's sell. Find inspiration in AXS / USDT Spot Trading Pair trading ideas and keep track of what's moving crypto markets with our crypto news feed.
AXS / USDT Spot Trading Pair (AXS) is just as reliable as any other crypto asset — this corner of the world market is highly volatile. Today, for instance, AXS / USDT Spot Trading Pair is estimated as 1.81% volatile. The only thing it means is that you must prepare and examine all available information before making a decision. And if you're not sure about AXS / USDT Spot Trading Pair, you can find more inspiration in our curated watchlists.
You can discuss AXS / USDT Spot Trading Pair (AXS) with other users in our public chats, Minds or in the comments to Ideas.