TradeCityPro | AXS: Gaming Token at Risk of New Lows or Rebound?👋 Welcome to TradeCity Pro!
In this analysis, I want to review the AXS coin for you. The AXS project is one of the crypto gaming projects, currently ranked 124 on CoinMarketCap with a market cap of $357 million.
⚡️ This project was highly hyped during the previous bull run in 2021, but after a while, the hype faded and we witnessed severe declines in this coin. It is still in a downtrend.
📅 Daily Time Frame
In the daily time frame, as I mentioned, this coin has been in a long-term downtrend, and recently, with the break of the 4.193 level, the next leg of the trend has begun, and the price has moved downward.
✔️ In the previous analysis , if you remember, I told you that to buy this coin, you should wait for the price to stabilize above the 7.366 level, and if it stabilizes below 5.439, a drop could occur.
📉 As you can see, the price never stabilized above 7.366, and after breaking 5.439, a strong bearish trend began. I hope you used this trigger and made good profits from this bearish move.
⭐ We can draw a trendline from the price lows, and in every move the price has made, it has reacted to this dynamic area and started a new leg after some correction.
🧩 Currently, the price is near an important support at the 2.2 area, and both volume and RSI strongly indicate momentum. If this support breaks and RSI enters the oversold zone, we can expect a sharp bearish move from the price.
🎲 The next support the price has is at the 1.355 level, which is the most important price support, and in my opinion, if the price makes another bearish leg, it will react to this area.
⏳ 4-Hour Time Frame
In the 4-hour time frame, as you can see, the price is in a descending channel and has now formed a range box at the bottom of the channel.
💫 The bottom of the box is at 2.2 and the top is at 2.431. A break of the box bottom can bring the price back to the box low again. A break of the box top can start a bullish leg up to the top of the channel.
💥 On the other hand, usually when a box forms at the bottom of a descending channel, the price goes through some time-based correction and likely ranges toward the channel midline.
🔍 Also, pay attention to the RSI oscillator. RSI entering the oversold zone confirms a short position, and a break of the 50 level confirms a long position.
📝 Final Thoughts
This analysis reflects our opinions and is not financial advice.
Share your thoughts in the comments, and don’t forget to share this analysis with your friends! ❤️
AXSUSDT trade ideas

AXS/USDT 1W🩸 NYSE:AXS ⁀➷
#AxieInfinity. Macro chart Another
💯 Intermediate Target - $30.57
🚩 Macro Target 1 - $46.65
🚩 Macro Target 2 - $81.99
🚩 Macro Target 3 - $135.22
- Not financial advice, trade with caution.
#Crypto #AxieInfinity #AXS #Investment
✅ Stay updated on market news and developments that may influence the price of Axie Infinity. Positive or negative news can significantly impact the cryptocurrency's value.
✅ Exercise patience and discipline when executing your trading plan. Avoid making impulsive decisions driven by emotions, and adhere to your strategy even during periods of market volatility.
✅ Remember that trading always involves risk, and there are no guarantees of profit. Conduct thorough research, analyze market conditions, and be prepared for various scenarios. Trade only with funds you can afford to lose and avoid excessive risk-taking.

bullish pennant patternAnalysis 🚨
AXS is forming a bullish pennant pattern 📈. If the breakout is successful, the first target will be the green line level 🟩, and the second target will be the blue line level 🔵!
🎯 Targets:
✅ 1️⃣ First Target: Green line level 🟩
✅ 2️⃣ Second Target: Blue line level 🔵

AXIEINFINITYAXIE could be seeing liquidity at 2.44$ after break of weekly demand floor and successful retest confirmation as a broken demand floor is a supply roof and i need more discount on axie and 2.44 is good point of entry

AXSUSDT 1WAXS ~ 1W Analysis
#AXS If you still have a Conviction on this coin, maybe this support you can consider to start buying again from here.

axswe rich!
we rich!
we rich!
I am Batman...
tradingview not letting me post until I write more description...phew!!!

AXSUSDT.P LONGIf the price holds and closes here in hourly chart enter in the trade..
This trade is a bit risky.
If you enter now take your profit at 50%..

TradeCityPro | AXS: Axie Infinity's Play to Earn Dynamics👋 Welcome to TradeCityPro!
In this analysis, I want to discuss the coin AXS, which belongs to the project Axie Infinity. This coin gained a lot of hype during the previous bull run as part of a Play to Earn game.
📅 Weekly Time Frame
In the weekly time frame, we see a very large and long-term range box where the price has been oscillating between 4.221 and 12.610 since late 2022.
🔍 The SMA 99 has even entered the range, indicating a severe ranging market. I do not recommend buying this coin as it has very high inflation, and the coin has a consumptive and reward aspect in the game, leading most users to sell the coin they earn, which is why it has not been able to break out of its range box yet.
🔽 If the price breaks below the support at 4.221, it will be very challenging for AXS as a sharp and heavy drop is very likely, and selling pressure will significantly increase. The only support area below this is at 1.355.
✅ If the price manages to break the resistance at 12.610, the potential for an uptrend increases. The next resistances are at 19.426 and 44.596. The major resistance near the ATH is at 161.591.
📅 Daily Time Frame
In the daily time frame, we can observe the price behavior in more detail. As you can see, there is a descending trend line that has been driving the price downward after reaching a high of 9.534, starting as a correction but turning into a downward movement due to the volume of sales.
🔽 If support at 5.439 is broken, it confirms the end of the uptrend, and the price will return to the box between 4.306 and 5.439. If support at 4.306 is broken, the situation will worsen for AXS as, as seen in the weekly frame, there is no significant support until 1.355.
🧩 Conversely, if the price can regain upward momentum and buying volume enters the market, we can expect the price to rise. The first significant trigger is the breaking of the descending trend line, which could introduce momentum into the market. Breaking above the 50 area in RSI could also assist in this upward movement.
📈The main trigger for a price increase is breaking through 7.366, a risky move, with primary buying triggers at the resistances of 9.534 and 12.610.
📝 Final Thoughts
This analysis reflects our opinions and is not financial advice.
Share your thoughts in the comments, and don’t forget to share this analysis with your friends! ❤️

AXS Price Analysis: The Road to $10, $13, and Beyond 50$The cryptocurrency market is heating up, and Axie Infinity (AXS) is positioning itself as a potential breakout star. Currently trading around $5.70, AXS is showing signs of accumulation, setting the stage for a significant move.
🔎 Market Structure & Key Levels
📊 Support Zone: Strong support is forming around $5.00-$5.50, indicating that buyers are stepping in.
📊 Breakout Zone: A breakout above $7.00 could trigger bullish momentum.
📊 Short-Term Targets: $10 and $13, based on previous resistance and Fibonacci levels.
📊 Long-Term Potential: If momentum builds, AXS could revisit $50-$100, aligning with historical uptrends.
🔥 Why AXS Could Rally in This Bull Market
🚀 Bullish Market Cycle: With Bitcoin leading the way, altcoins like AXS often follow with explosive gains.
🚀 Token Unlock Events: While unlocks can create short-term supply pressure, they also increase liquidity and market participation.
🚀 Smart Money Moves: Institutional investors and whales may accumulate at these levels before the next rally.
🌍 Macro Factors Boosting Crypto
💡 Pro-Crypto Sentiment: The new U.S. administration is leaning towards clearer crypto regulations, which could fuel mainstream adoption.
💡 Institutional Interest: BlackRock’s CEO Larry Fink believes Bitcoin could reach $700,000, suggesting crypto still has massive upside potential.
💡 Growing Adoption: As Web3 gaming gains traction, AXS stands to benefit from increased utility and user engagement.
📌 Investor Takeaway
AXS is currently at a discounted price, making this a strategic entry point for investors eyeing the next bull run. A break above $7.00 could confirm a strong uptrend, paving the way for double-digit gains in the short term and exponential growth in the long run.
🔔 Stay ahead of the market – monitor AXS closely and position accordingly!

AXSUSDT 6DAXS ~ 6D
#AXS Retesting this support would be a very good buying place for now,. Buy in stages with a minimum target of 20%+

AXS/USDT on the Verge of a Breakout?Current Market Context:
The price is consolidating within a descending triangle, with clear lower highs and a flat support zone around $6.20–$6.30.
Multiple Choch (Change of Character) and BOS (Break of Structure) indicators suggest potential trend reversal points.
Volume is slightly declining, hinting at a potential breakout once a decisive move occurs.
Key Indicators:
RSI: Hovering near neutral territory (~49), showing indecision but with room to push higher or lower.
DMI/ADX: The strength of the trend is weakening, but buyers are starting to show subtle dominance over sellers.
MACD: Shows a slight bullish divergence, suggesting upward momentum could develop.
Trade Setup:
Entry: Around $7 (above the descending trendline for confirmation).
Stop Loss: At $6.206 (below key support for risk management).
Take-Profit Zones:
TP1: $10.00 (conservative target based on 70–80% of the range breakout).
TP2: $12.20 (full breakout potential based on the descending triangle's measured move).
Breakout/Breakdown Watch:
Bullish scenario: A breakout above $7.00 accompanied by strong volume confirms upward movement.
Bearish scenario: Failure to hold $6.20 support could push the price toward $5.50–$5.00.
Potential Catalysts:
Monitor Bitcoin's price movements as they heavily influence AXS/USDT.
Watch for fundamental news regarding the Axie Infinity ecosystem or broader market sentiment.
Additional Enhancements:
Add bold annotations to highlight key levels and breakouts.
Use arrows and boxes to make the chart more visually appealing and direct.
Let me know if you'd like further refinements or additional suggestions!

Axie Infinity (AXS)🎯 Introduction
AXS (Axie Infinity Shards) is the native token of the Axie Infinity ecosystem, a popular blockchain-based game operating on the "Play-to-Earn" model. Players can earn AXS tokens by breeding, battling, and trading digital creatures known as "Axies." This token is also used in governance mechanisms, staking, and in-game transactions. The growth in AXS’s value is tied to the ongoing development of the game and its wider adoption within the cryptocurrency world.
📊 AXS Technical Analysis
Current Status:
On the weekly timeframe, AXS is in a long-term range-bound zone:
📈 Range High: Red zone (11.186 - 12.605)
📉 Range Low: Gray zone (3.840 - 4.414)
Key Support and Resistance Zones:
Daily Support: Purple zone (5.581 - 5.932)
This zone has acted as a key support level. If lost, the price is likely to fall toward the lower range (gray zone).
Daily Resistance: Yellow zone (6.910 - 7.328)
Breaking through this level could trigger a price move towards the range high (red zone).
Upcoming Scenarios:
🟢 Bullish Scenario:
If the purple support zone holds and the yellow resistance is broken:
Move towards the range high (red zone).
A breakout above the red zone will lead to price targets based on Fibonacci levels:
🎯 TP1: 20.007 - 24.056
🎯 TP2: 41.929 - 48.315
🎯 TP3: 67.896 - 77.108
Important Note: At each of these targets, profit-taking 💵 is strongly advised.
🔴 Bearish Scenario:
If the purple support zone is lost, the price may drop towards the lower range (gray zone).
🎯 Suggested Entry Points:
Break above the daily yellow resistance with a stop loss below the gray zone.
Break above the red resistance with a stop loss below the purple zone.
Indicators and Volume:
RSI:
Crossing above the midpoint of the RSI may indicate a bullish move.
Entering the Overbought region could lead to sharp upward movements 🚀.
📊 Volume Analysis:
Increased volume during resistance breaks is crucial; otherwise, there’s a higher risk of false breakouts.
📌 Summary:
AXS is currently at a critical level. Price behavior in relation to the identified support and resistance zones will determine the future trend. Effective risk management through stop-loss and close monitoring of trading volume are key to success in trading this coin. 💡
Recommendation: Always consider the overall market conditions and any related news regarding the Axie Infinity project before making trading decisions.

"I'll enter if #AXS supports OB."I'll go long if #AXS supports OB. 4.41% stop-loss, 10X for 44% gain.
Entry: 5.71 - 5.266
Stoploss: 5.228
Target: 9.507
TP1: 6.767
TP2: 7.251
TP3: 8.005
TP4: 8.718
TP5: 9.507

AXIE INFINITYCurrent Market Analysis
1. Price: Axie Infinity (AXS) is currently trading at around $6.
2. Market Sentiment: The overall market sentiment for AXS is neutral to slightly bullish.
3. Trading Volume: The trading volume for AXS has been relatively stable, with no significant spikes or drops.
Technical Analysis
1. Support Levels: The immediate support levels for AXS are at $5.50 and $5.00.
2. Resistance Levels: The immediate resistance levels for AXS are at $6.50 and $7.00.
3. Moving Averages: The 50-day and 200-day moving averages are both trending upwards, indicating a bullish trend.
4. Relative Strength Index (RSI): The RSI is currently around 50, indicating a neutral market sentiment.
Potential Price Movement
Based on the current market analysis and technical analysis, here are some potential price movements for AXS:
1. Short-term (next 24-48 hours): AXS might experience a slight price increase, potentially reaching $6.50-$7.00.
2. Medium-term (next 1-2 weeks): AXS might consolidate around the $6-$7 range, with a potential breakout above $7.00.
3. Long-term (next 1-3 months): AXS has a strong potential to go bullish, potentially reaching $10-$15.
.DO YOUR OWN HOME WORK
GOOD LUCK


Axie Infinity AXS Recommendation and objectivesIn the chart shown for the AXS currency, the appropriate recommendation and targets
We provide free currency recommendations service for everyone
You can view all recommendations on the x platform

AXS in short term!BINANCE:AXSUSDT
AXS is in an ascending triangle, which means the price shall increase soon!
It can reach the Shown Resistance on the chart!
⚠️ Disclaimer:
This is not financial advice. Always manage your risks and trade responsibly.
👉 Follow me for daily updates,
💬 Comment and like to share your thoughts,
📌 And check the link in my bio for even more resources!
Let’s navigate the markets together—join the journey today! 💹✨

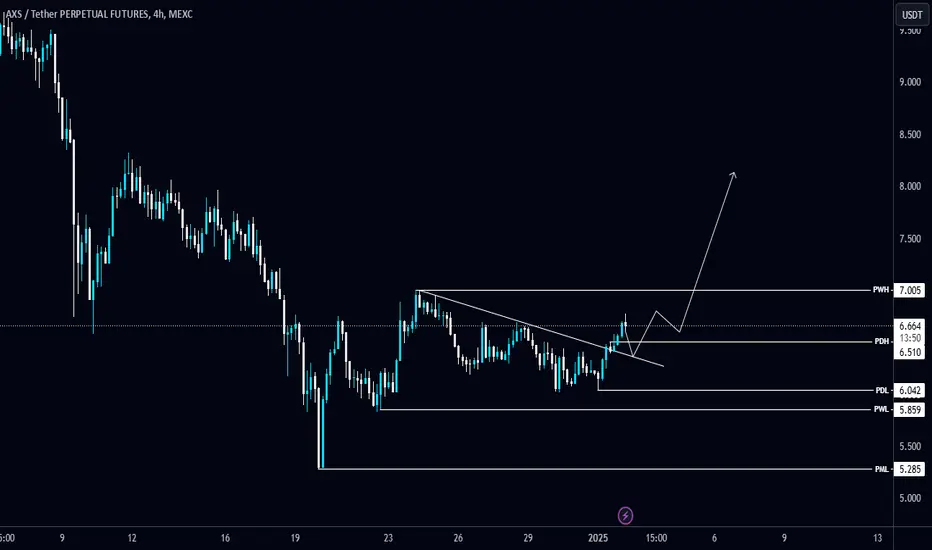
$AXS/USDT Analysis#AXS has broken the Diagonal Trendline in the 4-Hour TF!
✅ Plan: Consider longing NYSE:AXS on a successful retest.
🔑 Key Levels:
Local Support: PWL $5.86
Local Resistance: PWH $7
AXS-4h- Accumulation RangeAXS-4h- Accumulation Range
REMEMBER that a lot of investors sell stocks or crypto for fiscal conditions in 2024 to close the year.
For that, we have low buy liquidity , and even with that pressure on the price , AXS is trying to remaning in the same range as 1 week ago, so a breakout can restart a new HH , so patience.
Im bullish on AXS if 7.0 will be broken and confirmed as support.

#AXS (SPOT-INVEST) IN (4.500- 6.300) T.(60) SL(4.269)BINANCE:AXSUSDT
#AXS / USDT
Entry ( 4.500- 6.300)
SL 3D candle close below 4.269
T1 10.000
T2 22.000
T3 37.000
T4 44.000
T5 60.000
3 Extra Targets(optional) in chart, if you like to continue in the trade with making stoploss very high.
______________________________________________________________
Golden Advices.
********************
* collect the coin slowly in the entry range.
* Please calculate your losses before the entry.
* Do not enter any trade you find it not suitable for you.
* No FOMO - No Rush , it is a long journey.
Useful Tags.
****************
My total posts
www.tradingview.com
1Million Journey
www.tradingview.com
www.tradingview.com
**********************************************************************************************
#Manta #OMNI #DYM #AI #IO #XAI #ACE #NFP #RAD #WLD #ORDI #BLUR #SUI #VOXEL #AEVO #VITE #APE #RDNT #FLUX #NMR #VANRY #TRB #HBAR #DGB #XEC #ERN #ALT #IO #ACA #HIVE #ASTR #ARDR #PIXEL #LTO #AERGO #SCRT #ATA #HOOK #FLOW #KSM #HFT #MINA #DATA #SC #JOE #RDNT #IQ #CFX #BICO #CTSI #KMD #FXS #DEGO #FORTH #AST #PORTAL #CYBER #RIF #ENJ #ZIL #APT #GALA #STEEM #ONE #LINK #NTRN #COTI #RENDER #ICX #IMX #ALICE #PYR #PORTAL #GRT #GMT #IDEX #NEAR #ICP #ETH #QTUM #VET #QNT #API3 #BURGER #MOVR #SKL #BAND #ETHFI #SAND #IOTX #T #GTC #PDA #GMX #REZ #DUSK #BNX #SPELL #POWR #JOE #TIA #TFUEL #HOT #AVAX #WAXP #OGN #AXS

#AXS/USDT#AXS
The price is moving in a descending channel on the 1-hour frame and is expected to continue upwards
We have a trend to stabilize above the moving average 100 again
We have a descending trend on the RSI indicator that supports the rise by breaking it upwards
We have a support area at the lower limit of the channel at a price of 6.71
Entry price 6.73
First target 6.90
Second target 7.06
Third target 7.20

FREE SIGNALHello guys
After the bottoming, this coin was able to hit its weekly resistance, and now, considering the pullback it has made, it is a good time to buy it for the goals we specified for you.
Be successful and profitable.

AXS Fakeout Super TrendlineFakeout is indicating someone manipulate price to buy at some point
But currect condition when i post still below redline
Add to your watchlist and wait till create some chop in this moment before taking position
But maybe its push upward cz wick or will go down to fill in wick
