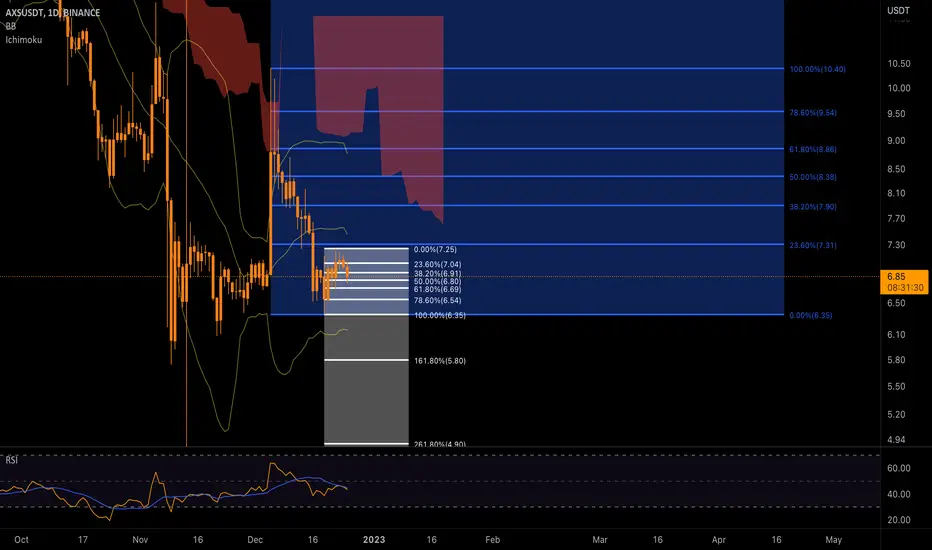
AXS - We expect a negative reaction in the low timeframesAXS has been trending lower over the past week, breaking its support in the $6.4-$6.5 range, and has hit a previous low on the daily time frame. This support, which is related to the daily time frame, is the place where the trend changes from bearish to bullish and can bring a positive reaction again, which includes the price of $5.35 to $5.85.
In the last 50 days, a positive reaction has been observed from the same range, so it is still valid. Confirmation of the reaction and reversal requires price stabilization at this level and signs of a trend change in the 4-hour time frame. Strong bullish candles are still not observed in the 4-hour timeframe. And one of the minor resistance ranges is at $6.20 USD. If the price hits this resistance, we expect a negative reaction in the low timeframes. In general, in the best case, we can expect a range trend between the considered levels for the next week.
AXSUSDT trade ideas

AXSUSDT Trading opportunityAXS completed SHS target and failed to hold $12 support area. The breakdown of the zone resulted to major damage to the market ecosystem with $12 become very strong supply zone.
Our major plan is to Accumulate within only given range of demand zone. This may take some time but worth waiting for long term perspectives.

SHORT SHORT SHORT SELLL SELLL SELLLLL TARGET ZERO ,usd interest too high buy more it will go to zero


Axie Infinity (AXS) Price Rallies 33% Axie Infinity (AXS) Price Prediction 2022
Axie Infinity (AXS) holds the 56th position on CoinGecko right now. Axie Infinity price prediction 2022 is explained below with a daily time frame.
The above chart of Axie Infinity (AXS) laid out a Descending Channel pattern. Descending Channel also known as the falling channel. A descending channel is formed by two parallel trendlines. The upper trendline, which joins the highs, and the lower trendline, which joins the lows, run parallelly downwards. This pattern is the characteristic of a bearish market.
Currently, Axie Infinity (AXS) is in the range of $9.15 If the pattern continues, the price of Axie Infinity might reach the resistance levels of $18 and 27. If the trend reverses, then the price of Axie Infinity may fall to $5.69

AXS - Technical review and analysisAs long as the bottom of the channel is maintained at $6.80, the price of AXS can rise again. But in case of failure of the current support, we can expect the price to hit the floor of the previous support to the range of $6.40 to $6.55. The short-term target will be in the range of $7.5 to $7.7 if the channel is maintained.
AXSUSDTThe moving averages gave two conformations and entry signals for a sell, The n-wave formation is also on its last leg. TP is marked by the fib extension tool. MACD activated a continuation sell signal with correlates with the 3 moving averages.

AXSVery simple ... Very clear!
Everything is marked on the chart.
This is my personal opinion. Please do not trade based on my analysis and data.


AXS/USDT in a Decisive Phase, May Drop by 50% Soon!Much similar to other cryptos, Axie Infinity also witnessed a steep descending trend before the beginning of 2022. The price underwent a magnificent rally in during Q4 2021 and marked highs beyond $166. Woefully, the price has dropped by more than 96% during the bear market which followed immediately after it marked its highs.
The AXS price approached the pinnacle of the bearish consolidation and raised high. Presently, the price is undergoing a correction and hence a fresh descending trend may be ignited very soon.
As mentioned the AXS price is in a decisive phase. With a breakout above the bearish triangle, the token manifested its strength and an attempt to nullify the bearish impact. However, the fresh plunge manifesting a minor correction has raised many concerns. Two possible scenarios may be framed for the current trade setup, either the price bounces hitting the trend line of the triangle and rise high or else drop and enter the triangle again and undergo a massive drop by testing the lower most support to trigger a rebound.
Therefore, the upcoming few hours could be extremely crucial for the AXS/USDT price.


AXSUSDT | BREAKOUT...AXS has been trading under the falling resistance. The price has broken above the resistance.
Now bulls need to hold the breakout zone.
Manage your trades accordingly.

AXS/USDTBuy some AXS in nice dip . should be pump soon . break out confirmed in 4h chart . 24$ is target

Axs so LONG !!!this chart is 12 month chart of axs🤣
in weekly chart you can see a break out and a double bottom pattern.
the 1st target is 10 !
im gonna long it

AXSUSDTForming Descending broadening wedge h4 Timeframe
Incase Of breakout expecting massive bulish wave


AXS Short setupHello traders!
Welcome back to another episode with Analyst Aadil1000x.
Today we are setting sell limits at a very old True reversal point. It worked multiple times and it has the strength to work a few more times.
Trade # 023
AXS Sell limit 7.033
Stoploss 7.103(-1%)
Target 1, 6.85(+2.7%)
Final Target 6.59(+6.3%)
Don't forget to hit the like button and follow to stay connected.

LONG IT NOW(axsusdt)a magnificent growth is coming by 8 hours
long it now and take 160 percent profit.
ENTRY:7.4~7.6
TARGET:10
STOPLOSS:7
(5X Long)

Trading opportunity for AXSUSDTBased on technical factors there is a Buy position in :
📊 AXSUSDT
🔵 Buy Now 7.67
🧯 Stop loss 6.60
🏹 Target 1 10.00
🏹 Target 2 12.87
🏹 Target 3 16.67
💸RISK : 1%
We hope it is profitable for you ❤️
Please support our activity with your likes👍 and comments📝

AXS/USDT Short term long setup for crypto pair this is created by crypto powerful signal group admin

#Axs | #USDTLONG | Limit Order | R/R : 5
Limit : 6.67
Stop loss : 7.57
Target 1 (Risk Free) : 7.77
Target 2 : 8.17
Don't risk more than 3% of capital.

AXSUSDT | FALLING WEDGE BREAKOUTAXSUSDT has been trading within a falling wedge.
Now the price has broken above the falling wedge and as well ave the key horizontal resistance.
The bulls need to hold the support zone.
While bears will be in control only break below the support.
Manage our levels accordingly.

#AXSUSDT🚨Signal Type🚨: 🟢 LONG
💫Leverage: Cross (5X - 20X)
🎪Entry Targets:- 7.900-7.930
🎯Profit Targets:
👑Tp1 :- 8.000
👑Tp2:- 8.100
👑Tp3:- 8.200
👑Tp4:- 8.300
👑Tp5:- 8.500
❌Stop Targets:7.700
Signal by : 🇱🇰 @EshangaThejanBandara☎️
