AXS in free fallI don't know what happened with this coin, but it lost almost all of the HTF support. it is not even near an area that would make me interested to buy for the long term. I expected it to fall as low as 3 dollars. but now it had some kind of reactions that may it indicate a possible range is forming before another leg down. so market structure changed in 4h. when it pulls back to 12h OB and the Golden pocket I would long. anywhere between 8.4/8.7 is good for buying. stop below the low. target the previous wick low that was put in before break down.
AXSUSDT trade ideas

Axie Infinity AXS to $8 - Swing trade opportunity.On the above 1-day chart price action has increased 380% in 15-days. That’s amazing. There is now a number of reasons to be bearish in the short term:
1) While the ‘great sell’ signal has not yet triggered it is in the post, the little blue triangle above price action tells me that. Look left.
2) Price action is well outside the upper Bollinger Band (not shown here) it will collapse to the mean, which is currently at $6.70.
3) When RSI was at the current levels (green circles) price action collapsed 40%.
Easiest swing trade ever.
Good luck!
WW

AXS looks juicy for a pumpAXS looks juicy for a pump, we are sitting in good areas, if AXS flips get ready to long it!

AXS UPDATEIn Axs, I went to update the measurements of wavelengths in my previous drawing, based on this, I updated the 5-fold drop of the z wave again.

AXS will go against the market!Hello, everyone!
Recently I showed you the very low targets for altcoins and the Bitcoin. Today I wanna show you the asset which is very closed to it’s bear market bottom. Axie Infinity have the unique wave structure and have already reached the very important level.
On the 1D timeframe of the AXSUSDT chart we can see that AXS started it’s last bearish global wave earlier than Bitcoin and other coins. Thus it has formed the wave 2 earlier and we can measure the target for the wave 3. If you remember on the other altcoins the wave 3 reached 1.61 Fibonacci, the classical target. On the AXS wave 3 is extended and reached almost exactly 2.61 level. Now I anticipate the corrective wave 4.
Taking into account the fact that wave 2 retraced too much, almost hit the wave 1 start, wave 4 should retrace no more than 0.38 Fibonacci, approximately $12.6. Anyway it is not forbidden for AXS to reach 0.61 Fibonacci level and retest the broken trendline, but in my opinion it looks fantastic. After wave 4 I expect the trimmed wave 5 because wave 3 was extended. I will make an update when will be time to buy. Now you can trade Axie only locally with the target $12. If you are not satisfied with such potential reward – just skip this trade.
Best regards, Ivan

🔥AXIE INFINITY unlock 21.5M coins: almost 100% profitable trade🔥 Hi friends! A few days ago AXIE start to unlock the coins for it's early investors. 21.5M coins that worth almost $200M flow into exchange to SELL but as we can see there is no huge DUMP as 99% of traders expect. On the contrary, price start to grow with entire crypto market.
✅ I think this event misslead the last AXS holdlers which sold their coins before the event. Of course, the BIG PLAYERS accumulate all these volume.
📊 The main reasons/preconditions to open a long:
🔥 the first trigger is the no DUMP despite the bearish event with coins unlock
🔥 a lot of short traders which become the fuel for growth
🔥 squeeze to the trendline+volume growth before the trendline breakout
🔥 bullish BTC
📊 The main targets for AXIE:
1. $11.3 - the key level
2. $12.2-13 - the value area
2. $13.8-14.8 - the value area
✅ Why I set so BIG targets?
All the crypto market in the bear market for the last 1 year, a lot of short traders open their positions then and now before this event. I think they might become the FUEL🔥 for this growth and PUMP the price so hard because of short liquidations.
🚩 Traders, book the profit by parts and don't forget to spend this money on your education, relax, trips or on family. Trading is for making money and not about sitting in front of the screen 24/7.
💻Friends, press the "boost"🚀 button, write comments and share with your friends - it will be the best THANK YOU.
P.S. Personally, I open an entry if the price shows it according to my strategy.
Always do your analysis before making a trade.

long entryafter the bearish trend hammer is formed along with 3 white soldiers
trend reversal can be seen suggesting a long entry

I have doubled my AXS position @ 9.325 USDTSee previous trade. We're about to hit a local area of resistance.

AXS Short @ 9.075 10x leverageThis is a scalp trade I'm initiating.
Momentum is starting to consolidate and we're topping out in this region. I will potentially add onto this position over the next hour.
I do not see us holding the support of the 200-day EMA.
We are well above our Ichimoku cloud of support.

AXS 4H bottom4H AXS seems to test the bottom:
- a big crab is expected between 6.9 and 8.2
- a parallel channel turned to be a sharper one
- a Fib extension gives 1.0 at 8.2, where it is bouncing up
- looking forward a dip crossing the reversal region

Axs currency in areas for investment now and long-term storageThe axs currency after assembly will know a rise to the areas of 28.30 dollars, and if it is correct above these areas, we will see it in the prices of 77.10 dollars or more

Short AXS
AXS is one of the first and the biggest play-to-earn cryptos.
Will it come back to where it'd started its rally last year to made x30 times in just a few months?
AXS is loosing its long-term weekly trendline. Although we will need some days to confirm this break-down but we can short AXS here because in 2D TF, AXS's already broken the local trendline.
Moreover, the MFI has also broken the trendline showing that buyer's sentiment is no longer good to prevent it falling more.

🔥 AXS Dying Quickly: Where's The Bottom?A couple of weeks ago I made an analysis on AXS where I discussed the bear-flag pattern it was trading in. After a final break out of the support area AXS fell quick and has reached both of my bearish targets.
In my view, AXS can still fall further and the bottom is not in yet. I'm looking at a $6.5 target for the coming weeks, potentially even $3.5 if we're going to see some kind of capitulation. $3.5 would make a decent case for a bear market bottom, but we'll see by then.

AXS | Gaming Crypto Play | Good EntryWhat Is Axie Infinity (AXS)?
Axie Infinity is a blockchain-based trading and battling game that is partially owned and operated by its players.
To learn more about this project, check out our deep dive of Axie Infinity.
Inspired by popular games like Pokémon and Tamagotchi, Axie Infinity allows players to collect, breed, raise, battle and trade token-based creatures known as Axies.
These Axies can take various forms, and there are more than 500 different body parts available, including aquatic, beast, bird, bug, plant and reptile parts. Parts from each type class come in four different rarity scales: common, rare, ultra rare and legendary — and Axies can have any combination of body parts, making them highly variable and often rare and unique.
Each Axie is a non-fungible token (NFT) with different attributes and strengths and can be entered into 3v3 battles, with the winning team earning more experience (exp) points that are used to level up an Axie's stats or evolve their body parts. These Axies can be bred together to produce new and unique offspring, which can be used or sold on the Axie marketplace.
The Axie Infinity ecosystem also has its own unique governance token, known as Axie Infinity Shards (AXS). These are used to participate in key governance votes and will give holders a say in how funds in the Axie Community Treasury are spent.

AXSUSD SHORTPossible bearish movement of the pair. The price is currently in a trading zone with significant volume , with rejections at the top of the price right at the 55 period EMA , which is essential in my strategy for analysis of possible trend continuations. We also see significant development in the Squeeze momentum indicator and macd histogram monitors, with directionality changes to bearish confirmed. We see the attached ADX indicator entering below the 23 level line (0 point of the MACD histogram), indicating the weakness of the previous move higher as it bounced towards the 55 period EMA , to continue falling as the moves have indicated. previous; along with a possible sell signal pattern coming soon on the MACD lines. There could be a continuation of the downtrend.
If you are going to take my opinion into account, please respect the projection time, this is extremely important. If it is not fulfilled in the foreseen time and it makes a range, it will be better to close the operation in case it is possible.

axs coin more dump comming?AXS/USDT 4h time frame update :-
AXS Coin currently trade around 8.7$. (Under high pressure) cauze some bad news about axie infinity projects.
Till 25 october we are in bearish mood on axs coin but high volitily expected under this project so some small trade possible.
Like took trade below 8.5$ for some quick profite.
And 2nd trade took below 8$.
Before 25 october don't buy it in spot trade do trade with proper risk management⚠
follow me for more updates.
Remining things i update you time by time🙃

AXSUSDT | BULLISH PARALLEL CHANNELAXSUSDT has been trading in bullish parallel channel .
The price has approached to the upper boundary of channel.
The price has previously too approached to boundary and get rejected.
The bulls need to break above the channel.
Manage your trades accordingly.

AXS H4 BULLISH WAVE COUNT SCENARIOThis is a bullish wave recount scenario for AXS (previous count has been invalidated); this analysis is void if price managed to break and closed below the INVALIDATION LINE. Wave C is expected to settle around the 50 - 61.8 Fibonnaci area. Trade at your own risk NFA.

AXIES DUMP INFINITY PONZI COLLAPSEAxie Infinity is a pyramid scheme collapsing.
That's a Ponzi in the collapse phase. Their Smooth Love Potion token is down 90% and in a screaming dive, and their Axie token is down more than 90% from peak. That one is going to hurt a lot of poor people in the Philippines. Many quit their jobs to play Axie's play-to-earn game. All the money comes from later entrants, so it's a Ponzi by definition.
Stay safe

🔥 AXS Holding: For How Long?AXS is one of the weakest alts of the last couple of months, making new lows while the majority of coins is still above their June lows.
After breaking out of the bear flag , AXS has one more obstacle to clear before we can move down, which is the purple Area of support.
A daily close below this area will most likely be the starting signal for more bearish price action. Be patient for the break out. Targets placed at $10 and $9, which is an area of demand from over a year ago.

AXSI think that the possibility of a downward z wave after the end of a bearish triangle is strong. The end of this bearish channel that I have drawn may not be a bullish harbinger for us. I think it will give us better clues about the criterion of the behavior here.

AXS - AnalysisAXS had a range trend over the past week. The currency's price is hovering in the support zone of $12.5 for the third week, and the short-term descending channel intended for it is still standing. The ceiling of this descending channel in the resistance range of 13-13.5 dollars can still be accompanied by a reaction. For the short term, if the minor resistance in the range of $12.50-$12.65 is broken to the upside, and the 4-hour candles stabilize above this area, we can expect the price to break out of the descending channel.
Otherwise, the further price reduction can continue up to the support range of $11.8. If the ceiling of the descending channel breaks above the specified resistance range, the first target of buyers can be considered in the resistance range of $13.7-14. The second target is the resistance of $15, which can be associated with a negative reaction.
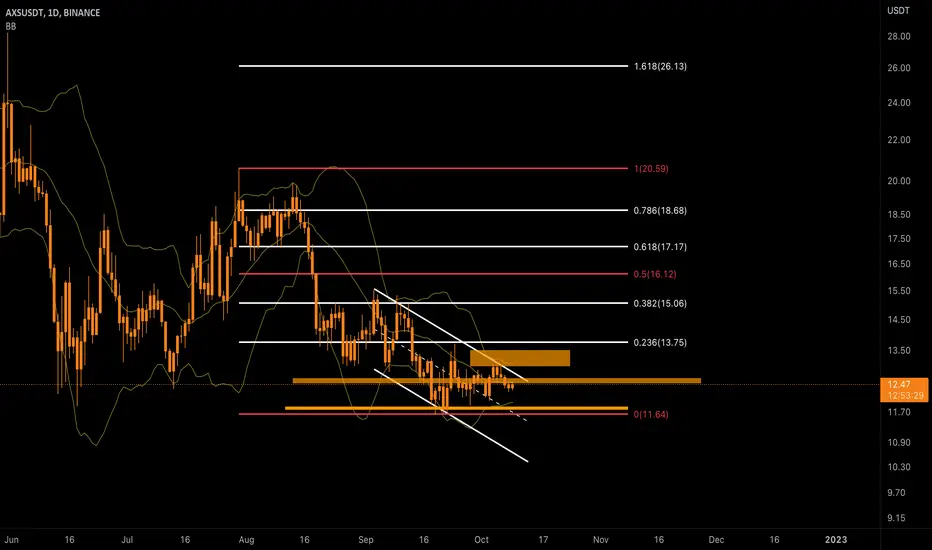
AXSUSDT needs liquidity to create the breakout!The price is in the consolidation phase above the daily support at 12.40$ and the market is trying to have a breakout from the descending channel
How to approach it?
IF the price is going to have a clear breakout from the static resistance, According to Plancton's strategy , we can set a nice order
–––––
Keep in mind.
🟣 Purple structure -> Monthly structure.
🔴 Red structure -> Weekly structure.
🔵 Blue structure -> Daily structure.
🟡 Yellow structure -> 4h structure.
⚫️ black structure -> <= 1h structure.
–––––
Follow the Shrimp 🦐
