[AXS] AXIE INFINITY could rise up (+118%) to (+165%)AXIE is trying to break an accumulation for the last two years, a falling channel pattern, poc and vah from sep 2022 to now and trying to get above anchored vwap from jan 2022, momentum is shifting to upside and moneyflow increasing in the higher timeframes. If it could close a monthly candle above $9.70 will suggest an increase up to jul/aug 2022 highs. The target is between montly level, fibonacci retracement level and the falling channel pattern target.
TARGET: $48.13 TO $63.44 up to (+165%)
AXSUSDT trade ideas

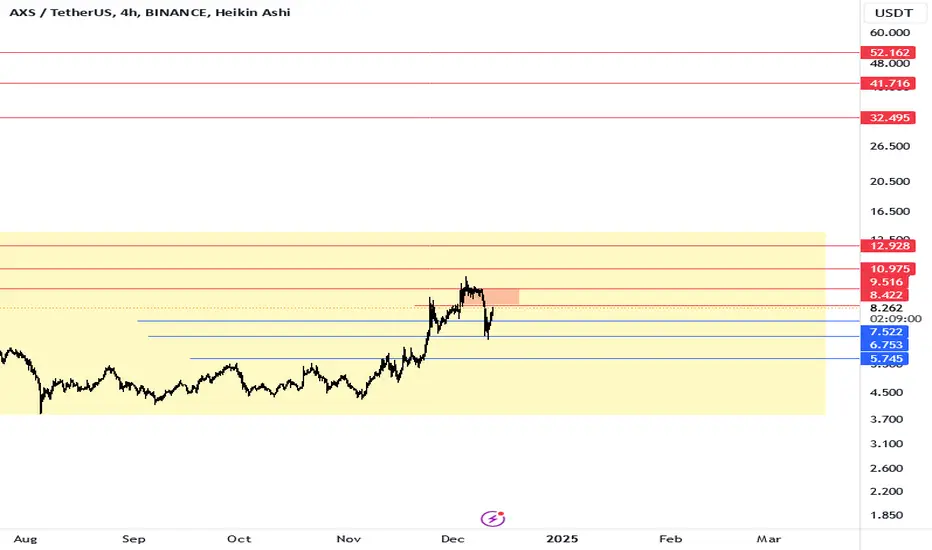
axsWell, first, it has a resistance in the red box and I'm waiting to see if it wants to return to the blue lines. In the second stage, we have two more lines that still keep us in the yellow box. After that, if we want to get out of the box, the numbers above will be activated. It's a good option. You can watch its movements.
$ AXS | How do I expect to see AXS in coming weeksLet’s dive into another crypto asset analysis from the gaming sector to see if it has any chance to make us more money. This time I picked Axie Infinity with the AXS ticker. Most have heard of this famous project, but for those who have not known about the project, here is the CMC info on BINANCE:AXSUSDT
Axie Infinity is a blockchain-based trading and battling game that is partially owned and operated by its players.
Inspired by popular games like Pokémon and Tamagotchi, Axie Infinity allows players to collect, breed, raise, battle and trade token-based creatures known as Axies.
These Axies can take various forms, and there are more than 500 different body parts available, including aquatic, beast, bird, bug, plant and reptile parts. Parts from each type class come in four different rarity scales: common, rare, ultra rare and legendary — and Axies can have any combination of body parts, making them highly variable and often rare and unique.
Each Axie is a non-fungible token (NFT) with different attributes and strengths and can be entered into 3v3 battles, with the winning team earning more experience (exp) points that are used to level up an Axie's stats or evolve their body parts. These Axies can be bred together to produce new and unique offspring, which can be used or sold on the Axie marketplace.
The Axie Infinity ecosystem also has its own unique governance token, known as Axie Infinity Shards (AXS). These are used to participate in key governance votes and will give holders a say in how funds in the Axie Community Treasury are spent.
BINANCE:AXSUSDT
Market Cap: $ 1.45 B
Market Cap Rank: 95
Market Price: 9.31 $
ATH: $ 165 (-94%)
ATL: $ 0.1234 (+7414%)
Technical highlights:
- W1:
Trend:
Price has been in a parallel channel for 800 days. We had the last LL in Nov.2022 at $ 4. After that price tested that level twice and both times bounced. Price managed to break local resistance level from $ 6.00 to $ 6.6 with sharp candle and good volume. That was a clean break through but price remains in the parallel channel. The point is, price trend from downtrend turned to sideways and many times (not all times) sideways after a long downtrend means accumulation phase. Still we need to check volume and I checked OBV. OBV increased in this sideway phase (769m to 885m) so people bought more in this 800 days.
the next hints.
MA: Price holding above MA20 in monthly time frame. In the weekly time frame, MA20 located below MA50 but with the help and support of MA20, price jumped above MA50 at $ 6.94. MA50 acted as support and been tested successfully last week. On the other hand, in the daily time frame, price hovers above MA20, 50, and 200 and says bulls are in control.
RSI: The value is around 67.9 and is strong in the weekly time frame, which supports the local bullish trend direction. The RSI value in the daily time frame is 68 and it’s almost at the same value of W1. The difference is the RSI in D1 turned into overbought twice and printed a bearish divergence. So, I think there will be a cooldown before any major growth for a healthier growth.
Stoch RSI: The Stochastic RSI in W1 is in the overbought zone. That’s another reason to expect a retracement.
The Darvas Box:
Charts sometimes create patterns with repeating results. That’s why we use them to predict the next move of the trend. In the accumulation phase, there are many patterns that can help us earn profit by following them, but most of them need to be observed and backtested every day to see if they’re still working and reliable. The Dravas box is one of the patterns that can be seen in accumulation periods. Simply put, it’s a sideways (trend must clarify the range high and low) move that eventually breaks above the 52-week high with increased volume. In this chart, the price is still located below the 52-week high ($13.5) and it is still early to call it a box, but if that happens anytime, then the price will most of the time increase for days.
In addition to volume increase, we must observe the absorption of supply at 52 weeks' high. Meaning the price needs to stick right below that level for a few days before the breakout, and it’s better to see OBV increase for more confirmation.
Gaming tokens are still underwater and haven’t moved like other assets like MEME coins, but I believe this is a good time to pick some of the best gaming tokens with real use cases and a well-known team.
In my point of view, channels play an important role in trend direction and targets.
Supports:
$ 8.00 at Ma20 in D1
$ 7.00 at Ma50 in W1
$ 6.00 last known resistance break
Resistances:
$ 10.7 D1 Supply zone
$ 13.50 Range high / 52 weeks high
$ 19.00
$ 23.00 MA200 in W1
$ 45.00
$ 65.00 W1 local high
$ 100 W1 supply
Conclusion:
All these opinions are mine and can be wrong, so please DYOR.
This token is one of the best gaming token with many users and strong community. I will buy partially on the possible pullback. Please always do the risk management.
** In addition to the volume increase, we must observe the absorption of supply at the 52-week high. This means that the price needs to stick right below that level for a few days before I need more energy to carry on, which is provided by your support. Don't forget to hit boost, share, and comment on your point of view with me. **
My strategy goes as below:
🛒 Pair: AXS/ USDT 🛒
👑 Bitcharge 👑
🕰 08/12/2024 🕰
POSITION: 🟢"Buy"🟢
2 % of capital
🛒 Buy: $ 9.3 (10%) – $ 8 (20%) – $ 7 (30%) - $6 (40%)🛒
👉Sell Targets👈
🎯TP1: $ 10.6 🥉
🎯TP2: $ 12 🥈
🎯TP3: $ 13.4 🥇
🎯TP4: $ 15 🚁
🎯TP5: $ 17 ✈️
🎯TP6: $ 19 🚀
🎯TP7: $ 23 🛰
🎯TP8: $ 33 🛰
🎯TP9: $ 45 ✨
🎯TP10: $ 55 ⭐️
🎯TP11: $ 65 💫
🎯TP12: $ 75 🪐
🎯TP13: $ 85 🌞
🎯TP10: $ 98 ⭐️
🎯TP11: $ 110 💫
⛔️ SL: $ 5.10 ⛔️ by closing W1 Below
--Stay rich--


$AXS SHORT IDEA
After the desired growth, the AXS coin is now in a resistance zone. Based on the movements of Tether dominance and Bitcoin dominance, I decided to open a short position on this coin. Target and stop-loss information is in the image. I hope it brings good profit.

Beautiful AXS chartThe double bottom reversal pattern is evident on the chart.
It will give good profit soon.

HiLoCh 15MHiLoCh 15m - reliance on cipher
1. 3 drives down from the break
2. High vol and b Vol profile on the candle.
3. cipher is OS
got the alerts / triggers, cipher and RSI good, nice b vol pattern and nice level reclaim.

HiLoCh triggerHiLoCh 15m - - reliance on cipher
1. 3 drives down from the break
2. High vol and b vol profile on the candle.
3. cipher is OS
4. swept and reclaimed level
got the alerts/triggers, cipher and RSI good, nice b vol pattern on the candle and nice level reclaim.

#AXS Axie infinity also looking good on monthly
though many are looking interesting be sure not to risk more than 1% per setup, alts are not doing well against BTC at least for now. once we start seeing some breakouts you can add on size

#AXS (SPOT) entry range(4.170- 5.150) T.(9.190) SL(4.096)BINANCE:AXSUSDT
entry range (4.170- 5.150)
Target1 (6.660) - Target2 (8.370)- Target3 (9.190)
1 Extra Targets(optional) in chart, if you like to continue in the trade with making stoploss very high.
SL .1D close below (4.096)
*** collect the coin slowly in the entry range ***
*** No FOMO - No Rush , it is a long journey ***
**** #Manta ,#OMNI, #DYM, #AI, #IO, #XAI , #ACE #NFP #RAD #WLD #ORDI #BLUR #SUI #Voxel #AEVO #VITE #APE #RDNT #FLUX #NMR #VANRY #TRB #HBAR #DGB #XEC #ERN #ALT #IO #ACA #HIVE #ASTR #ARDR #PIXEL #LTO #AERGO #SCRT #ATA #HOOK #FLOW #KSM #HFT #MINA #DATA #SC #JOE #RDNT #IQ #CFX #BICO #CTSI #KMD #FXS #DEGO #FORTH # AST #PORTAL #CYBER #CLV #RIF ENJ #ZIL #APT #MAV #ZRX #ID #AXS ****

AXSUSDT | Mapping Out Possibilities | Mid Term (1D)AXSUSDT | Mapping Out Possibilities | Mid Term (1D)
As part of my profit taking strategy, I like to go through and map out potential levels of interest based on semi-bullish to very bullish mock up price action using fractals and fibs.
Based on concept of money flow... BTC, then ETH, then Large Caps, Then Mids and Smalls, I am personally heavier skewed loaded up on mid to small cap coins with bullish chart setups and high profit potentials.
Additional altcoin near term and midterm chart ideas listed below.
CHZUSDT | Mapping Out Possibilities | Mid Term (1D)
OGNUSDT | Buy Now, Thank Later | Near Term (4HR)
XCHUSDT | Buy Now, Thank Later | Near Term (4HR)
VRAUSDT | Buy Now, Thank Later | Near Term (4HR)
CSPRUSDT | Buy Now, Thank Later | Near Term (4HR)
PERPUSDT | Buy Now, Thank Later | Near Term (4HR)
TLMUSDT | Buy Now, Thank Later | Near Term (4HR)
DODOUSDT | Buy Now, Thank Later | Near Term (4HR)
LPTUSDT | Buy Now, Thank Later | Near Term (4HR)
VRAUSDT | Buy Now, Thank Later | Near Term (4HR)
XCHUSDT | Buy Now, Thank Later | Near Term (4HR)
CSPRUSDT | Buy Now, Thank Later | Near Term (4HR)
VELOUSDT | Buy Now, Thank Later | Near Term (4HR)
UMAUSDT | Buy Now, Thank Later | Near Term (4HR)
OGNUSDT | Buy Now, Thank Later | Near Term (4HR)
DOTUSDT | Buy Now, Thank Later | Near Term (4HR)
VIDTUSDT | Buy Now, Thank Later | Near Term (4HR)
BTCUSDT | Alts Poised to Explode | Near Term (2H)
Mock Up Price Action for ALGOUSDT | Mid Term (12HR)
MYRIAUSDT | Interested to see where this goes | Mid Term (2D)
Mock Up Price Action for VRA w/ Timeline | Mid Term (3D)
Mock Up Price Action for XCH | Mid Term (12HR)
OGNUSDT | Interested to see where this goes | Mid Term (3D)
Mock Up Price Action for CSPRUSDT | Near/Mid Term (2D)
VIDTUSDT | Interested to see where this goes | Mid Term (3D)
RAREUSDT | Interested to see where this goes | Mid Term (3D)

1 Day time frame long positionlooking for a breaker block and retest of that zone to enter a long position.

Long trade
4Hr TF entry
Buyside trade idea
Pair AXSUSD
Wed 27th Nov 24
5.15 am
Tokyo to LND Session AM
Entry 7.402
Profit level 8.288 (11.97%)
Stop level 7.256 (1.97%)
RR 6.07
Reason: Observation of price action reaching a pivotal demand zone since 27th Nov 24

#AXSUSDT #1D (Bybit) Big falling wedge breakoutAxie Infinity regained 50MA support after a long downtrend, looks ready for mid-term recovery towards 200MA resistance.
⚡️⚡️ #AXS/USDT ⚡️⚡️
Exchanges: ByBit USDT
Signal Type: Regular (Long)
Leverage: Isolated (2.0X)
Amount: 4.6%
Current Price:
5.202
Entry Targets:
1) 4.854
Take-Profit Targets:
1) 6.947
Stop Targets:
1) 3.805
Published By: @Zblaba
NYSE:AXS BYBIT:AXSUSDT.P #Axie #NFT #P2E axieinfinity.com
Risk/Reward= 1:2.0
Expected Profit= +86.2%
Possible Loss= -43.2%
Estimated Gaintime= 1-2 months

AXS could reach $17The first target for BYBIT:AXSUSDT.P is $8.5, and if market conditions strengthen on the demand side, it could rise up to $17.
The current phase might still be a consolidation. A significant increase in momentum is necessary. If this momentum is enough to push price above $6.5, the direction will continue upward.

AXSUSDT Rectangle PatternAXSUSDT Breaks Out of Rectangle PatternAXSUSDT Technical Analysis update
AXSUSDT has formed a rectangle pattern at the bottom near its major yearly support level. The price has broken the rectangle pattern resistance on the daily chart, indicating a potential bullish move from the current level. The price is trading above the 100 and 200 EMAs on the daily chart, with a noticeable rise in volume in recent candles is also considered strongly bullish.

Axie Infinity 800% Beach-Lifestyle Target ExplainedI am not even going to track it... Just call me back when it hits 800.
Good morning my fellow trader, we are looking at Axie Infinity and as I say, this is easy trading. I am just going to buy, set the sell order on target for 800% profits and throw the computer away. I am going to be at the beach 24-7 until I get the alarm on the phone. When the alarm comes in, I know the profits are in. Easy.
I hope you are having a wonderful start to this week.
➖ AXSUSDT is truly trading at bottom prices. This is not the lowest but there is no intention nor need to catch the exact bottom on the way down, as there is no intention nor need to catch an exact top on the way up. We just need near to the bottom and near to the top. Support and resistance.
➢ We buy at support when prices are low.
➢ We sell at resistance when prices are high.
Pretty simple I should say... Don't you agree?
I like this chart, I like this pair and I would like to see it green.
I have to wait though... Patience is key.
I'll be back in six months.
Thank you for reading.
Your support is truly appreciated.
Namaste.


#AXS/USDT breaks the Diagonal Trendlin in 1-Hour TF!#AXS/USDT breaks the Diagonal Trendlin in 1-Hour TF!
NYSE:AXS needs to retest the trendline to turn bullish. Wait for a successful retest to open a long position. The local resistance level is PWH $5.76.

Axie Infinity, AXS, 0.5Fib retrace sets up 179x Algo targetIDK about this one... last all time high was $166 for a mc of 10b. this time supply is 3x that and the algo target is $955 giving a mc of 146b... not sure about you but that seems a bit extreme to me. not impossible, just extreme.
I'm actually surprised by axs, I thought this would go to zero. But to retrace and triple bottom on the 0.5Fib, that suggests strength... maybe I overlooked something. anyone have a theory why this is so strong?
See linked BTC chart for why my charts are so bull.
The Trade:
Preferred Entry: $4.08 retrace of this impulse wave (if we get one)
Ape Entry: $5.34
Stop: $3.75
Resistance: $41.90 - order block + bear golden pocket.
Target: $955
D.Y.O.R. DO NOT BLINDLY TAKE THESE TRADES.
Never Trust. Verify. PLEASE DO YOUR OWN ANALYSIS.
This is not financial advice. These are just my observations.
Technical Analysis is not about being right, it's about increasing your odds.
Be prepared to be wrong. Risk management is key. Capital preservation above all else.

Trading opportunity for AXSUSDTBased on technical factors there is a Buy position in :
📊 AXSUSDT
🔵 Buy Now
🪫Stop loss 5.300
🔋Target 1 6.500
🔋Target 2 7.500
🔋Target 3 8.600
💸RISK : 1%
We hope it is profitable for you ❤️
Please support our activity with your likes👍 and comments📝
