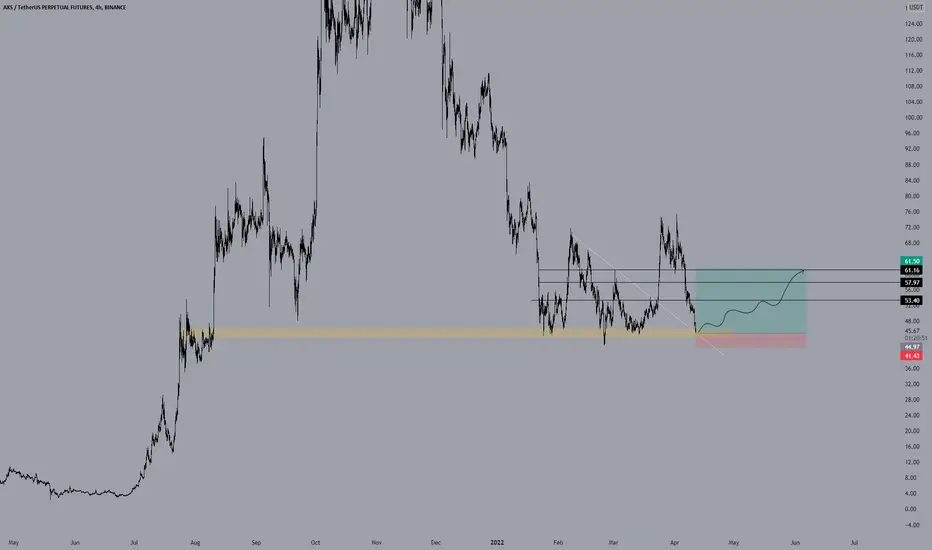
🔥 AXS Reversal From Support Zone: Upside PotentialAfter seeing a big bearish move late last year, AXS has seemingly found support around the $45 area. Yesterday, AXS hit this support zone again and is now reversing from it.
Assuming that BTC will not drop further, we can expect AXS to see more upside potential in the coming days/weeks. Targets placed at recent highs. A move below the support area would invalidate this bullish reversal move.
Happy trading!
AXSUSDT trade ideas

AXS Swing Trade reboot.The Bullish OB failed to hold on the last setup so we are reassessing and this is my perspective now.
I bought in large at 45, and I will add some more to my pot if we come back down into this Order Block.
We may not reenter this zone, so another entry idea is to buy the breakout of the trend line.
Not financial advice. DYOR. Use proper risk management when trading!
And... Have an amazing day :)

AXS, how to trade using KEY LEVELS? FREE education!Key Level. How can a common tool help you to earn more? Let's take Axie Infinity (AXS) as an example!
A key level is a local minimum or maximum. It can be clearly marked after a BIG price movement up or down (points of extremum). Key levels are often the price of 1, 10, 50, 100 dollars, because many traders pay attention to this numbers.
On the chart we have marked two key levels:
1. lower (for longs) - $44.68
2. upper (for shorts) - $72
When to open a trade:
1. on a test of the key level as support or resistance;
2. on false breakdown of the level.
IMPORTANT: IN BOTH CASES, VOLUMES MUST INCREASE! It`s an indicator that a big player opens a trade too!
Using the KEY LEVELS you could earn: +62%, +62%, +38%. Risk to reward for these trades from 1:7 to 1:14(!). It's a good statistic, right?
If you still have questions how to use the key level and what tools can be used to increase your profitability - write in the comments or to the DM.
Friends, push the like button, write a comment, and share with your mates - that would be the best THANK YOU.
P.S. I personally will open entry if the price will show it according to my strategy.
Always make your analysis before a trade.

axs longwe can see a bullish trend atfer bearish cycle in the market for axs we can use this analysis


Axie Infinity longAxie Infinity bounced off the support level. Bullish movement to resistance level at 145 is expected to happen. If the next resistance level will be broken up the AXS is supposed to reach 74.5.

axsHello traders .
Did you remember my last idea about the AXS ? in that idea I was talked a big move for the AXS , am I still think that the AXS is about to do something explosive or not ?

AXS - Buying in SPOTHey everyone :)
AXS do be looking good!
Strong support level , Trend line holding as support.
Entering with DCA . :)
Good luck.
$AXS: A LITTLE POSITIVITYHELLO GUYS
-We notice that the price bounced from the ceiling of the descending channel and reached the mid-line.
This middle line formed in the past a very solid support line from which the price rebounded several times before it was breached, then it turned into a solid resistance line and also the price bounced back from it several times and then was breached,
Today, it turns into a support line, and here it intersects with a very old stubborn and solid support line.
-Will it break through?
-Will he bounce?
-Will it go horizontally above the support?
-Regarding the stochastic indicator, I noticed that whenever the price hit the old support line, the stochastic was at its lowest level and the price rebounded after that, (note the yellow vertical lines)

Well this is not goodBINANCE:AXSUSDT
Massive Head & Shoulders. Combine with BTC going down and Ronin hack, I don't know when AXSUSDT can recover.

AXSUSDTPrice has reached to a strong resistance and a demand zone, also we have some good fundamental news about Axie Infinity. Im longing Axie,

Long: Lines on chart make online pokemon go BrrrrrrRrRRRrI have no clue what im doing or looking at but my gut tells me this thing looks like its about to go BrrRrrRRRrrrRrrrr
Rsi is also lookin vibey, she over sold.

axs to the moonhello every body ,here is very good potential for "Axie infinity" just manage your money for invest ;)

Axie Infinity (AXS) - April 10hello?
Traders, welcome.
If you "follow", you can always get new information quickly.
Please also click "Like".
Have a nice day.
-------------------------------------
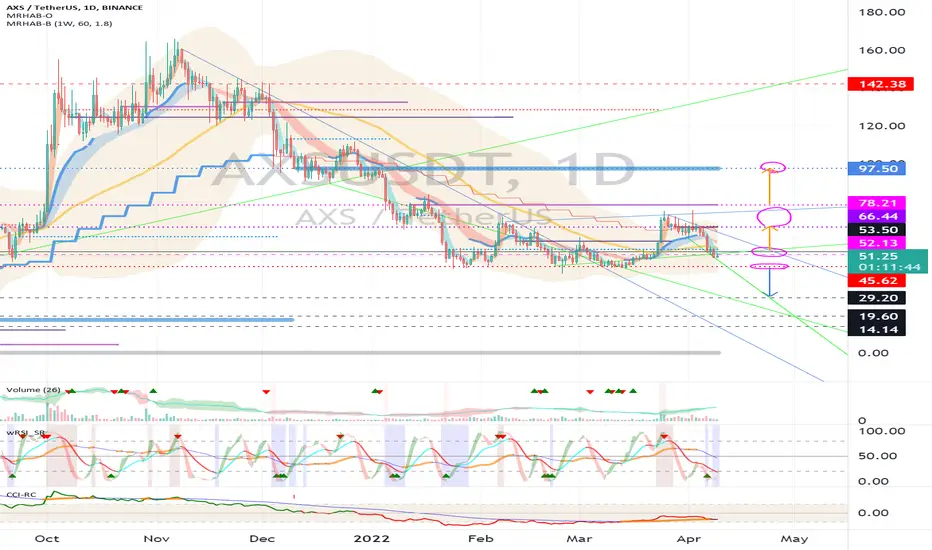
(AXSUSDT 1D Chart)
(buy)
- After confirming the support around 53.50
(Stop Loss)
- When it falls below 45.62 and receives resistance
(Sell)
- When resistance is received in the section 53.50-78.21
- When receiving resistance near 97.50
A whipsaw is likely at 53.50-78.21 as the indicators at 53.50 and 78.21 are inverted.
A move above 97.50 is expected to trigger a surge.
------------------------------------------------------------ -------------------------------------------
** All indicators are lagging indicators.
Therefore, it is important to be aware that the indicator moves accordingly with the movement of price and volume.
However, for convenience, we are talking in reverse for the interpretation of the indicator.
** The MRHAB-O and MRHAB-B indicators used in the chart are indicators of our channel that have not been released yet.
(Since it was not disclosed, you can use this chart without any restrictions by sharing this chart and copying and pasting the indicators.)
** The wRSI_SR indicator is an indicator created by adding settings and options to the existing Stochastic RSI indicator.
Therefore, the interpretation is the same as the traditional Stochastic RSI indicator. (K, D line -> R, S line)
** The OBV indicator was re-created by applying a formula to the DepthHouse Trading indicator, an indicator disclosed by oh92. (Thanks for this.)
** Support or resistance is based on the closing price of the 1D chart.
** All descriptions are for reference only and do not guarantee a profit or loss in investment.
(Short-term Stop Loss can be said to be a point where profit and loss can be preserved or additional entry can be made through split trading. It is a short-term investment perspective.)
---------------------------------
AXS longfalling wedge AXS is going to 83 $ stop loss at 45$ take profit at 75 first target , 2nd target 85 , 3rd target , 98

AXSUSDT 1D: Possible LONGAXSUSDT 1D: Possible LONG
We can see a rebound from the price level - of 52 on the 1D chart. In the middle term, this signal indicates that the price may increase to 87.

Axie InfinityWhat Is Axie Infinity (AXS)?
Axie Infinity is a blockchain-based trading and battling game that is partially owned and operated by its players.
To learn more about this project, check out our deep dive of Axie Infinity.
Inspired by popular games like Pokémon and Tamagotchi, Axie Infinity allows players to collect, breed, raise, battle and trade token-based creatures known as Axies.
These Axies can take various forms, and there are more than 500 different body parts available, including aquatic, beast, bird, bug, plant and reptile parts. Parts from each type class come in four different rarity scales: common, rare, ultra rare and legendary — and Axies can have any combination of body parts, making them highly variable and often rare and unique.
Each Axie is a non-fungible token (NFT) with different attributes and strengths and can be entered into 3v3 battles, with the winning team earning more experience (exp) points that are used to level up an Axie's stats or evolve their body parts. These Axies can be bred together to produce new and unique offspring, which can be used or sold on the Axie marketplace.
The Axie Infinity ecosystem also has its own unique governance token, known as Axie Infinity Shards (AXS). These are used to participate in key governance votes and will give holders a say in how funds in the Axie Community Treasury are spent.

AXSUSDT 1HHi Guys,
Nice rising wedge in hourly time. I explain it in a chart. I think its enough for trade .
👤SecondChanceCrypto
📅9.april .22
⚠️(DYOR)

AXS Swing TradeHey Lads and Ladies,
Here is how I will be trading AXS over the next few weeks, We pulled back to a really nice Dailly Bullish OrderBlock between the 0.618 and 0.786 Fib level.
We also filled in all the unhealthy Imbalance in the PA. So I am accumulating for the next swing high here.
Order 1 filled, I am looking for Order 2 to get filled by Monday before we take off, but they may not happen if the 4h Bullish OrderBlock holds up institutional buys get filled.
Not Financial Advice, DYOR before taking any trades and always use proper risk management when trading.

🔥 is AXS bears are in the trap ? 🤔 🔥Hello traders .
Did you remember my last idea about the AXS ? in that idea I was talked a big move for the AXS , am I still think that the AXS is about to do something explosive or not ?
If you want to read my last idea , you can find it in the related ideas down below this idea 👇
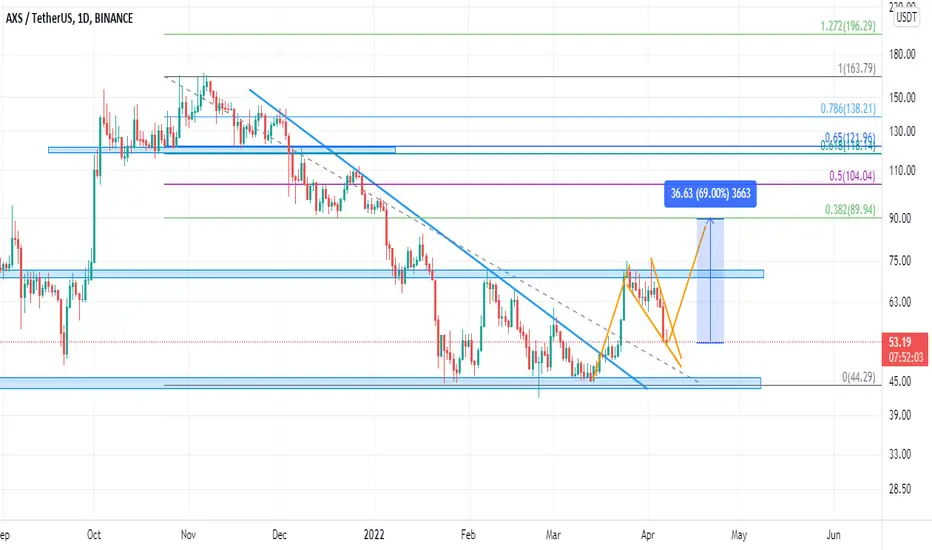
1_pattern :
In the chart above you can see that the price after testing the daily resistance structure started to retracement and currently price is in the falling wedge pattern which is a bullish pattern and when you see this pattern in a bullish trend you like what we have in the above picture you could call that as a flag pattern .
2_EMA Ribbon :
you can see that after price break above the the EMA Ribbon , it started to flipping bullish but after price hitting the the daily resistance , price started to retracement and break below the EMA Ribbon again , but still there is chance to goes above the EMA Ribbon again because the overall trend is still bullish in the daily time frame and AXS price didn't create a lower low .
3_TSI & RSI :
In the RSI we had a bearish divergence in the smaller time frame which is also obvious in the daily chart and this was a sign for the short term trend reversal , so by knowing that , you could take some profit from your long position or maybe open a short position after getting the confirmation of that .
In the TSI you can see that the it started to flip bearish but it still above the zero line so I personally don't consider it as a bearish sign .
4_ price target :
If price decided to break above the falling wedge or in the other word , flag pattern , the technical target of it , is near to the 0.382 Fibonacci level .
This is not a Financial advice and always trade based on your trading strategy ; have nice day my dear friends .
AXS going for another all-time high?Weekly timeframe for AXS shows a hidden bullish divergence, would it go for another all-time high?
===================
Divergence is when the price of an asset is moving in the opposite direction of a technical indicator, such as an oscillator, or is moving contrary to other data. Divergence warns that the current price trend may be weakening, and in some cases may lead to the price changing direction.
Divergence signals tend to be more accurate on the longer time frames. You get fewer false signals. Divergences on shorter time frames will occur more frequently but are less reliable.
READ THIS NOTE!!
Market can do anything specially on crypto, because of Bitcoin, investors often consider Bitcoin as the reserve currency of the cryptocurrency market, similar to the USD in the global stock markets. When bitcoin (BTC), the largest cryptocurrency by market cap, goes up, other digital tokens tend to increase in value as well. When BTC declines, it's likely that other players in the space will drop at the same time.

LONG AXS📍SIGNAL ID: #023📍
COIN AXS/USDT ( 10x )
DATE : 6 April 2022
Positions : BUY / LONG 💹
➖➖➖➖➖➖➖
Entry < $58
SL $46 - $52
TP $60 - $70
Falling wedge

Axie Infinity shortAxie Infinity broke trough the support level. Asset broke trough the ascending trendline. Bearish movement to support level at 45 is possible.
