Looking for a Bull Flag breakoutHello Friends!
If Axie Infinity can breakout from this bull flag, I like it to target 2 price points:
-$81.93
-$88.97
For this to have a chance to happen, it needs to hold above $64.50.
As always thanks for your follows, likes, and comments. Let’s learn and grow together. Cheers!
*This information and publication is not meant to be, and do not constitute, financial, investment, trading, or other types of advice. Do your own research.
AXSUSDT trade ideas

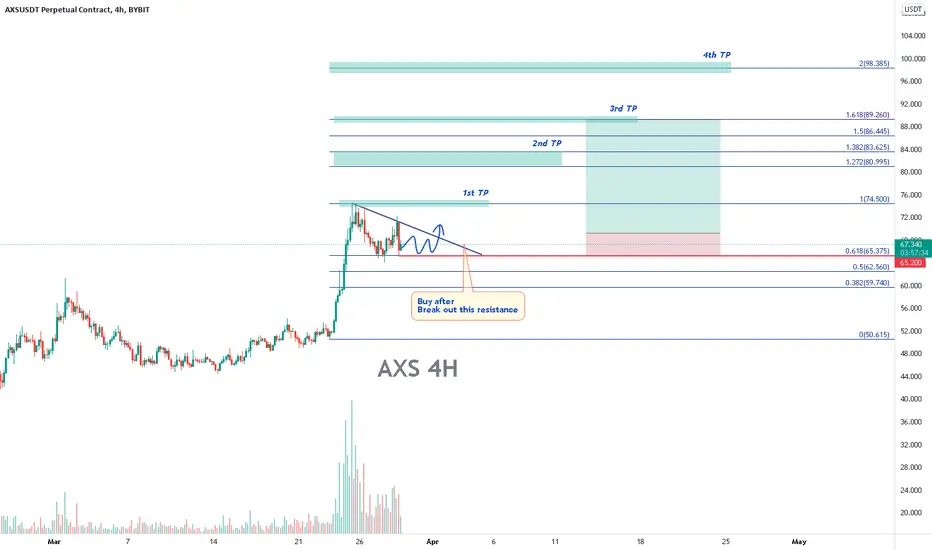
AXS - Buy it when break out this lineBYBIT:AXSUSDT
4H trend chart
-
AXS is consolidating and converging.
It's good for it to accumulate around $65
If price can break out the downtrend line, trading strategy as bleow.
-
Profit Targets:
a) 74.5----Fib(1)
b) 80.995~83.625----Fib(1.272~1.382)
c) 89.260----Fib(1.618)
d) 98.385----Fib(2)
Stop losses:
a) 10.882-----Red horizontal ray
-
If you like this analysis, smash the "like button" and leave a comment below to share your thoughts
or let me know what crypto you want to see!
Trading is a reflection of yourself. Learn more daily and be ready for every opportunity.
Have a nice trading!
AXS Starting New Leg Up?Looks like AXS is starting a new leg up if the support holds at the bottom median line of the Green Pitchfork.
Fairly smooth sailing once price clears a few local resistance zones.

AXS SwingAXS Short to Midterm Swing
Preliminary Entry: 70.04
PE to 1.272 Fibonacci: 21.15%
PE to 1.618 Fibonacci: 38.28%
Limit Sell Range: 85.13-97.10
Invalidation Zone: Under 57.14
*Not Financial Advice, Please DYOR
Allow 2-14 Days for Swing
Good luck and Safe Trading!

buy AXS
Given the range of support can be a good opportunity to buy. In fact, the pullback is on the rise. Buy step by step with low lever. It is possible to modify bitcoins. Be sure to observe the loss limit.

AXS BullishHistoric support/resistance being broken and successfully retested. Slightly early call but with the rest of the market looking bullish, Im confident.

Don't miss opportunity for long position AXSUSDTall you need to know is in the chart
look closely and make your position smartly
this is just my idea and not a financial advice
this analysis is just for PRO and its not a buy/sell signal
leave comment

AXSUSDT - SETUPAXSUSDT price is moving in a rectangular box and now bulls chase again the top of that zone and they are looking aggressive in this area. If they sustain the move they can easily move towards the next resistance level.

AXSUSDT-LONGBased on technical factors there is a long position in :
📊 AXSUSDT Axie Infinity
🔵 Long Now 69.26
🧯 Stop loss 63.93
🏹 Target 1 78.48
🏹 Target 2 91.91
🏹 Target 3 111.11
💸Capital : 1%
We hope it is profitable for you ❤️
Please support our activity with your likes👍 and comments📝


$AXSUSD - Symmetrical triangleHello everyone!
symmetrical triangle spotted on AXSUSD chart, the path on the chart is an estimate, wait for a breakout above $67.8

Axie created a triple bottomaxie triple bottom let's goooo. resistance and support marked on chart. will we make a run to ath? let's hope btc stays bullish. not a financial advisor do your own research. the king paves the way. always use low leverage. always use stop loss and have an exit strategy. good luck and like/follow if you liked my chart.

AXS ... ready for one bullish leg ...it breaks bearish 4h trendline
have big volume ...
had daily pullback and long shadows from behind, it signs to wanna bullish movement

AXIE long$AXS is bouncing off the Fibonacci 0.618 level which is also matching the resistance level which turned into support after it was broken to the upside. After the bounce off, bullish movement is likely to con tinue and reach the 74,6$.

AXS/USDTesting/tracking elliot wave theory. Please do not trade off idea without S/L. Not financial advice.
Link to previous chart:
The counts were a bit off; wave 5 top was a lot lower and we've been correcting since then. The bottom also went a lot lower than predicted. We should be moving back up to the bigger wave (3) cycle.

ChannelWe see how price react on our channel just a break above the uptrend line,we get our enter pirce for a bull move

AXS Bullish SoonAXS looks to have completed it's bearish impulse move with wave 5 (Feb 7-Feb 23) being confirmed with 5 fractal sub waves being counted inside.
Waiting to see how the market is on Monday before picking up this setup but I'm watching for bids around $46-47.

AXS/USDT Longs into $84Good long opportunities for AXS to play into these levels here between $65 and $49. We have a nice choCH on these lows here on this daily demand level so it could be a great opportunity to take some longs up once inefficiency or POI gets mitigated and we have some lower TF confirmation for longs.

AXS/USDTHello everyone, if you like the idea, do not forget to support with a like and follow.
BULLISH PATTERN
REMINDER: THIS IS NOT FINANCIAL ADVIC

axsusdt shortAfter a channel, now stuck in a suffering trading, I will probably return to the floor of suffering because the probability of selling is much higher. At this price, I am just a seller.

bull flag pattern.simple charting by newbie.strong possibility to climb up again when 382 fib make a strong support with the confluence of bull flag pattern, bouncing at 382 has a high possibilty of impulsive move. nfa ..hit like if you agree to my idea.

Short AXSAXS showed an Adam & Eva bullish pattern, and will fill the FVG between 69 and 74. Then, a bearish Cypher Pattern will be completed and a significant pullback should be performed.
