AXSUSDTAXS ~ 1W
#AXS Continuing to maintain this support block,. If you still have Conviction on this coin. This support block would be a very good buying place for now. at least for a 20%++ increase in the short term.
AXSUSDT trade ideas

Taking advantage of a potential wyckoff breakoutAs the title says, axs is on a potential wyckoff breakout.
A wyckoff breakout is a breakout so big to the upside that you won't have to worry about your bills for the next 5 years.
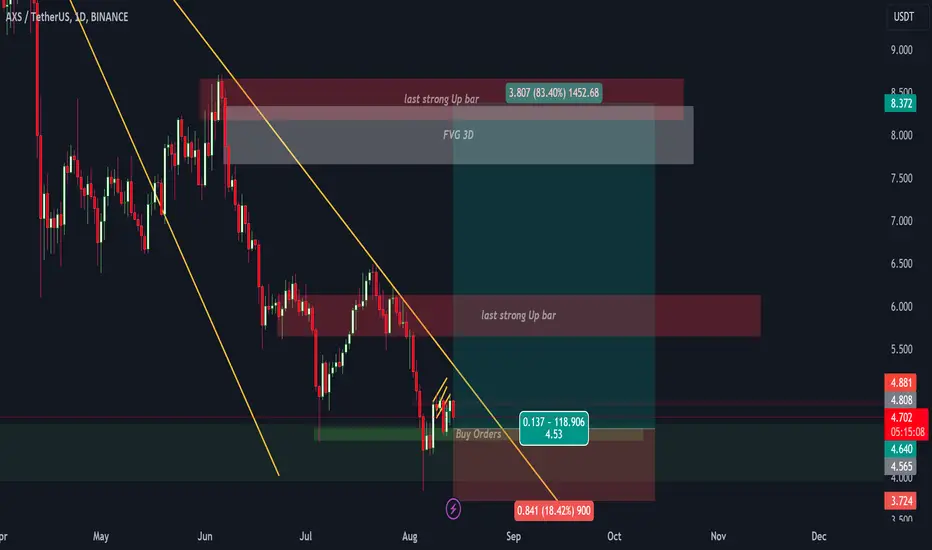
Along with the potential wyckoff breakout, this asset has a potential trade setup for a value rotation to the upside.
I have seen much of this fractal leading into the highest of the range only to be rejected to the downside.
However, we are sitting pretty at the bottom of the range and the highest probability from the setup (if conditions are met), is to blast thru to the upside.
So what are the conditions?
1. Pretty much just go back to the value range, we are longing the VAL along with the reclaim of a weekly

Short trade
Sellside trade
Entry 4.781
Profit level 4.738 (0.90%)
Stop level 4.792 (0.23%)
RR 3.91
Reason: Waqar Asim
method of price action
ideology and market
structure analysis

AXSUSDT Bulls Take Control! Key Levels in Sight.Analysis for AXSUSDT 15m Timeframe – Long Trade
Current Position:
Entry: $4.677
Current Status: Target 1 (TP1) at $4.823 has been successfully achieved. Awaiting further momentum to hit higher targets.
Technical Overview:
Risological Dotted Trend Line: The upward curve of the trend line indicates positive momentum and a strong bullish sentiment in this timeframe.
Volume Analysis: Current volume stands at 1.03M, lower than the 30-day average of 1.91M. Despite the lower volume, the price has sustained its upward trajectory, suggesting underlying buying interest and potential accumulation.
Key Performance Metrics:
Short-Term Weakness: The asset has shown negative returns over the last 1 week (-5.63%) and 1 month (-9.62%), reflecting recent downtrends.
Long-Term Resilience: Despite the short-term declines, AXS has a slight positive return over the past year (+2.12%), indicating resilience in its long-term outlook.
Target Levels:
TP1: $4.823 (Achieved)
TP2: $5.060
TP3: $5.296
TP4: $5.442
Stop Loss (SL): Placed at $4.559, providing a balanced risk-to-reward ratio for this trade setup.
Outlook: The trade remains bullish, with further targets potentially reachable, provided AXSUSDT can maintain momentum. Keep an eye on volume trends for additional confirmation of sustained buying pressure.
This setup aligns well with a continuation in the bullish trend, leveraging favorable price action to target the next levels.

AXS/USDTJust love it when people get bearish on crypto when a graph looks like this! Lets delete all nonsense indicator, chart pattern, wave analysis crap for one minute... just look at this graph and tell me how bearish can we be? LOL

Long trade
2min TF overview
Buyside trade idea
30min TF Structure
1min TF Entry
Entry 5.165
Profit level 5.298 (2.58%)
Stop level 5.160 (0.10%)
RR 26.6
Reason: Buyside bias observed on the 2-minute, time frame forming higher highs, followed by marking out pivotal price points highlighted yellow for additional confluence with bias.

AXS is glanced by the market?There is unusual activity in the volume transaction in the latest 24 hours.
Maybe we can follow the trend.
RULE:
1-3% from capital.
Exit 25% if the price hits TP 1, and put stop loss in the Entry Price.

AXL/USDT Potential Breakout AheadAxs/USDT is showing potential for a breakout from a symmetrical triangle pattern on the 4-hour time frame. A solid breakout could happen soon. If the price breaks out and successfully retests the breakout level, we might see a surge of 40-80% in the coming days. Keep an eye on this movement, as it could be significant. This is not financial advice—please do your own research.

AXS USDT- CLICK HERE TO SEE ANALYSISIf price rejects from the bearish OB, Then we can watch the below OB

I have bought AXS From the AXSUSDT chart, it shows:
Market Trend: The chart is currently in a clear downtrend along the EMA (Exponential Moving Average) line, with the 100-day EMA and 200-day EMA still above the price chart, indicating strong resistance.
Important Support: The support area around 4.145 USD has been tested several times. If the price breaks this support level, it may see a continued correction to the 3.843 USD and 3.831 USD areas, which were previously rebounded.
Stochastic RSI: It is in the oversold zone (below 20), indicating that the market may have a chance to recover in the short term due to weaker selling pressure, but other indicators should confirm it.
RSI (Relative Strength Index): The RSI value at 40.61 is still in the downtrend zone. If the RSI value increases and crosses the 50 line, it may be a sign that the price has a chance to return to the uptrend.
Trading Volume: Trading volume has decreased during the price correction, which may indicate that selling pressure is starting to weaken. Or there are fewer sellers
Entry Recommendation:
Buying at the support level of 4.145 USD should consider waiting for confirmation from Stochastic RSI that there is a reversal from the oversold zone and see if the RSI value can cut through the 50 line. If so, it may be a good time to buy.
Set the stop loss below the important support level at around 4.00 USD to hedge the risk if the price falls below the support level.

AVXUSDTThe rising swing trade volumes indicate heightened market activity, while algorithmic analysis signals the potential onset of a bearish trend.

#axs is getting ready for moving up! #axs is gaining momentum for increase continuation. While scores by ScorehoodAI seems positive, a try for resistance test will not be a surprise. Let's follow closer!

#AXS/USDT#AXS
The price is moving in a descending channel on the 12-hour frame and is sticking to it very well and is about to break upwards
We have a bounce from the lower limit of the channel at a price of 4.00
We have an upward trend on the RSI indicator that is about to break, which supports the rise
We have a trend to stabilize above the moving average 100
Entry price 4.80
First target 5.80
Second target 6.40
Third target 7.17

#AXSUSDT On the Edge of a Major Breakout From Descending ChannelYello, Paradisers! Are you ready for what could be a game-changing move in the #AXS market? Let's look at the latest analysis of #AXSUSDT:
💎We're closely monitoring the strong potential for a bullish continuation from a critical support zone at $4.47. For those tracking #AXS, the signs are clear—#AxieInfinity is gearing up for a breakout from the descending channel formation, and it could happen soon.
💎Currently, NYSE:AXS is following a descending channel pattern, and a breakout from this structure could send prices soaring. The first key target after a breakout is the minor resistance at $6.01. If #AXS holds steady above $6.018, we could be on the verge of a significant rally.
💎Historically, we’ve seen explosive moves like this, and a breakout above the critical $7.63 resistance could pave the way for even higher resistance zones.
💎But if momentum weakens near this key demand zone, we could witness a pullback to the lower demand area around $3.82. A daily close below $3.82 would invalidate the bullish setup and open the door to further declines.
Stay focused, patient, and disciplined Paradisers.
MyCryptoParadise
iFeel the success🌴

AXSUSDT Forms Bullish Falling Wedge PatternAXSUSDT technical analysis update
AXS is moving towards the wedge resistance trendline, signaling a potential breakout. Once the breakout is confirmed on the daily chart, we can expect a strong bullish move in AXS.
Regards
Hexa

AXSUSDTAXS ~ 1W
#AXS If you have Conviction on this coin,. You should get a good price to start buying from here.

AXS SETUP
### Entry Points
- **Primary Entry**: 4.712 USDT (38.2% Fibonacci retracement)
- This level shows a good opportunity for entry as it aligns with the Fibonacci retracement level and potential support zone.
- **Secondary Entry**: 4.041 USDT (lower accumulation zone)
- If the price drops, this is another key level for buying, close to the 1.0 Fibonacci extension.
### Target (Take Profit) Levels
- **First Target (TP1)**: 5.242 USDT (61.8% Fibonacci retracement)
- The first target aligns with a common resistance level at the 61.8% Fibonacci, where partial profit-taking is advised.
- **Second Target (TP2)**: 7.000 USDT
- A higher target that suggests a potential breakout if the momentum continues.
- **Third Target (TP3)**: 9.000 USDT
- A more extended target for those holding the position longer, representing a strong rally.
### Stop Loss
- **Stop Loss**: 3.602 USDT
- This is below the recent low and the 1.0 Fibonacci level, providing a solid point to minimize losses if the trade does not work out.
### Key Levels and Observations
- **Fibonacci Levels**:
- 38.2% retracement at 4.712 USDT.
- 61.8% retracement at 5.242 USDT (TP1).
- 88.6% retracement near the lower support zone.
- **Harmonic Pattern**: The chart appears to show a potential harmonic pattern that indicates a bullish reversal if it completes.
- **Volume Profile**: Increasing volume at lower price levels indicates potential accumulation by buyers.
### Trade Plan Summary
1. **Enter** the trade around 4.712 USDT or lower at 4.041 USDT if the price pulls back further.
2. **Set Stop Loss** at 3.602 USDT to limit downside risk.
3. **Target Levels**:
- **First Target (TP1)** at 5.242 USDT.
- **Second Target (TP2)** at 7.000 USDT.
- **Third Target (TP3)** at 9.000 USDT.
This strategy focuses on taking advantage of the Fibonacci retracement levels and potential bullish harmonic pattern, with defined targets and risk management through the stop loss level.

AXSUSDT: Weekly support, consolidation phase!!Join our community and start your crypto journey today for:
In-depth market analysis
Accurate trade setups
Early access to trending altcoins
Life-changing profit potential
Hello everyone,
I'm curating a list of promising projects to hold for the upcoming bull run.
1. FETUSDT (already posted)
2. ONDOUSDT (already posted)
3. AAVEUSDT (already posted)
4. ANKRUSDT (already posted)
5. ORDIUSDT (already posted)
6. TURBOUSDT (already posted)
7. AXSUSDT
Let's analyse AXSUSDT both fundamentally and technically.
FUNDAMENTAL ANALYSIS:
Axie Infinity is a blockchain-based game where players collect, breed, and battle fantasy creatures called Axies. Developed by Sky Mavis, the game incorporates elements of cryptocurrency and NFTs (non-fungible tokens). Axies are unique digital assets that can be owned, traded, and used in turn-based battles. Players can earn cryptocurrency through gameplay, with main tokens being AXS (Axie Infinity Shards) and SLP (Smooth Love Potion). Additionally, players can buy and develop virtual land within the game. Axie Infinity operates on the Ethereum blockchain and uses its own sidechain, Ronin, to enhance scalability and reduce transaction fees.
TECHNICAL ANALYSIS:
AXSUSDT is currently trading within a descending triangle pattern, indicating a potential bullish reversal. The price is currently at a key support level, and technical indicators suggest a positive outlook:
MACD: Flat MACD indicates a period of consolidation.
StochRSI: A bullish crossover above the oversold zone suggests a potential uptrend.
RSI: A bullish crossover is in progress, further reinforcing the bullish sentiment.
Buying Levels:
$3.695 to $4.620 (upper buying zone)
$1.272 to $1.989 (lower buying zone)
Target Level:
$19.5 (short term)
$165 (long term)
If you find this analysis helpful, please hit the like button to support my content! Share your thoughts in the comments and feel free to request any specific chart analysis you’d like to see.
Happy Trading!!

$AXS I'm With You Bro $Thanks for your supports 😍
We are working 24/7 to send you best analysis in FVGs
Boast it if you Liked ⛽
We are in SuperSupport zone 🦸♂️
Price can each time jump and back to supper suport then start a new way to TOP or to BOTTOM
if Supper support zone Broke then we would waiting for Losing price again but if Pump it as many times did it before
so be aware of AXS and their news
#TradeWithMky
@TradeWithMky
#TradeWithMky
AXS Buy opportunityAXS
top Metaverse leader in #2021
right now moving around important support
buy zone 3.1-4.5 & #HODL
Targets
35$
45$
72$
#NFA
#DYOR
Don't forget to follow me
Like + Follow = Appreciation

Axie Infinity (AXS) to $3.90Most of tradingview.com is long with Axie Infinity ideas. Being the contrarian, I’m here to tell you a long position is probably a mistake. Why?
So simple.. support and resistance. The two red arrows show confirmed resistance at 12 to 13 dollars that followed with a break of market structure.
The only way forward now is for price action is to confirm past resistance as support. Those levels are 70% and 90% corrections below.
A study of the AXS-BTC pair (below) continues to print price action under active resistance. The trend is down. You may remember something that was said about legacy alt tokens not performing in this bull cycle?
As an example of the token-btc pair study, you may remember the ‘Auction to $40 from $4’ idea? (below). What might not have been obvious at the time was the study on the Auction-btc pair. A clear break of resistance.
If you’ve made it this far, an idea on the Gas Neo token was recently published. You've read above. Why did I publish Gas token?
Ww
Auction.btc September 2023
Auction to $40
Weekly auction-bitcoin pair

AXS (Axie Infinity) Falling WedgeTrade setup : Price is in a Downtrend, however, it's trading in a Falling Wedge pattern, which typically resolves in a bullish breakout and a trend reversal. We wait for such a breakout.
Patterns : Falling Wedge Usually results in a bullish breakout . When price breaks the upper trend line the price is expected to trend higher. Emerging patterns (before a breakout occurs) can be traded by swing traders between the convergence lines; however, most traders should wait for a completed pattern with a breakout and then place a BUY order. Learn to trade chart patterns in Lesson 8.
Trend : Short-term trend is Strong Down, Medium-term trend is Strong Down and Long-term trend is Strong Down.
Momentum : Price is Oversold currently, based on RSI-14 levels (RSI < 30).
Support and Resistance : Nearest Support Zone is $4.00. Nearest Resistance Zone is $7.00, then $9.00.

AXS Technical Analysis in Weekly TimeframeHello everyone, I’m Cryptorphic.
For the past seven years, I’ve been sharing insightful charts and analysis.
Follow me for:
~ Unbiased analyses on trending altcoins.
~ Identifying altcoins with 10x-50x potential.
~ Futures trade setups.
~ Daily updates on Bitcoin and Ethereum.
~ High time frame (HTF) market bottom and top calls.
~ Short-term market movements.
~ Charts supported by critical fundamentals.
Now, let’s dive into this chart analysis:
AXS has been in a downtrend since it hit its all-time high back in November 2021. The price failed to rise to its potential level and is currently close to its support level.
NYSE:AXS is expected to hold this support level, which ranges between $3.3 and $4.5. If the market favors it, the price is expected to rebound and rally, breaking above the resistance trendline.
Key levels:
- Important Support: $3.3-$4.5.
- Resistance: $6.6.
- Targets: $12.5, $18.8, $36, $66.5.
- Invalidation Point: A close below $3.3 support level.
DYOR. NFA.
Please hit the like button to support my content and share your thoughts in the comment section. Feel free to request any chart analysis you’d like to see!
Thank you!
